Ethereum Price Analysis: ETH Finally Overcomes $300
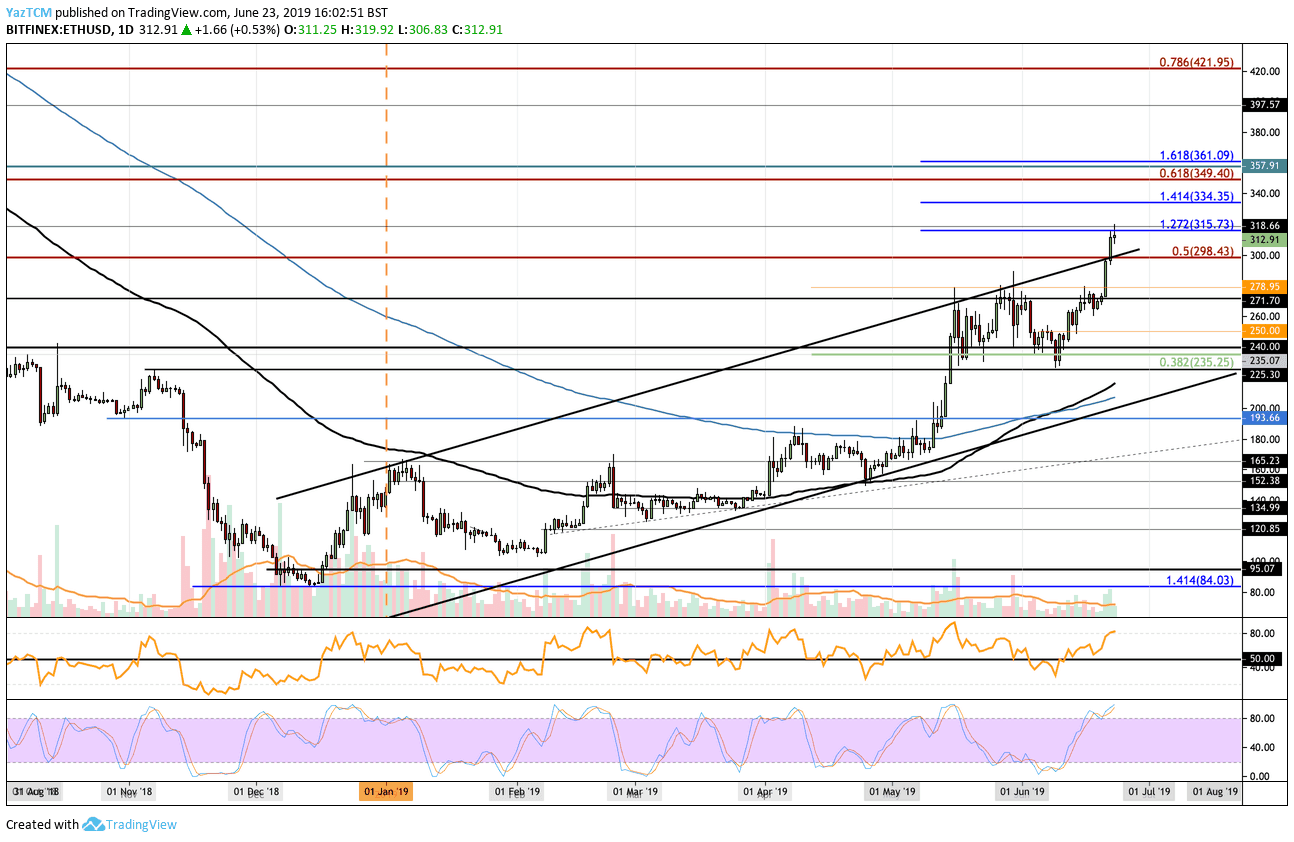
Ethereum finally broke above $300, creating a fresh 2019 high at around $319 for the first time since August 2018. The cryptocurrency now trades at a price of around $312, marking a 15% price increase over the past week.
Ethereum was struggling to break above the $278 resistance level during both May and June this year. However, Bitcoin’s latest rally which got it over $10,000 allowed ETH/USD to break the resistance at $300.
Ethereum remains the second largest cryptocurrency with a market cap of about $33 billion. The coin has now seen an explosive 130% price surge over the past 3 months.
Looking at the ETH/USD 1-Day Chart:
- Since our previous ETH/USD analysis, Ethereum went on to break the $278 resistance level and surge past $300. We can also see that ETH managed to climb up above a long term ascending price channel that has been in play through the entire period of 2019.
- From above: The nearest level of resistance now lies at $315 which contains a short term 1.272 Fib Extension. Above this, further resistance lies at $334 (1.414 Fib Ext) and $350 (long term bearish .618 Fib Retracement). If the bulls continue above $350, more resistance is found at $361, $280, $397, and $400.
- From below: The nearest level of support lies at the $300 level. Beneath $300, further support lies at $279, $271, $260, and $250. If the selling continues below $250, we can expect more support at $240, $235, and $225.
- The trading volume has remained relatively high over the past few days as it’s above the average for the month.
- The Stochastic RSI has recently entered overbought conditions as we wait for a bearish crossover signal to indicate we are heading lower. Furthermore, the RSI is close to extremely overbought conditions which shows the coin’s price may be overextended.
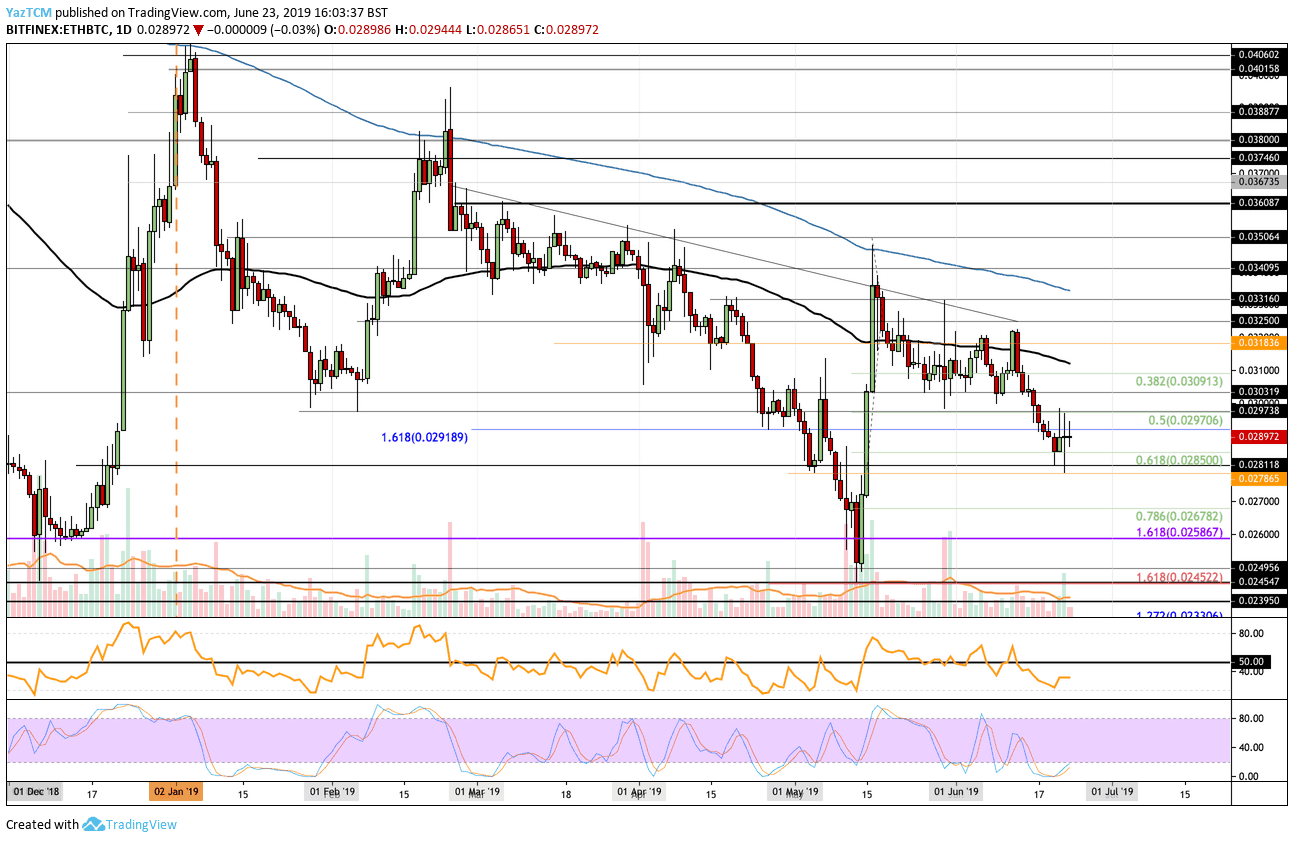
Looking at the ETH/BTC 1-Day Chart:
- Against Bitcoin, we can see that ETH has fallen further beneath the 0.029 BTC level. However, it still managed to find strong support at the 0.0285 BTC level where the short term .618 Fib Retracement lies.
- From above: The nearest level of resistance is at 0.029 BTC and 0.02970 BTC. Above this, higher resistance is found at 0.030 BTC, 0.0303 BTC, and 0.0309 BTC. If the bulls continue above 0.031 BTC (and the 100 days EMA), higher resistance can be found at 0.03183 BTC and 0.0325 BTC.
- From below: The nearest level of support is now at the 0.0285 BTC level. Beneath this, we can find more support at 0.02818 BTC, 0.028 BTC, and 0.0275 BTC. If the selling continues below that, more support is found at 0.027 BTC and 0.02678 BTC.
- The trading volume has remained relatively average for this market.
- The Stochastic RSI has recently produced a bullish crossover signal in oversold territory which suggests that the bulls may be ready to push higher.
The post Ethereum Price Analysis: ETH Finally Overcomes $300 appeared first on CryptoPotato.