Ethereum Price Analysis: ETH Consolidates Around $220, What’s Next?
Ethereum has somewhat stabilized over the past week, marking a slight 3% decline. ETH currently trades at around $220. This brief stint of sideways action comes after Ethereum suffered a precipitous 27% price drop from $300.
Despite the price falls, Ethereum remains the second-largest cryptocurrency with a market cap of $23.72 billion.
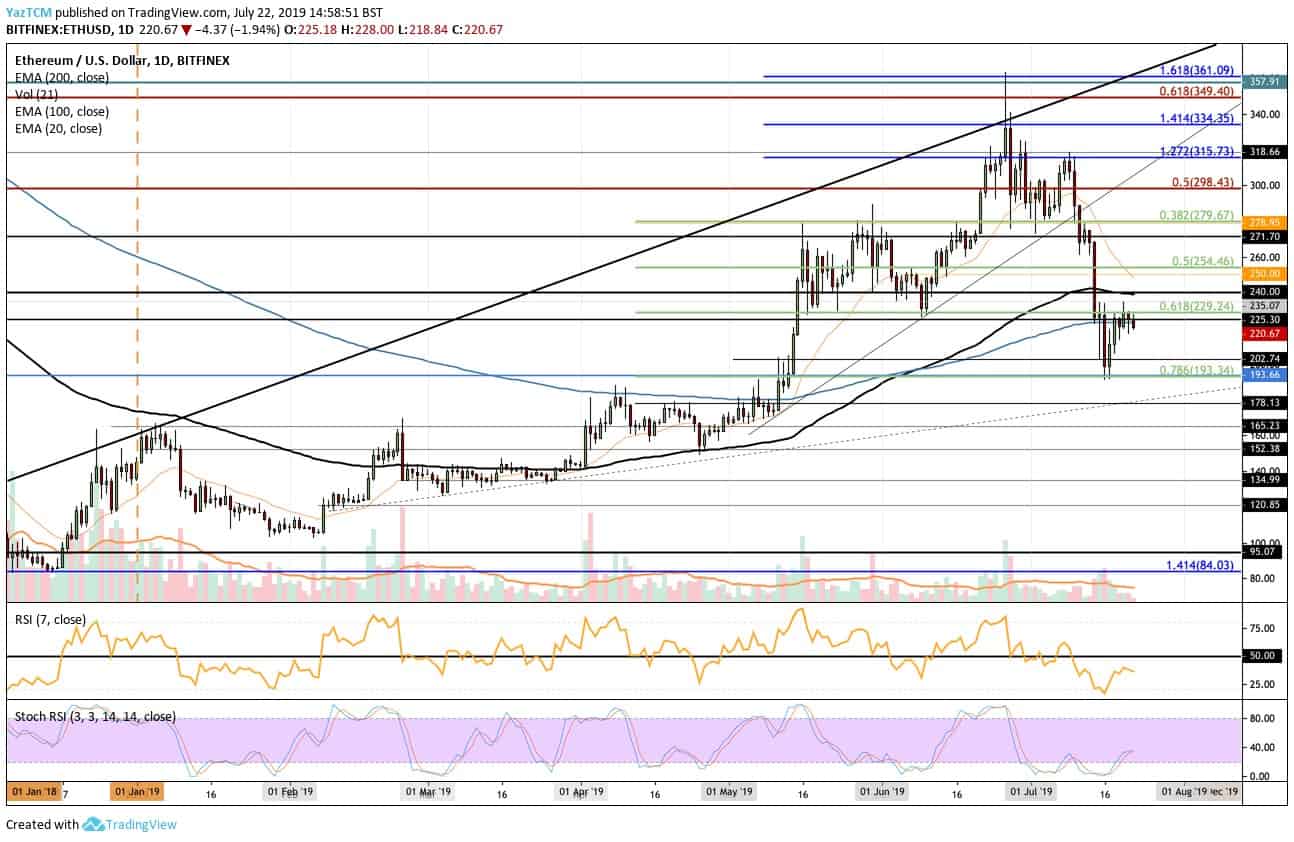
Looking at the ETH/USD 1-Day Chart:
- Since our previous ETH/USD analysis, there hasn’t been much action against the USD. Ethereum currently trades around the strong resistance of $220 which is provided by the 200 days EMA and the short term .618 Fib Retracement.
- From above: If the bulls can push the price above the current levels, we can expect higher resistance at $240 which contains the 100 days EMA. Above $240, resistance lies at $250, $254, $280, and $300.
- From below: The nearest level of support now lies at $220, provided by the 200 days EMA. Beneath this, further support lies between $202 and $200. If the selling continues beneath $200, the next levels of support lie at $193, $178 and $165.
- The trading volume has decreased substantially during this week which is a sign that the selling may be over pretty soon.
- The RSI remains beneath the 50 level which shows that the sellers still remain in control of the market momentum.
Looking at the ETH/BTC 1-Day Chart:
- Against Bitcoin, we can also see some stabilization as the cryptocurrency continues to trade at the 0.021 BTC level. This level has provided very strong support during the past week. However, if the sellers continue to test. it will more than likely break beneath.
- From above: The nearest level of resistance lies at 0.02134 BTC and 0.02192 BTC. If the bulls can continue above 0.022 BTC, higher resistance is found at 0.02295 BTC and 0.002395 BTC.
- From below: If ETH drops below the support at 0.021 BTC, we can expect the next level of support to be located at 0.0215 BTC and 0.0204 BTC. Beneath this, further support lies at 0.020 BTC and 0.01967 BTC.
- The trading volume has also been decreasing this past week.
- The Stochastic RSI has recently produced a bullish crossover signal in oversold territory as we wait for the moving averages to expand away from each other to show the bullish pressure is incoming.

The post Ethereum Price Analysis: ETH Consolidates Around $220, What’s Next? appeared first on CryptoPotato.