Ethereum Price Analysis: ETH Bulls Facing a Test Above $1K After a Massively Volatile Day
ETH/USD – Ethereum Breaks $1000 and Surges As High As $1,161.
Key Support Levels: $975, $915, $855.
Key Resistance Levels: $1042, $1100, $1140.
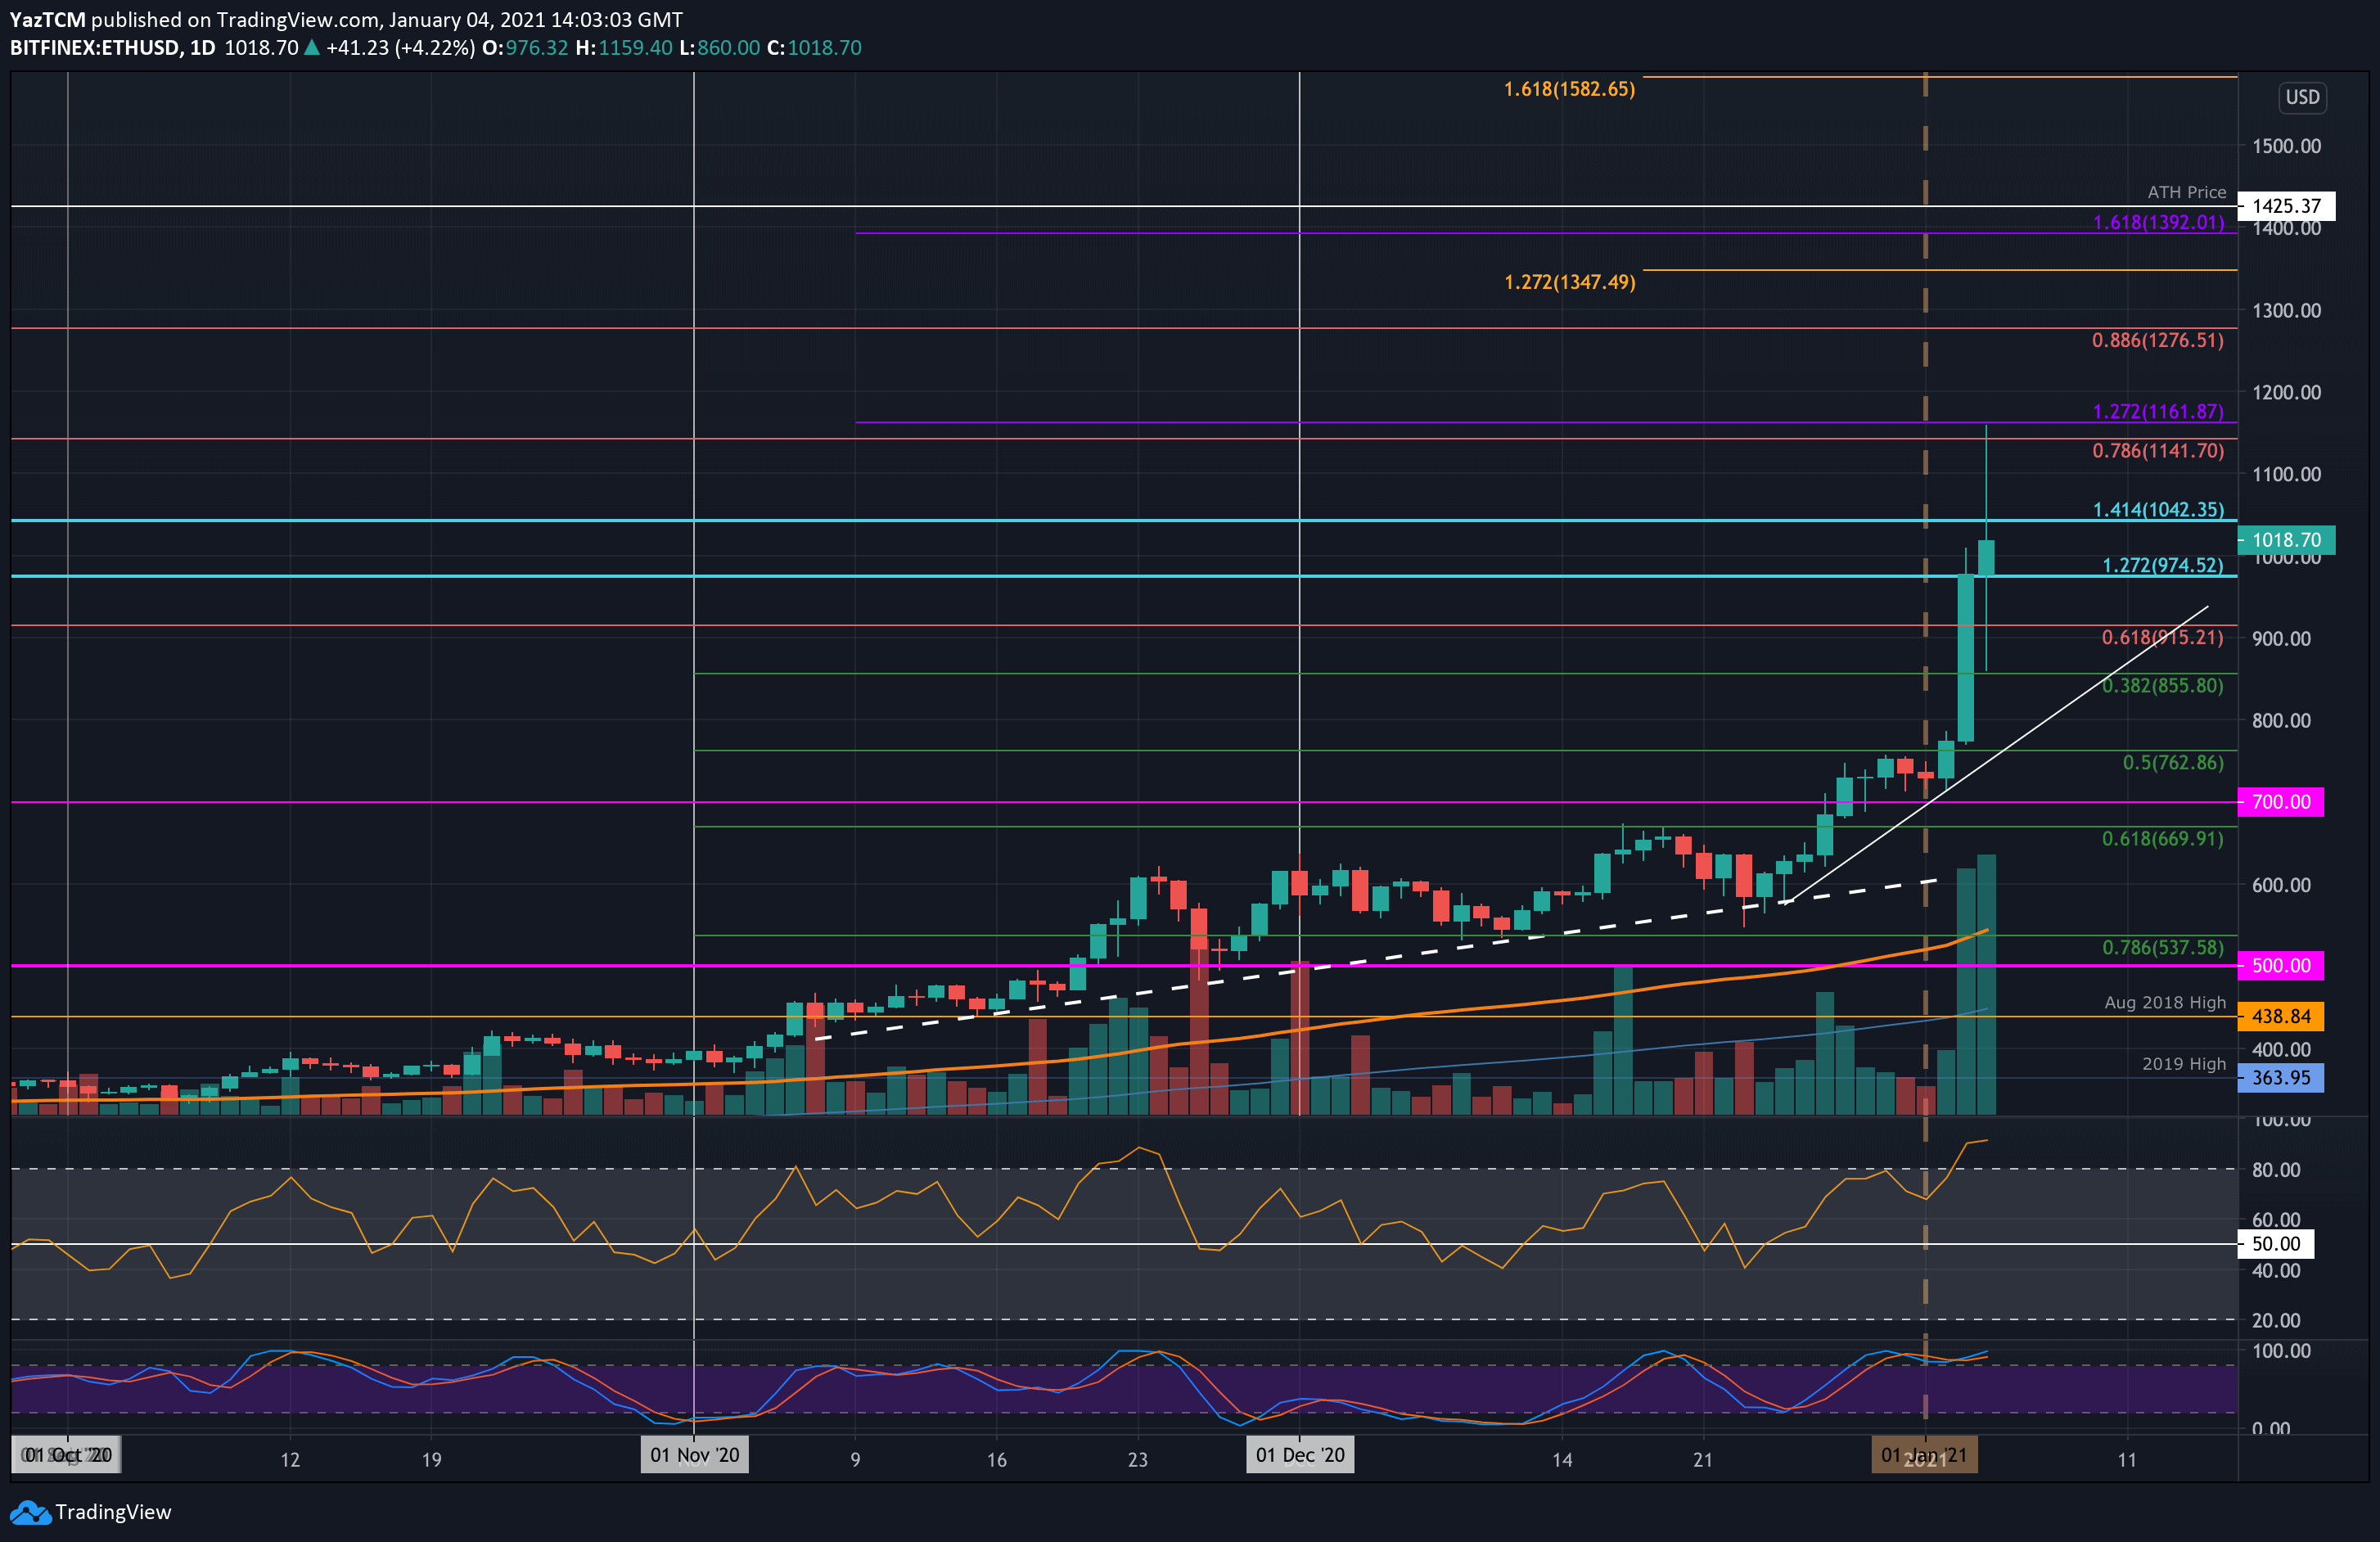
Ethereum has surged 40% since the start of 2021, allowing the cryptocurrency to break above $1000 for the first time since Jan 2018. Yesterday, ETH pushed upward from $760 and closed the daily candle at $975 (long term 1.272 Fib Extension).
Today, ETH continued to reach as high as $1161, where it met resistance at a 1.272 Fib Extension level. Unfortunately, the sharp drop in BTC caused ETH to head lower into the .382 Fib Retracement support at $855.
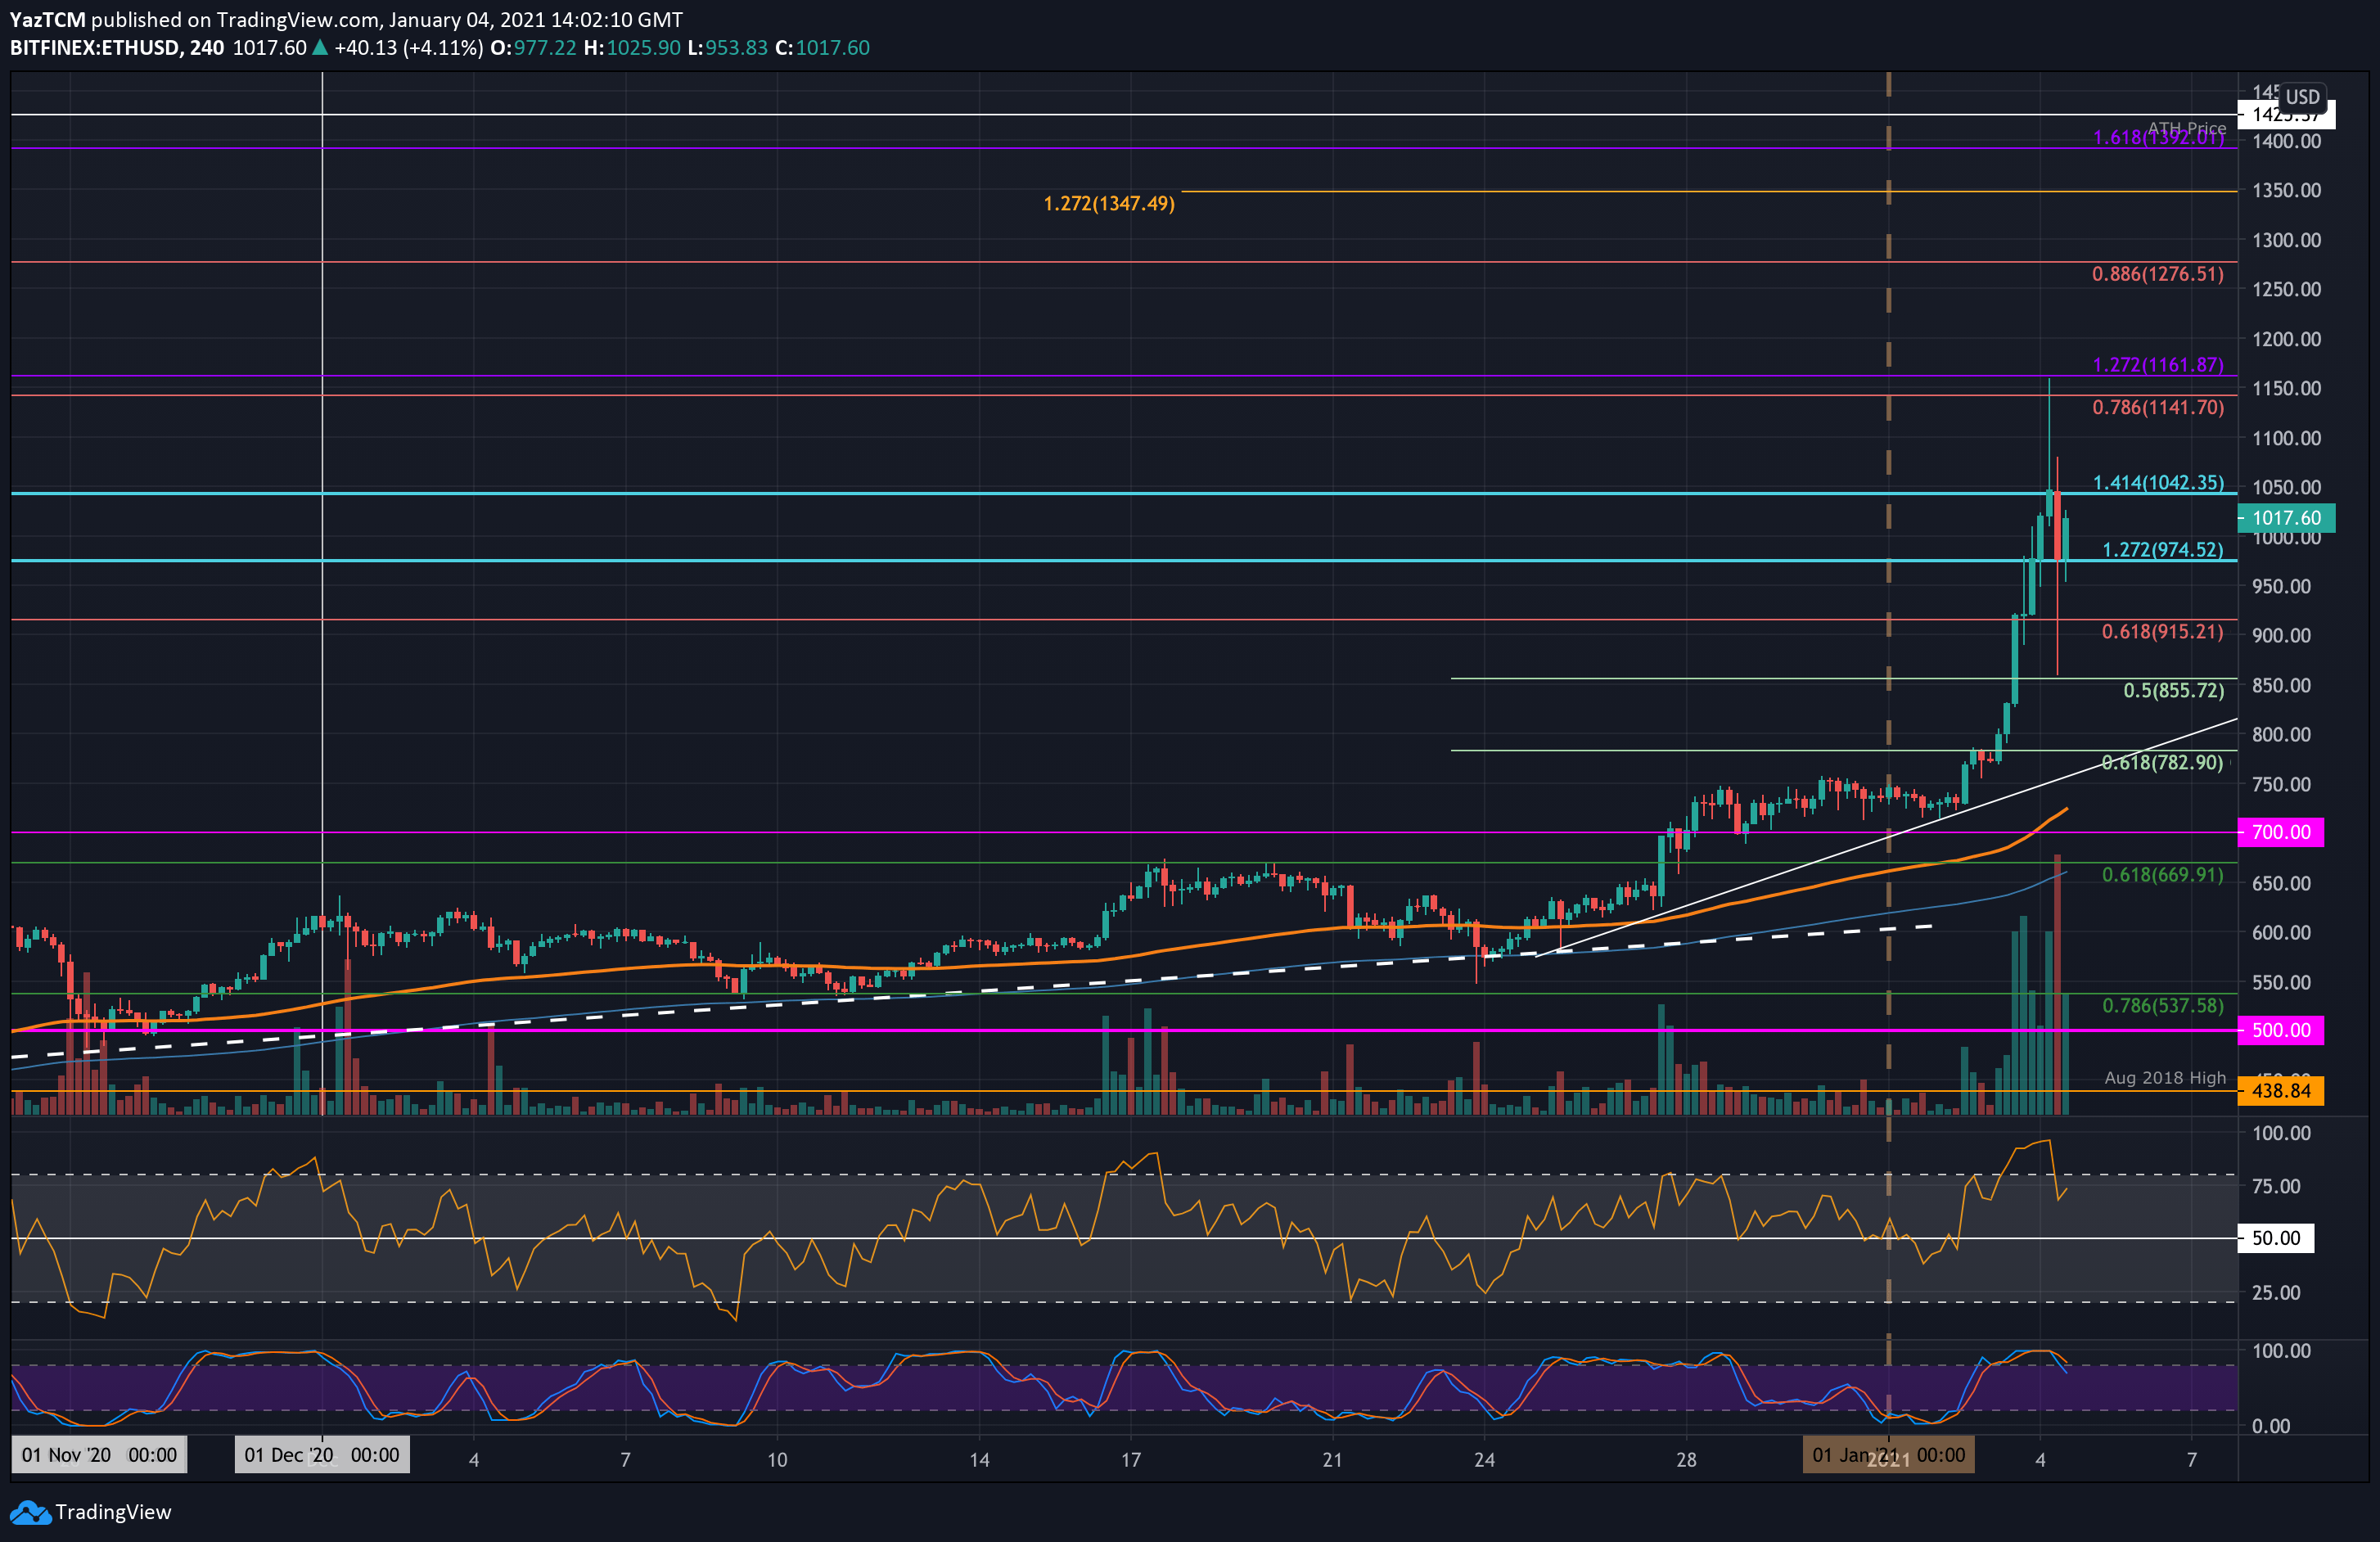
The bulls have regrouped since hitting $855 and have rebounded to trade back above $1000 at the time of writing. More specifically, on the 4HR chart, ETH never closed a 4HR candle beneath $975, where it closed yesterday.
ETH-USD Short Term Price Prediction
Looking ahead, if the buyers push higher, the first level of resistance lies at $1042 (long term 1.414 Fib Extension – turquoise). This is followed by $1100, $1140 (long term bearish .786 Fib), and $1161 (1.272 Fib Extension – purple). Added resistance lies at $1200 and $1275 (bearish .886 Fib).
On the other side, the first level of support lies at $975. This is followed by $915, $855 (.5 Fib), $800, and $782 (.618 Fib).
The daily RSI remains the highest it has been since August 2020, suggesting the buyers may be a little overextended.
ETH/BTC – Bulls Surge 40% From 0.023 BTC Lows.
Key Support Levels: 0.026 BTC, 0.025 BTC, 0.0245 BTC.
Key Resistance Levels: 0.0282 BTC, 0.0285 BTC, 0.029 BTC.
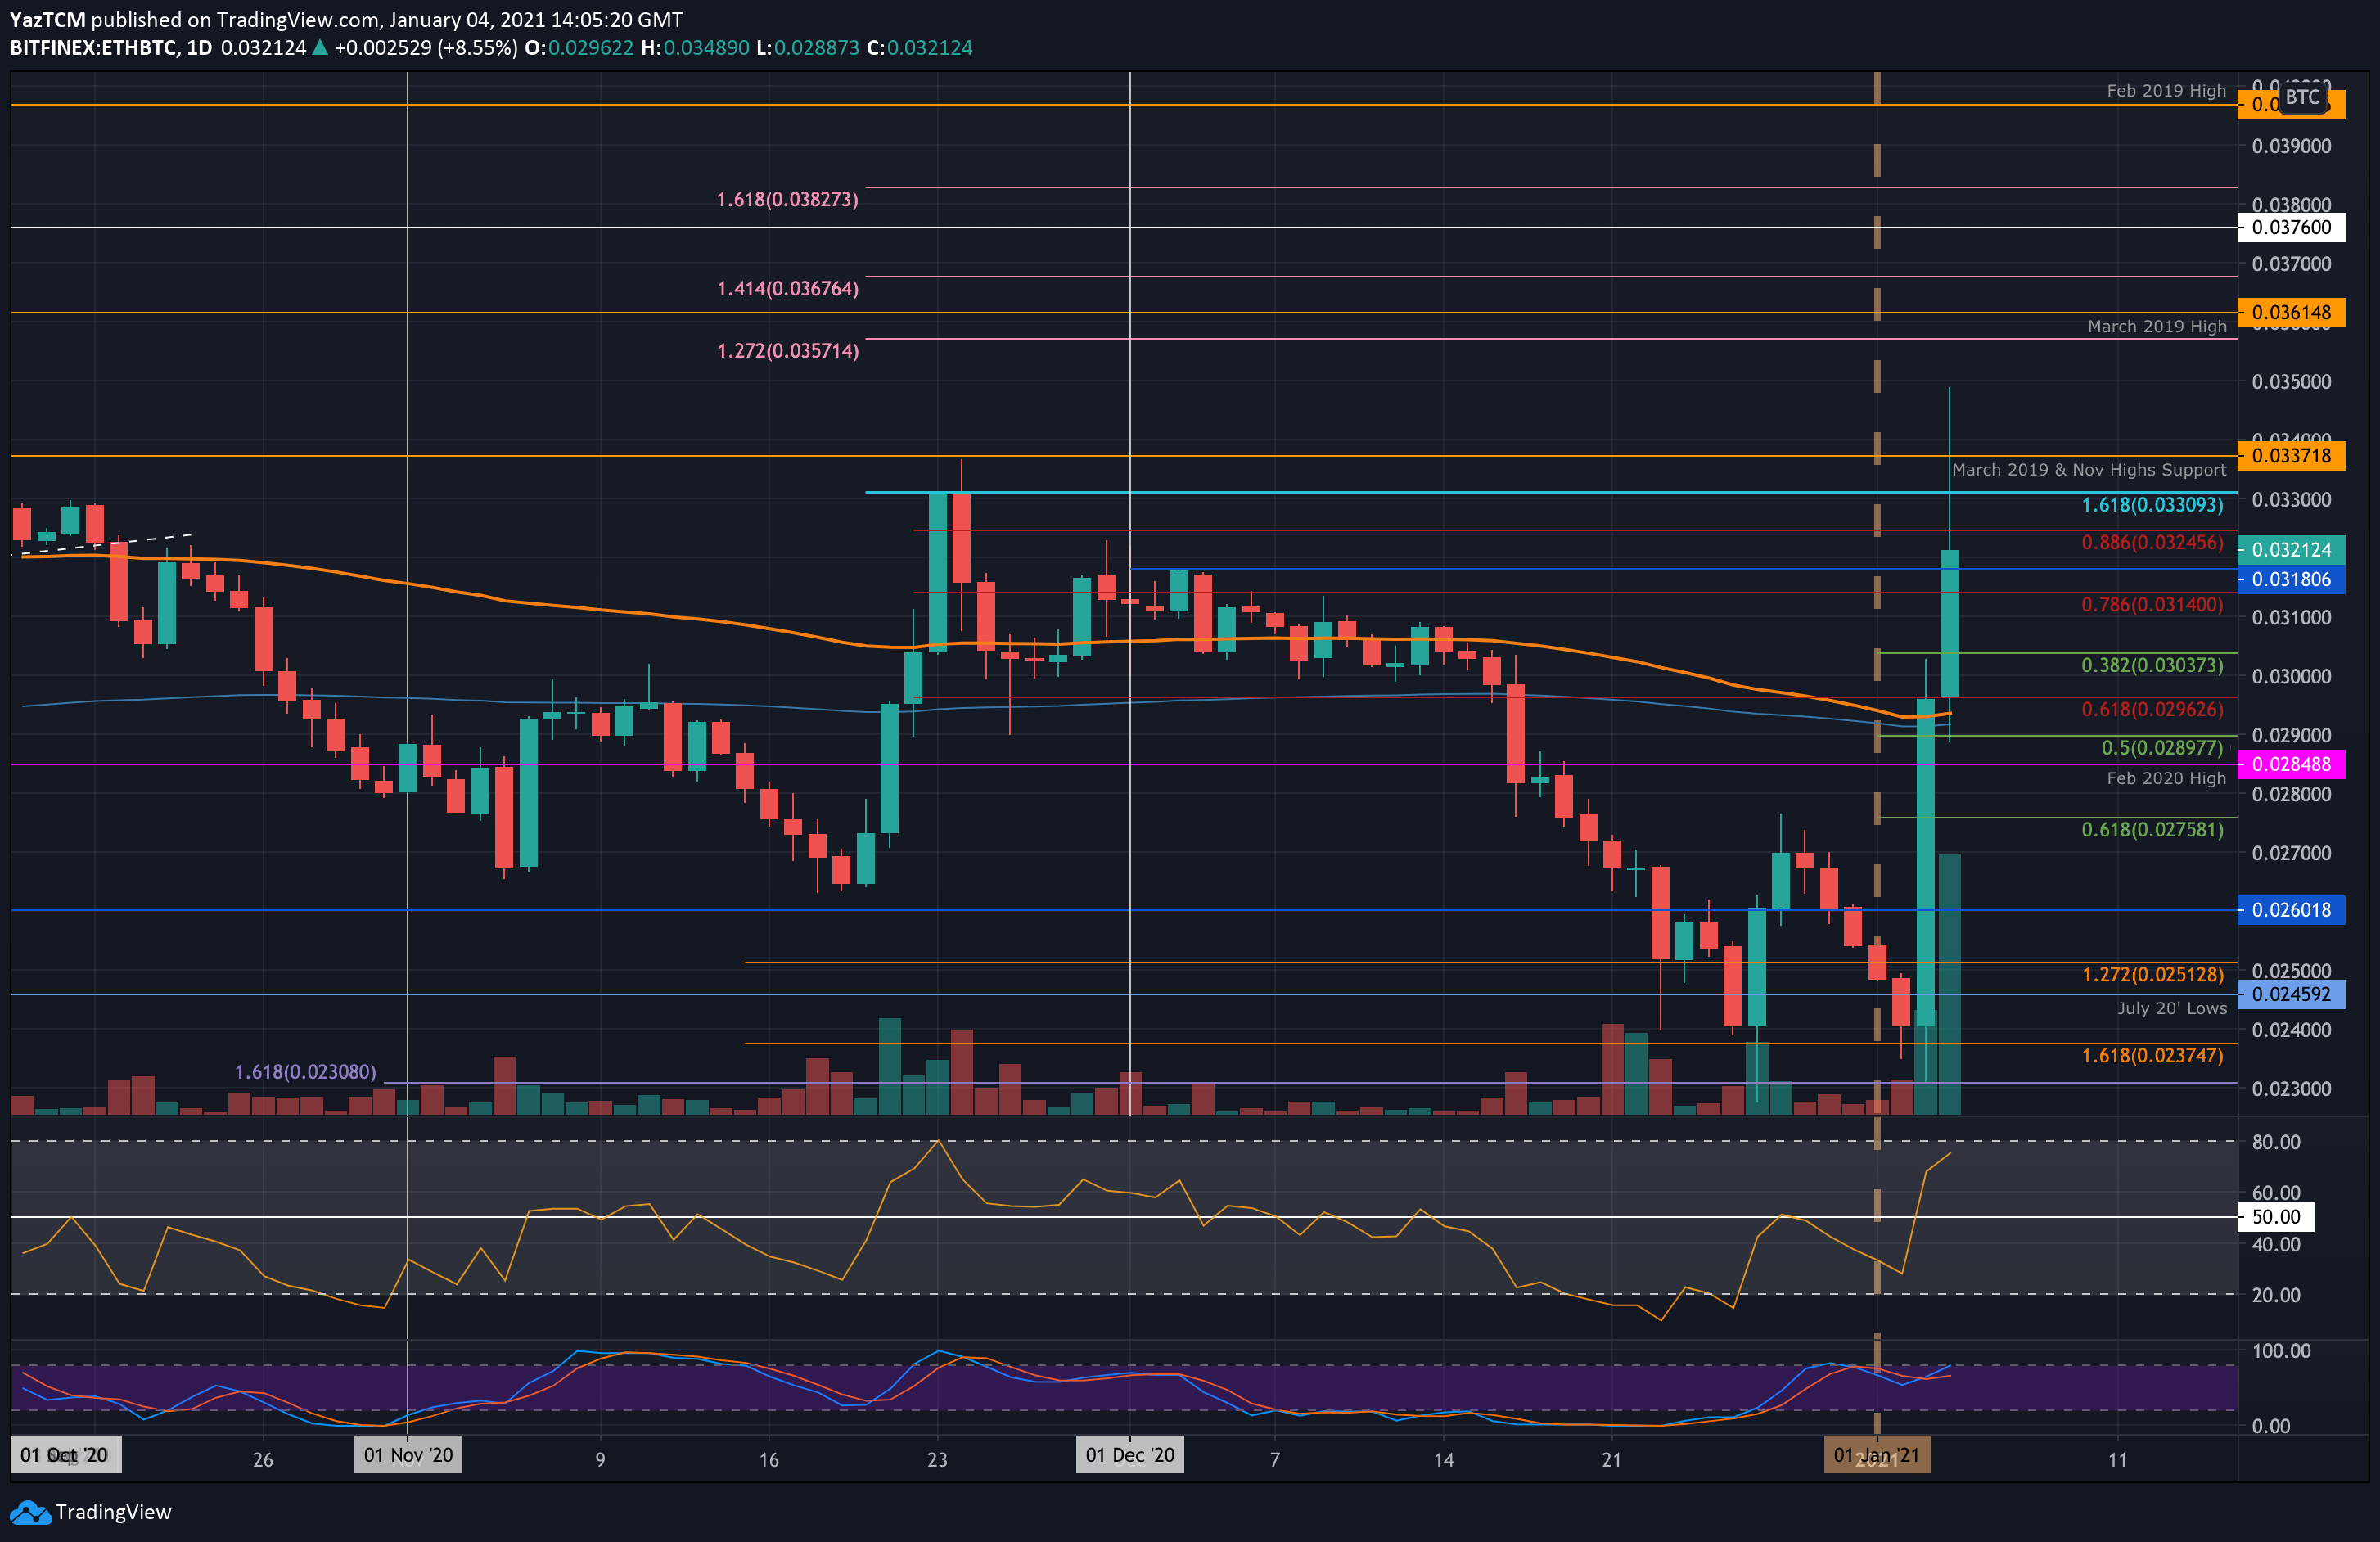
Against Bitcoin, Ethereum had rebounded from 0.023 BTC yesterday and started to surge aggressively. By the end of the day, it reached the 0.0296 BTC level (bearish .618 Fib Retracement).
Today, ETH continued upward to break above 0.03 BTC and eventually reached as high as 0.035 BTC. It has since dropped slightly and is trading at 0.0321 BTC.
ETH-BTC Short Term Price Prediction
Moving forward, the first level of resistance lies at 0.0324 BTC (bearish .886 Fib). This is followed by 0.033 BTC, 0.0337 NTC (Nov 2020 Highs), and 0.035 BTC. Added resistance is found at 0.0357 BTC (1.272 Fib Extension), 0.0361 BTC (March 2019 Highs), and 0.0367 BTC (1.414 Fib Extension).
Alternatively, the first level of support lies at 0.0314 BTC. This is followed by 0.0303 BTC (.382 Fib), 0.0296 BTC, and 0.029 BTC (.5 Fib).
The RSI broke beyond the mid-line yesterday as the bulls took charge of the market momentum. It is still not yet overbought, suggesting the buyers still have room to travel higher.