Ethereum Price Analysis: ETH Bounces Off The Legendary 0.024 BTC Support, Can It Hold?
Ethereum continues to struggle at the $300 level after dropping by 4.20% over the past week, bringing the price for the cryptocurrency down to around $293. ETH has now seen an increase of 17% over the past 30 days with a further 74% price surge over the past 3 months.
ETH remains the second largest cryptocurrency with a market cap of $31.27 billion. ETH also struggled against BTC, dropping aggressively during June. However, the coin has recently rebounded from strong support which is a promising sign.
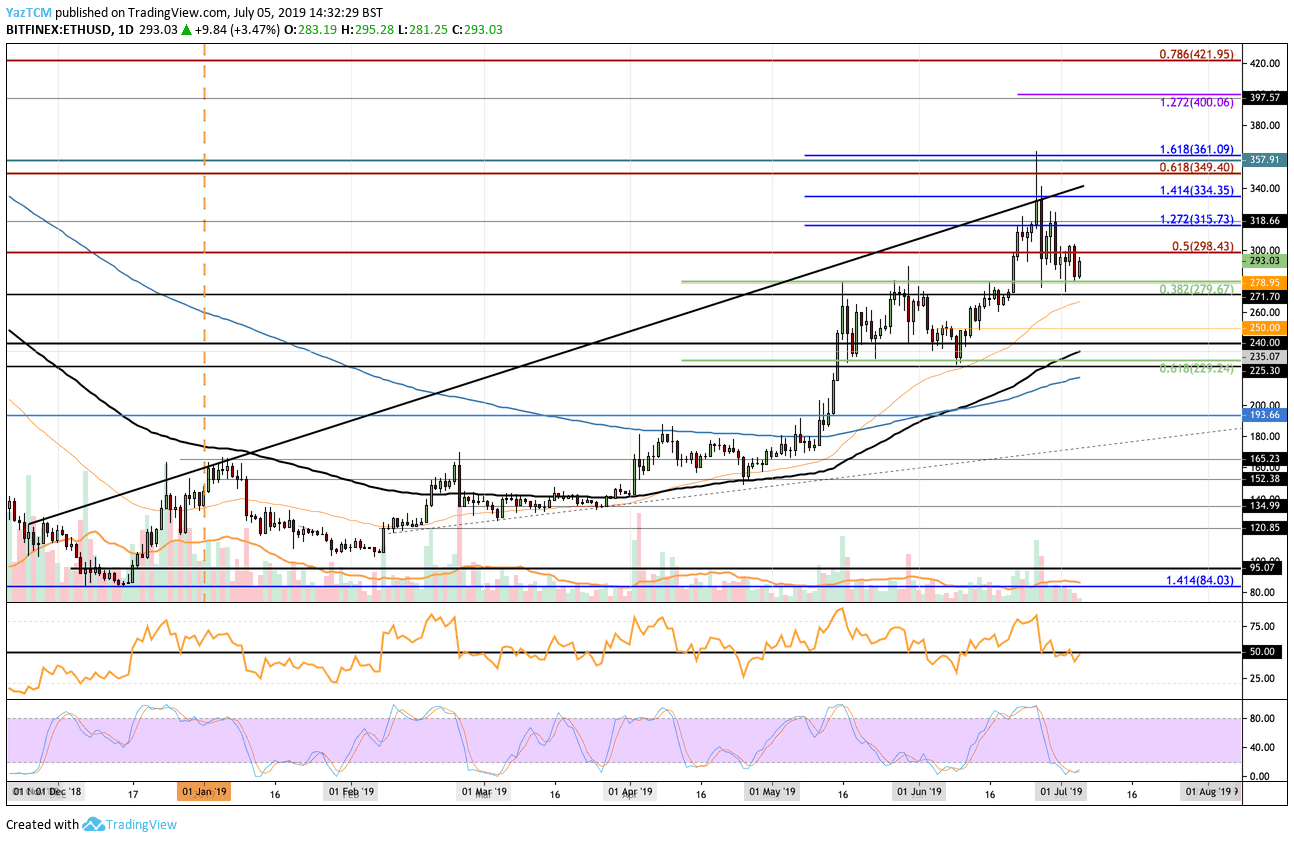
Looking at the ETH/USD 1-Day Chart:
- Since our previous ETH/USD analysis, the resistance at $334 was too strong for the bulls, resulting in the market rolling over and falling. Ethereum dropped toward support at $279, where lies the short term .382 Fibonacci Retracement level.
- From above: The nearest level of resistance lies between $298 and $300, which contains the bearish .5 Fib Retracement. Above $300, the next levels of resistance lie at $315, $334, and $350. If the buyers break above $350, higher resistance lies at $361, $380, and $400.
- From below: The nearest level of support lies at the $279 level. Beneath this, the next level of support lies at $271, $250, and $240. If the selling continues, further support lies at $235, $230, and $225.
- The Stochastic RSI has recently reached oversold territory as we wait for a bullish crossover above signal to show that the market is ready to climb higher. Furthermore, the RSI itself has also rebounded at the 50 level which shows indecision within the market.
- The trading volume has diminished as July started to trade.
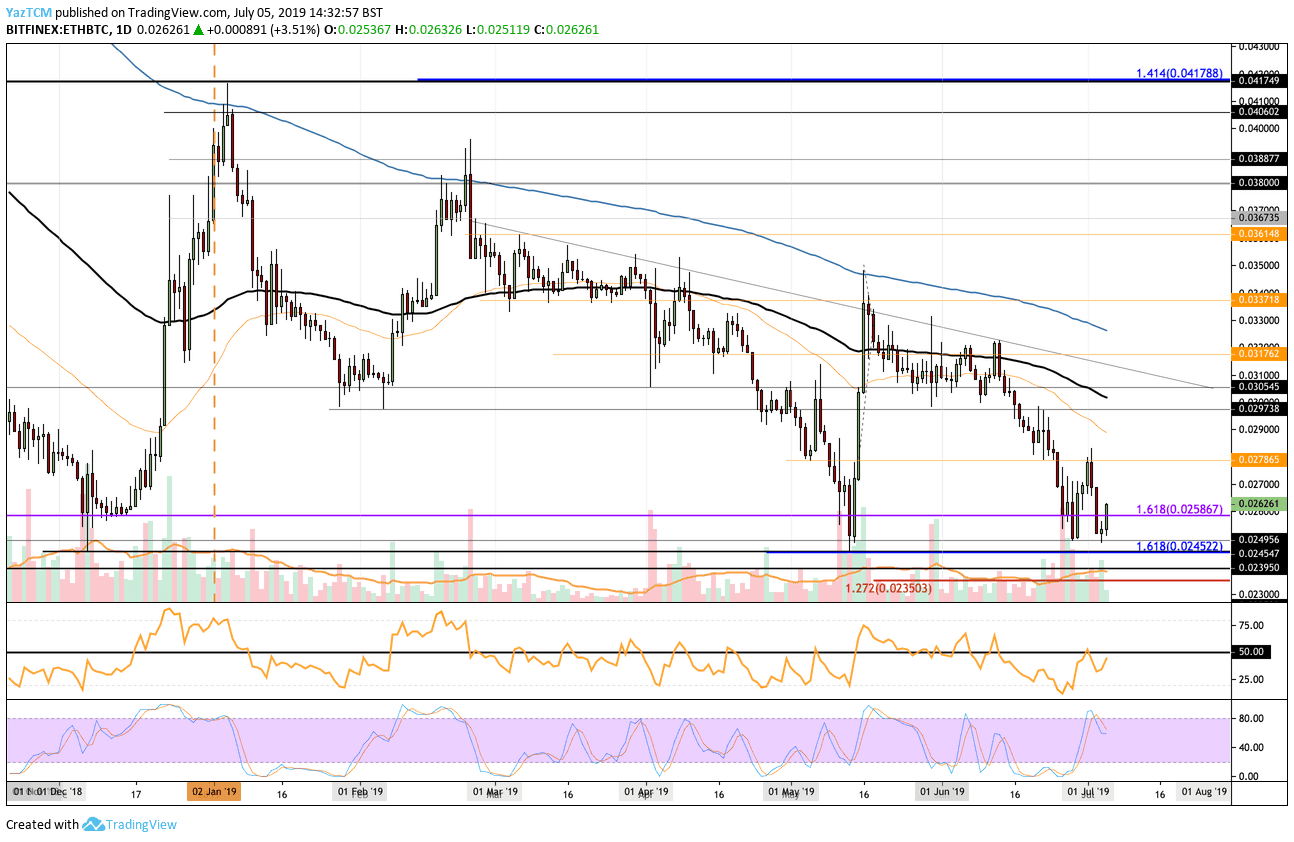
Looking at the ETH/BTC 1-Day Chart:
- Against Bitcoin, ETH continued to drop lower until finding strong support at the 0.025 BTC level. This area had provided strong support for the market during May 2019 and December 2018 and is expected to provide strong support moving forward. We can see that ETH has now rebounded from this level.
- From above: The nearest level of resistance lies at 0.027 BTC and 0.028 BTC. Above this, higher resistance lies at 0.029 BTC and 0.030 BTC. The resistance at 0.030 BTC is bolstered by the 100 days EMA.
- From below: The nearest level of support lies at 0.025 BTC. Beneath this, the next level of support lies at 0.0245 BTC, 0.024 BTC, and 0.023950 BTC.
- The trading volume has surged recently and has been above the average level.
- The RSI is showing promising signs as it makes its way toward the 50 level. If we would like to see a recovery, we would need to see the RSI break above the 50 level to indicate the bulls are in control of the market momentum.
The post Ethereum Price Analysis: ETH Bounces Off The Legendary 0.024 BTC Support, Can It Hold? appeared first on CryptoPotato.