Ethereum Price Analysis: ETH Bounces 10% But Is the Pain Over?
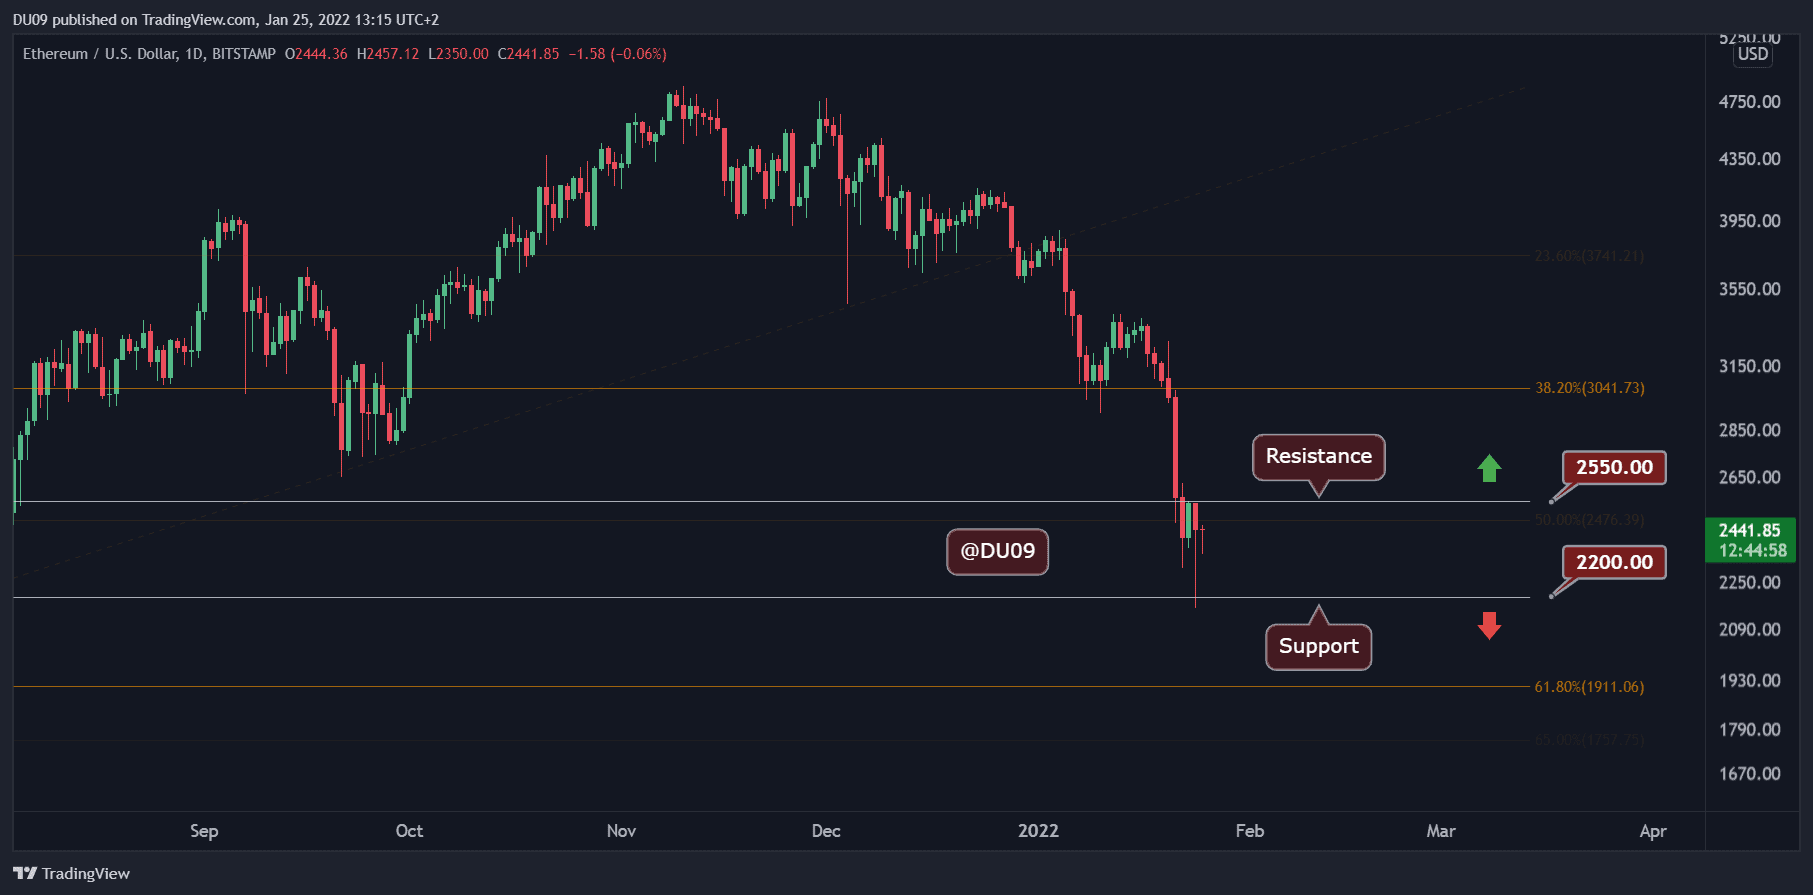
Key Support levels: $2,200, $1,900.
Key Resistance levels: $2,550, $3,000
ETH has rallied 10% after touching the $2,200 support level yesterday. Now, the cryptocurrency is moving towards the critical resistance at $2,550, where the price was previously rejected. If it manages to move above this level and turn it into support, then it has a good chance to go higher and recover some of the most recent losses.
Technical Indicators
Trading Volume: The volume has been high in the past few days and favored the sellers. However, as ETH has reached oversold conditions, the immediate trend may change and put ETH back on the uptrend.
RSI: The daily RSI is in the oversold area at 26 points. It is likely to leave this extreme position soon as ETH attempts a relief rally.
MACD: While the daily MACD is bearish, the histogram today has made a higher low. If this is maintained, then ETH may reverse course soon and attempt to break the key resistance.

Bias
The bias for ETH is currently bearish. While the indicators remain bearish, a reversal is becoming likely. A break of the key resistance would confirm that and change the bias.
Short-Term Price Prediction for ETH
The most probable scenario right now is for ETH to attempt a break of the key resistance at $2,550. If successful, then it can enter a sustained rally towards $3,000. If the price is rejected again by the resistance, then the key support at $2,200 should provide a good defense.