Ethereum Price Analysis: Bears Poke Their Face as ETH Slides Towards $2K
ETH/USD – Bulls Set New ATH Prices At $2151.
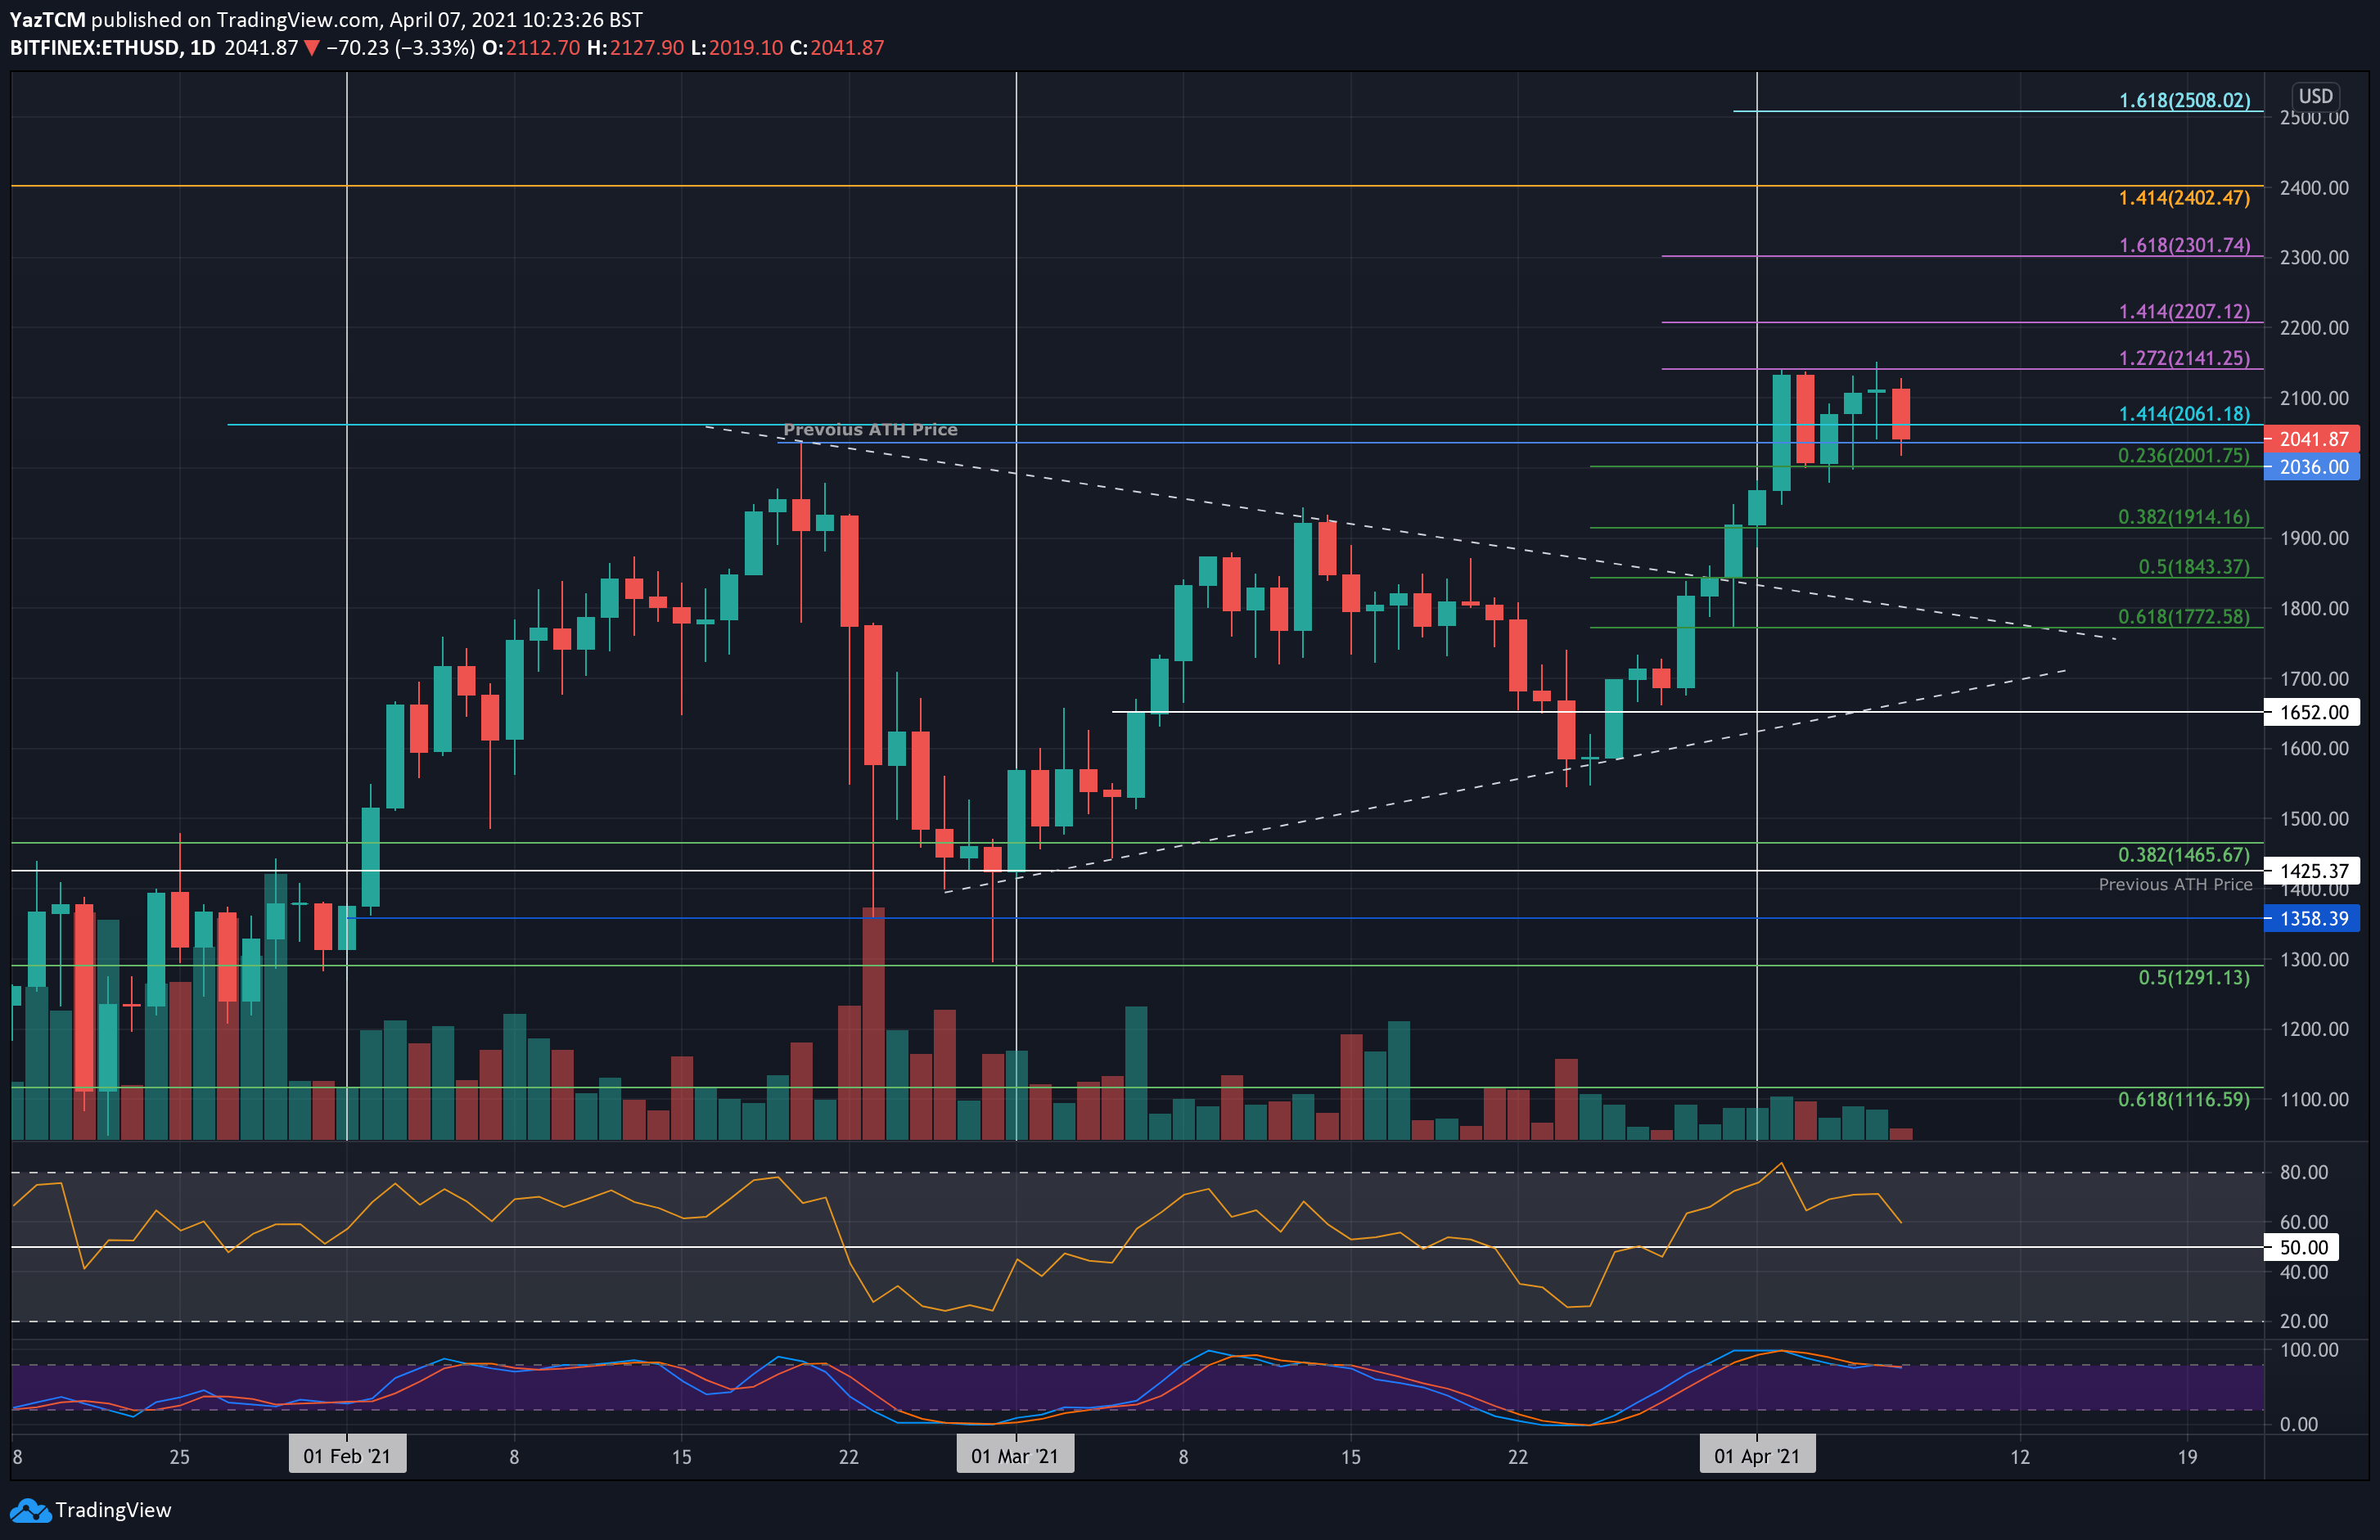
Key Support Levels: $2036, $2000, $1914.
Key Resistance Levels: $2100, $2141, $2207.
Ethereum is up by a total of 11% over the past week, which allowed it to set a new ATH yesterday at $2151. Despite setting a new ATH price, the cryptocurrency could still not close a daily candle above the early April resistance at $2141 (1.272 FIb Extension).
As a result, Etheruem rolled over today as it dropped back beneath $2100 to reach the current $2041 level. This support is provided by the high that was set during February 2021.
ETH-USD Short Term Price Prediction
Moving forward, if the bears break beneath $2036, the first level of support lies at $2000 (.236 Fib). Beneath it, support lies at $1914 (.382 Fib), $1843 (.5 Fib), and $1772 (.618 Fib).
On the other side, the first resistance lies at $2100. This is followed by $2141 (1.272 Fib Extension), $2207 (1.414 Fib Extension), and $2300 (1.618 Fib Extension).
The daily RSI is starting to head lower and is showing hints of bearish divergence as it creates lower highs while price action moves sideways. If it continues to drop, Ethereum can be expected to break back beneath $2,000.
ETH/BTC – Bulls Breifly Break March 2019 Highs
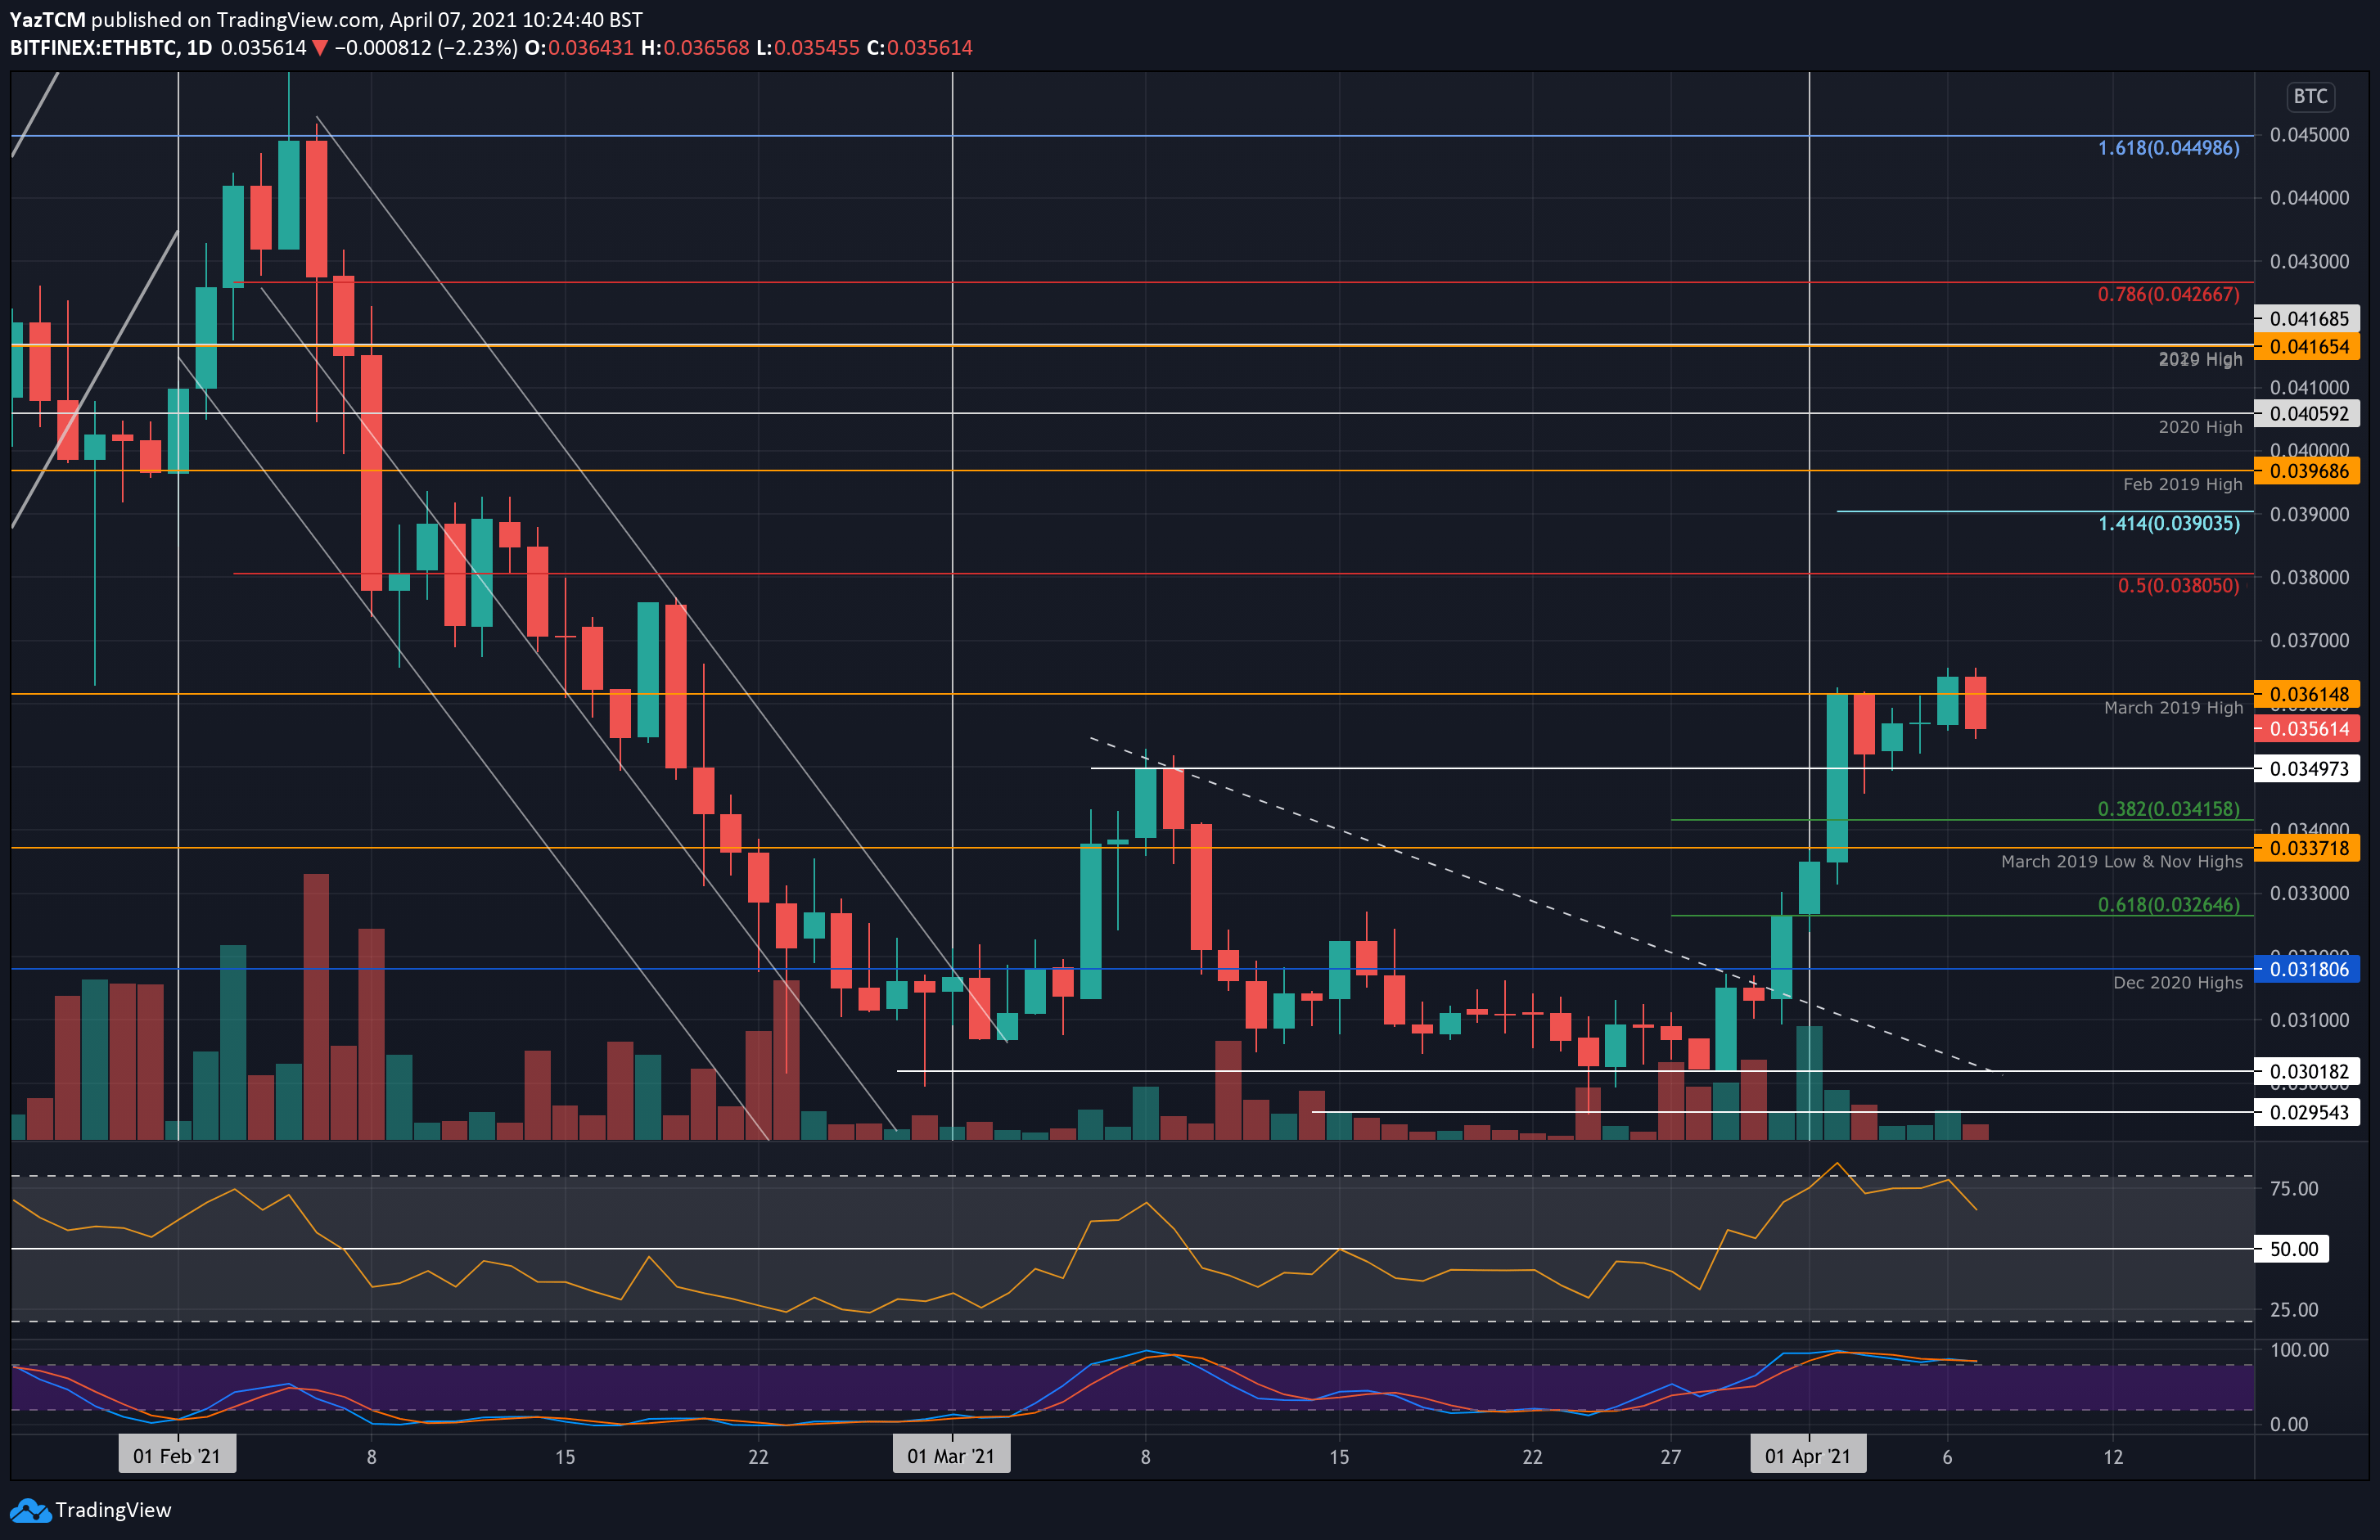
Key Support Levels: 0.035 BTC, 0.0341 BTC, 0.0337 BTC.
Key Resistance Levels: 0.0361 BTC, 00365 BTC, 0.0337 BTC.
Ethereum also managed to set a fresh monthly high yesterday after breaking above the March 2019 high resistance at 0.0361 BTC to reach as high as 0.0365 BTC. Prior to this, Ethereum was trading within a range between 0.0361 BTC and 0.035 BTC.
Unfortunately, Ethereum was unable to sustain itself above 0.0361 BTC and has since dropped back into the April range as it sits at 0.0356 BTC.
ETH-BTC Short Term Price Prediction
Looking ahead, the first level of support lies at 0.035 BTC. This is followed by 0.0341 BTC (.382 Fib), 0.0337 BTC (Nov 2020 highs), and 0.033 BTC.
On the other side, the first resistance lies at 0.0361 BTC (March 2019 highs). This is followed by 0.0365 BTC, 0.037 BTC, 0.038 BTC (bearish .5 Fib), and 0.039 BTC (1.414 Fib Extension).
Likewise, the RSI is showing hints of bearish divergence as price action makes a higher high while the RSI makes a lower high. This suggests a short-term retracement beneath 0.035 BTC might be on the table.