Ethereum Price Analysis April 15: Strong Move Expected, But In Which Direction?
Ethereum may have seen a small 6.5% price decline over the past seven days. However, the market is still up by a total of 31% over the previous 90 days. The cryptocurrency had broken above a long-term symmetrical triangle at the begging of this month and has managed to remain above the triangle since then.
Ethereum is presently trading at a price of around $168 as the project remains ranked as the second largest crypto by market-cap with a $17.71 billion market cap value.
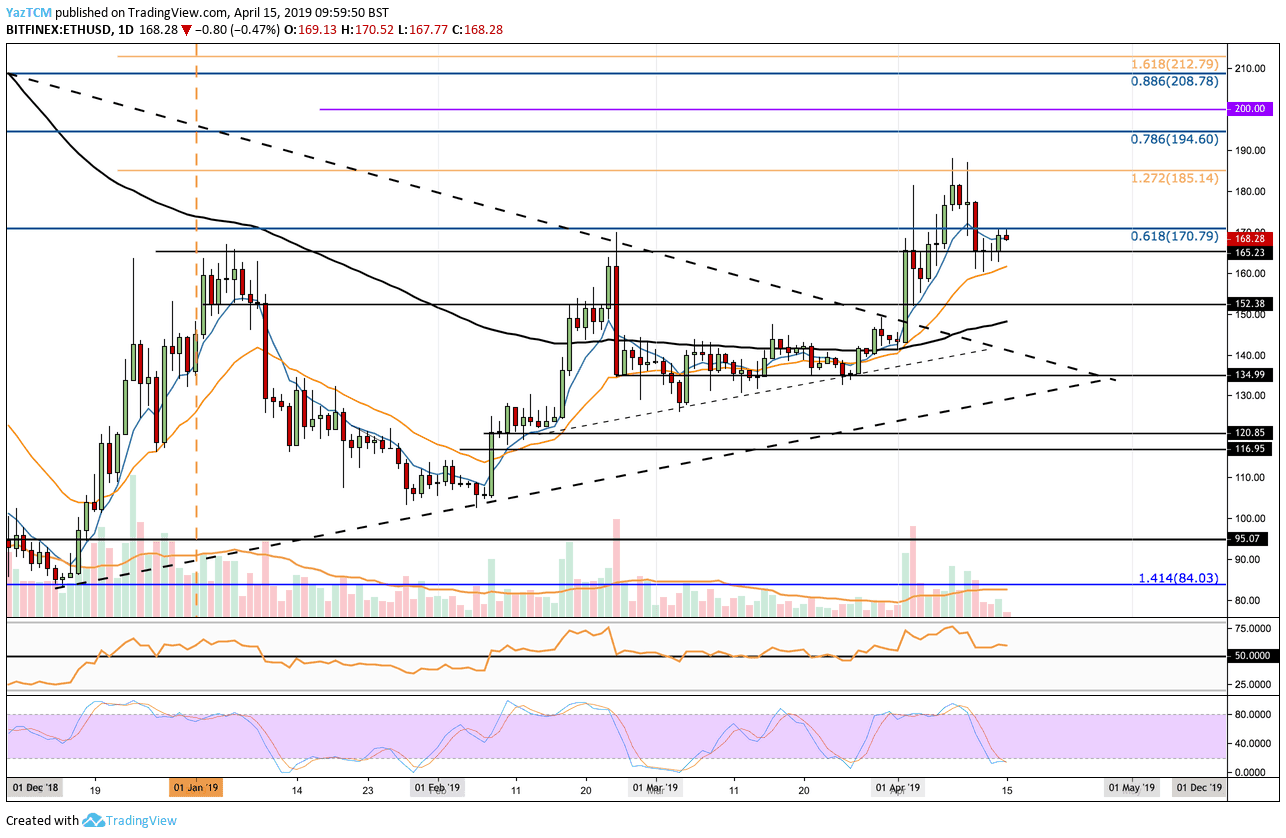
Looking at the ETH/USD 1-Day Chart:
- Since our previous ETH/USD analysis, we can see that the coin had attempted to break above the highlighted resistance at $185, where lies a 1.272 Fibonacci Extension level, but had failed to gain bullish momentum. Ethereum has recently fallen slightly into support at the $165 level.
- From above: The nearest level of resistance is located at $170, where lies a bearish .618 Fibonacci Retracement level. Above this, further resistance lies at $185 followed by more resistance at $194, where lies the bearish .786 Fibonacci Retracement level. If the buyers can continue above $200, higher resistance then lies at $208 and $212.
- From below: The nearest level of support now lies at $165. Beneath, support lies at $160, $152, the 100-day moving average (around $148) and $135.
- The Stochastic RSI is positioning itself for a crossover above, at the oversold area, which could indicate on a correction coming up.
- Over the past four days, the trading volume has significantly decreased which could be a sign that a significant move is approaching.
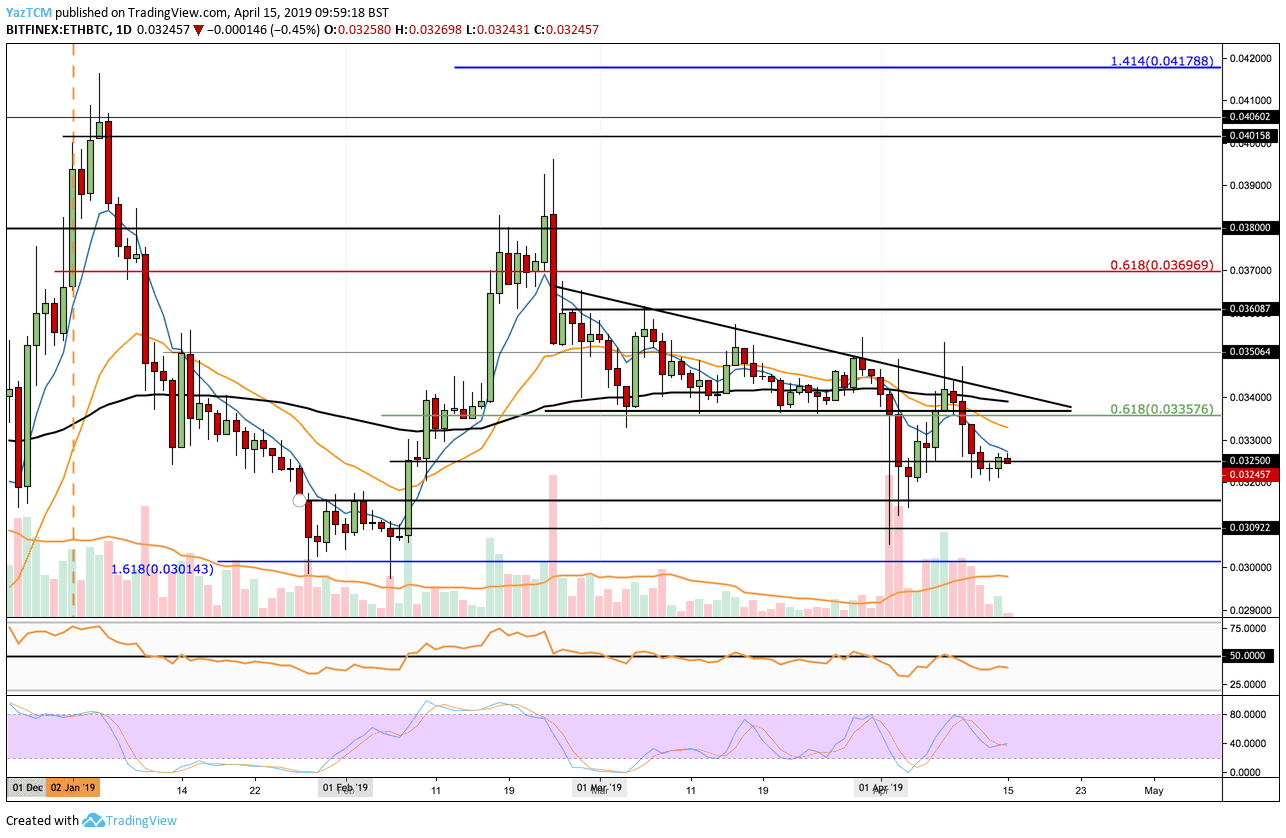
Looking at the ETH/BTC 1-Day Chart:
- Against BTC, we can see that ETH had failed to remain within, or break above, the descending triangle. ETH/BTC has once again plummeted below the triangle, which has now been invalidated, as the coin finds support at 0.0325 BTC.
- From above: The nearest level of resistance now lies at 0.0340 BTC, along with the 100-day moving average line. Above this, further resistance can be found at 0.035 BTC, 0.036 BTC, and 0.037 BTC.
- From below: If the sellers break beneath the support at 0.0325 BTC, further support lies at 0.0315 BTC and 0.030 BTC.
- The RSI is presently below the 50 level which indicates that the bears are in control of the market momentum.
- The trading volume remains above average but has been decreasing over the past week or so.
The post Ethereum Price Analysis April 15: Strong Move Expected, But In Which Direction? appeared first on CryptoPotato.