Ethereum Price Analysis April.1: ETH Consolidation Continues Within Triangle Formations. Breakout Soon?
Ethereum has continued to trade within the consolidation pattern over the past few days as the cryptocurrency trades around $144. The market has now seen a 4% price rise over the past seven days, facing the previous resistance at $145. However, the market has remained within a long-term symmetrical triangle and has dropped back beneath the $145 level.
Ethereum remains ranked in second position as it currently holds a market cap value getting close to $15 billion.
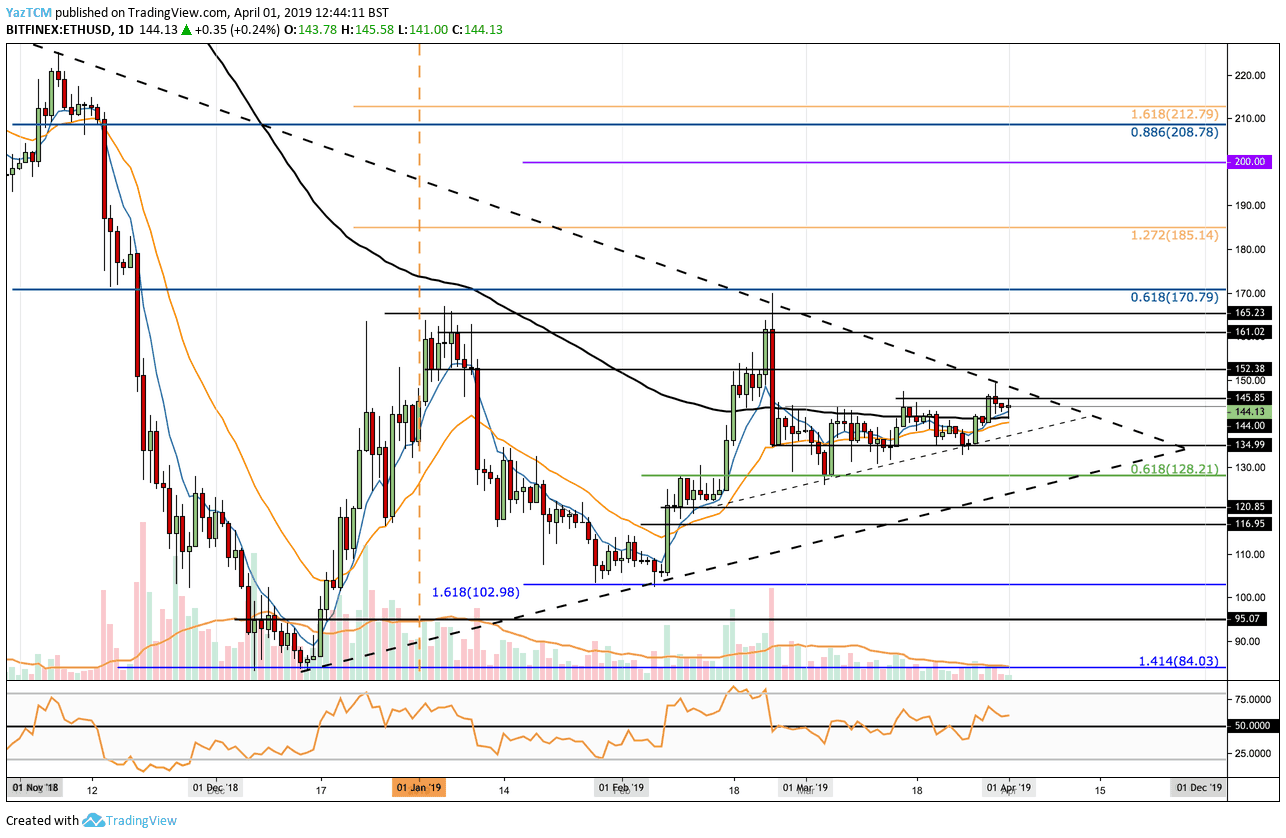
Looking at the ETH/USD 1-Day Chart:
- Since our previous ETH/USD analysis, we can see that Ethereum has now managed to climb above the 100-day moving average line. However, the coin had met resistance at the upper boundary of a long-term symmetrical triangle pattern and was turned away. Price action is now trading at support at the $144 level.
- From above: The next level of resistance now lies at the upper boundary of the long-term formed triangle. Above this, resistance lies at $152, $161 and $170. The resistance at $170 is strengthened by a long term bearish .618 Fibonacci Retracement level. Above $170 we can expect resistance at $185 and $200.
- From below: The nearest level of support lies at the lower boundary of the smaller triangle. Beneath this, support lies at $135, $128 and then the lower boundary of the long term symmetrical triangle. If the sellers push the market below the symmetrical triangle, further support lies around $120 and $116.95.
- The RSI has broken above the 50 level which indicates that the bulls are in control of the market momentum.
- The trading volume has fallen slightly toward the end of March 2019.
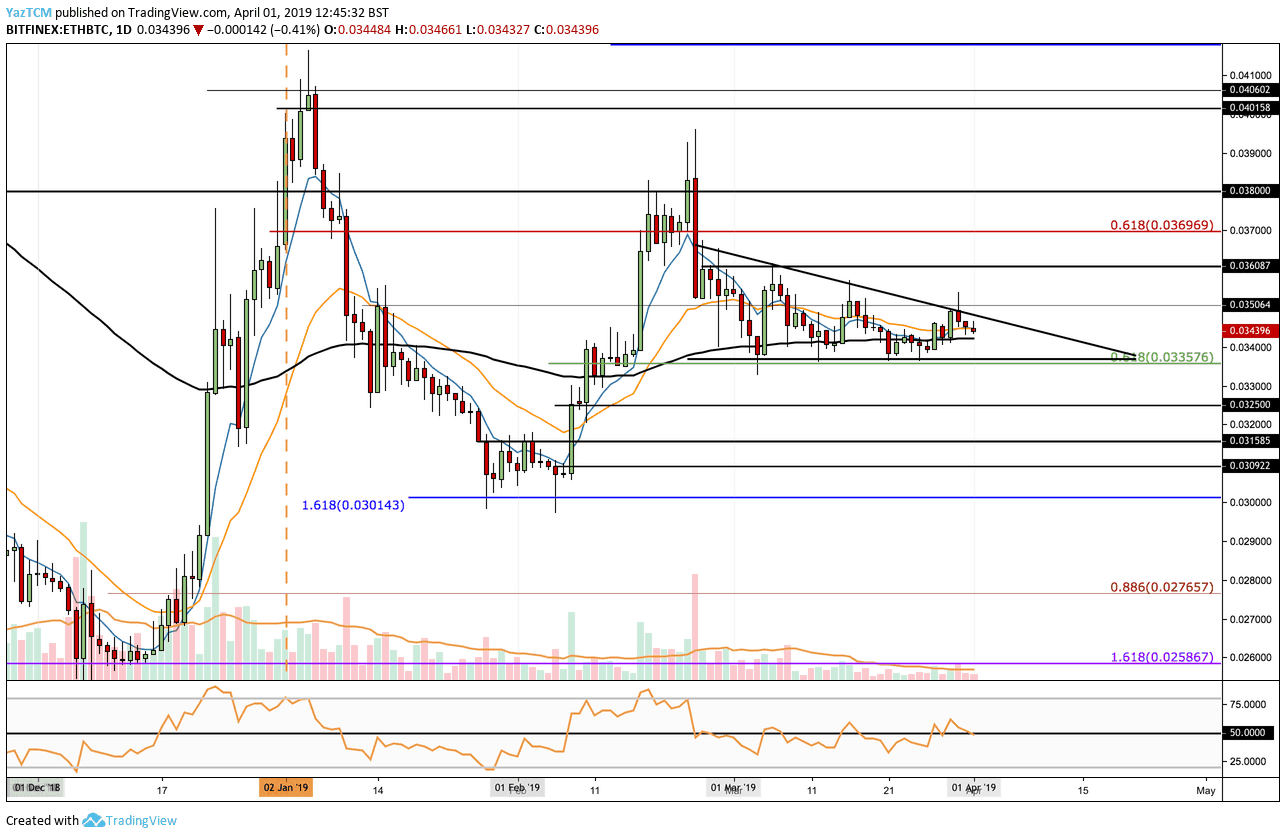
Looking at the ETH/BTC 1-Day Chart:
- Following our previous analysis we can see that the coin has continued to trade within the confines of the short term descending triangle pattern. Price action had attempted to break higher but failed to maintain above the triangle.
- From above: The nearest level of resistance lies at the upper boundary of the triangle. The next resistance lies at 0.036 BTC, 0.037 BTC, and 0.038 BTC, before reaching the significant resistance area between 0.04 BTC and 0.0406 BTC.
- From below: The closest support lies at the 100-day moving average and then lies the lower boundary of the descending triangle at 0.033 BTC. If the sellers drop ETH/BTC beneath the triangle, support is located at 0.0325 BTC, 0.0315 BTC, and 0.030 BTC.
- The RSI attempted to break above the 50 levels but has since returned to trade along the 50 levels. This indicates indecision within the market as neither faction controls the market momentum.
- The trading volume has dropped significantly toward the end of March 2019.
The post Ethereum Price Analysis April.1: ETH Consolidation Continues Within Triangle Formations. Breakout Soon? appeared first on CryptoPotato.