Ethereum Looking Shaky at Important Support, Is $320 In Play? (ETH Price Analysis)
ETH/USD – Trading In Short Term Consolidation Pattern.
Key Support Levels: $342, $336, $320.
Key Resistance Levels: $350, $364, $370
At the start of October, Ethereum fell below $370 to find support at $336 provided by the lower boundary of a symmetrical triangle. It rebounded from there this weekend but failed to push higher than $355.
Today, Ethereum fell beneath the $350 level to drop back into the lower boundary of the symmetrical triangle pattern formed over the past fortnight of trading. A break beneath this pattern could see Ethereum heading back toward $320 over this week.
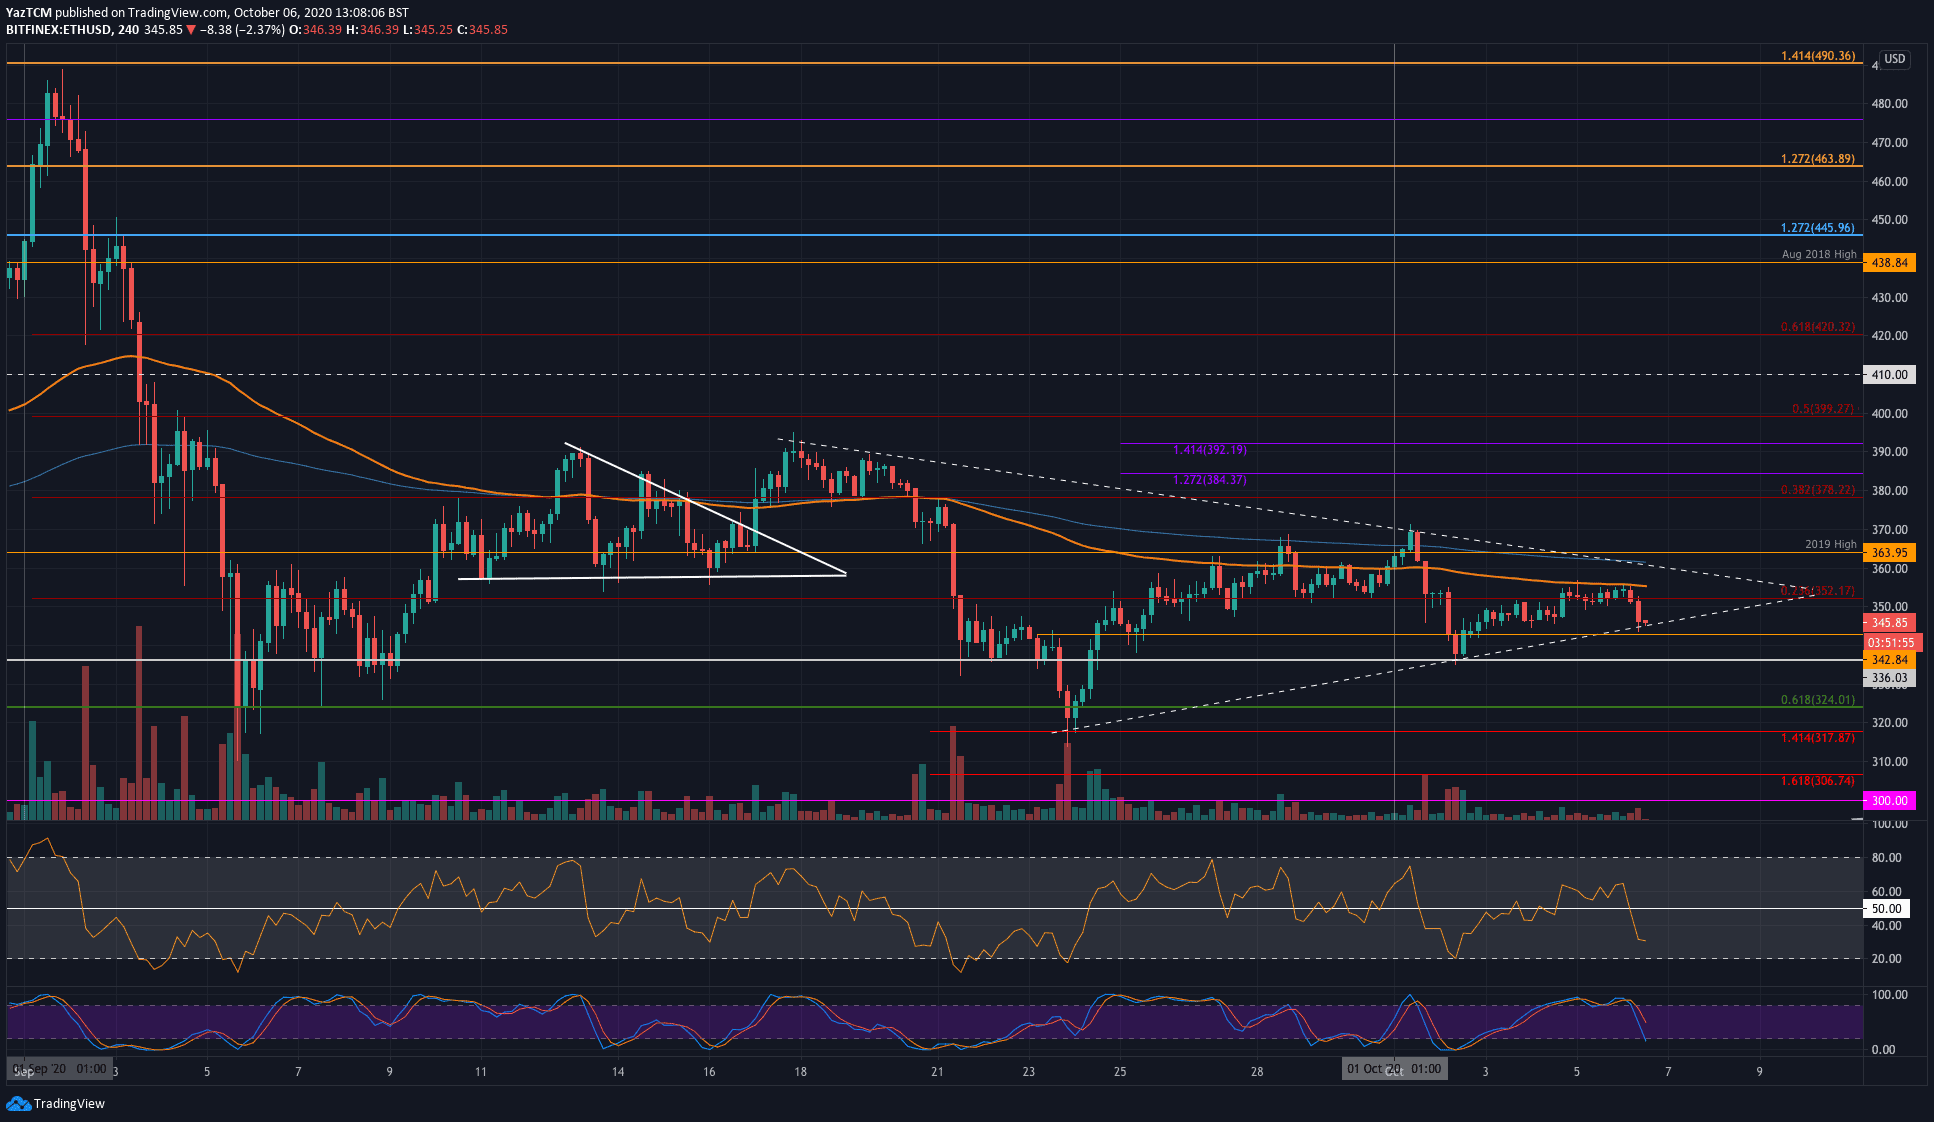
ETH-USD Short Term Price Prediction
If ETH falls beneath the symmetrical triangle, the first level of support lies at $342. This is followed by support at $336 (100-days EMA), $324 (.618 Fib Retracement), and $320.
On the other side, the first level of resistance lies at $350. This is followed by resistance at the upper boundary of the triangle and then at $364 (2019 Highs). If the buyers continue to drive above $370, resistance lies at $378, $385, and $392.
The 4HR RSI has dipped heavily today and has reached oversold conditions as the bears take full control of the market momentum.
ETH/BTC – Bears Drop Lower From Falling Trend Line
Key Support Levels: 0.032 BTC, 0.0315 BTC, 0.0311 BTC.
Key Resistance Levels:0.033 BTC, 0.0337 BTC, 0.034 BTC.
Against Bitcoin, Ethereum traded beneath a falling trend line throughout the entire period of September. It rebounded toward the end of last month at the 0.0311 BTC (.618 Fib) level to return to the falling trend line at the start of October.
Today, the buyers failed to break this falling trend line once again, which caused the market to roll over as it drops to the current 0.0323 BTC level.
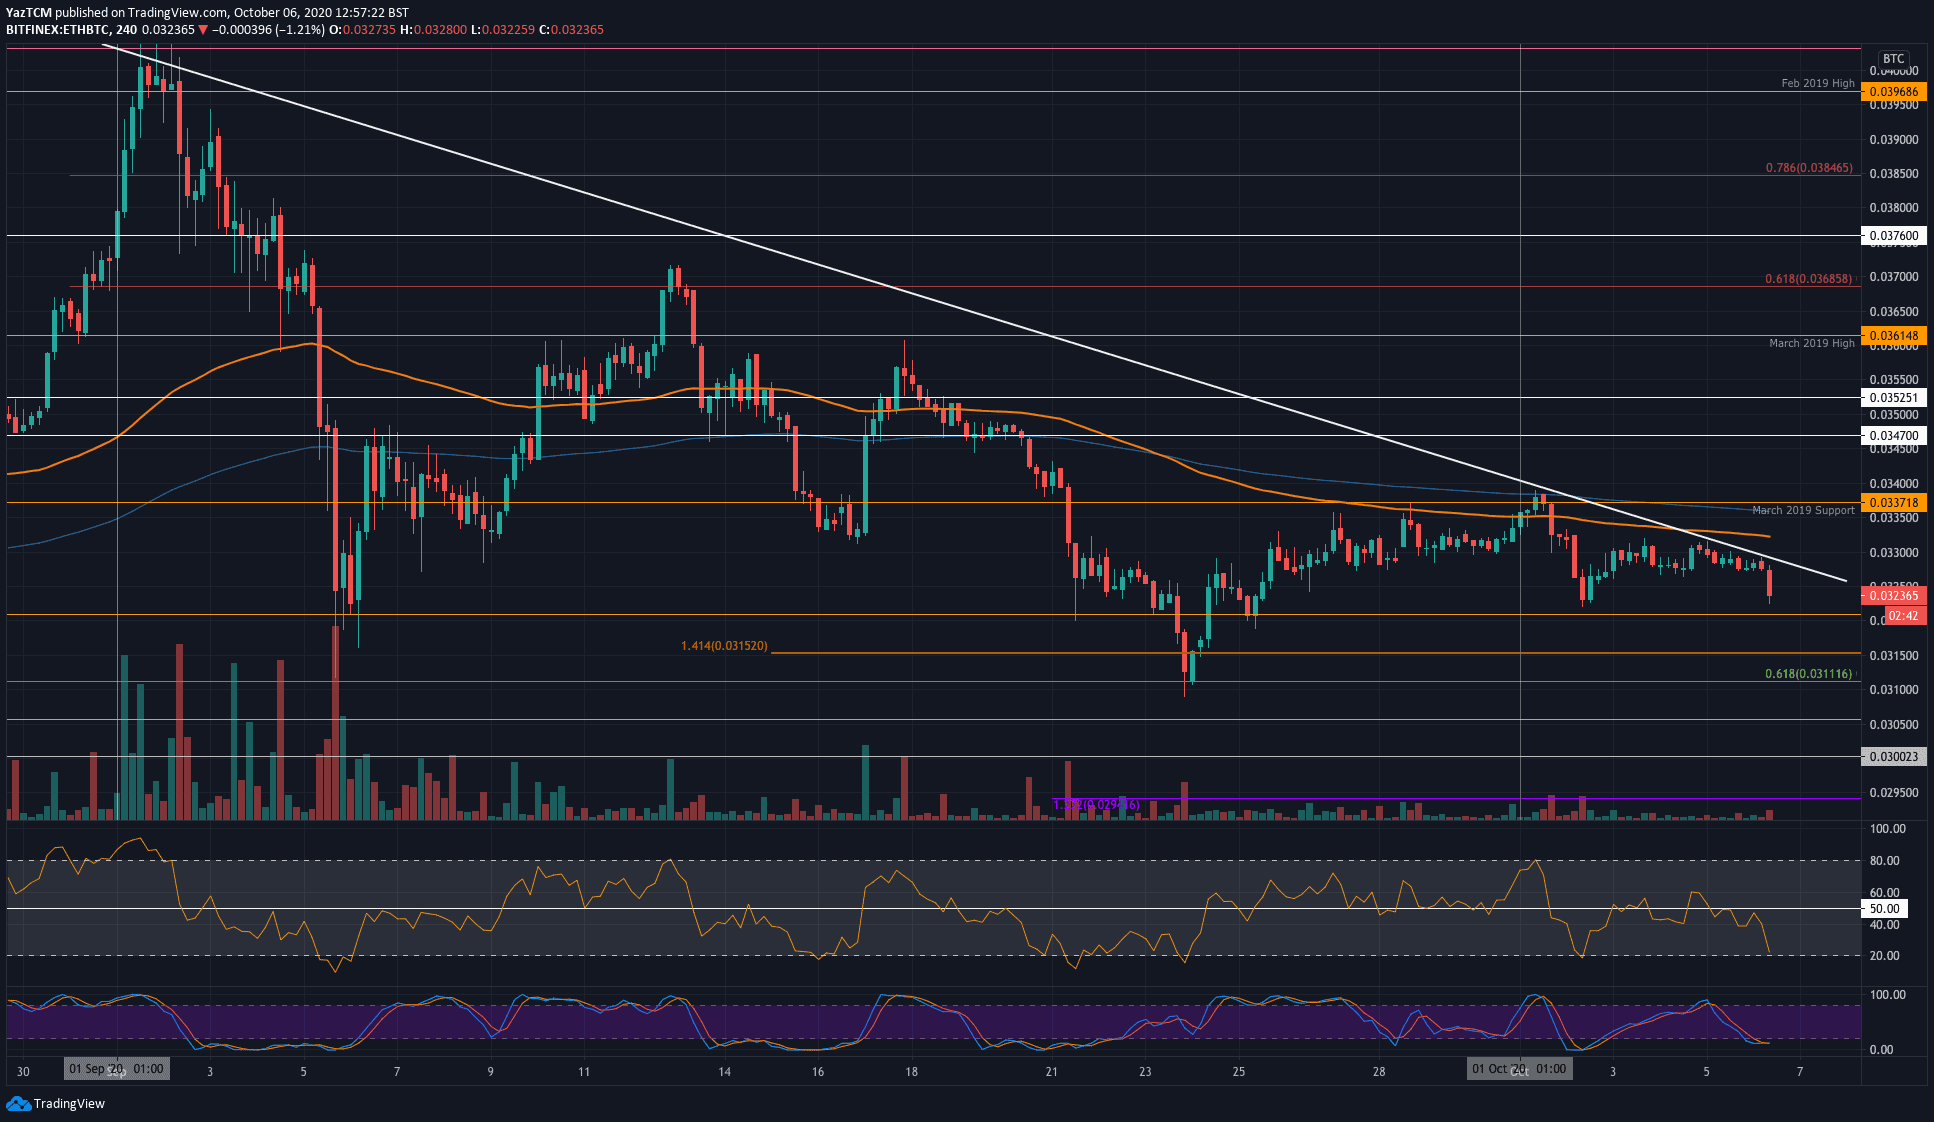
ETH-BTC Short Term Price Prediction
Moving forward, if the sellers continue to push ETH/BTC lower, the first level of support lies at 0.032 BTC. Beneath this, support lies at 0.0315 BTC, 0.0311 BTC (.618 Fib Retracement), and 0.0305 BTC.
On the other side, the first level of resistance lies at the falling trend line. Above this, resistance lies at 0.033 BTC, 0.0337 BTC (March 2019 support), and 0.034 BTC (October 2020 highs).
Likewise, the 4HR RSI has dropped near oversold conditions. Simultaneously, the Stochastic RSI is extremely oversold and is primed for a bullish crossover signal that could put an end to the downward pressure.
The post Ethereum Looking Shaky at Important Support, Is $320 In Play? (ETH Price Analysis) appeared first on CryptoPotato.