Ethereum Flips Bitcoin For Average Weekly Transfer Value
This year has certainly been a test of the Ethereum network, pushing it to its limits under unprecedented loads. Users have been disgruntled with sky-high gas fees, but other on-chain metrics have been good for the overall Ethereum ecosystem.
Economic Activity Surges
A recent report by analytics firm CoinMetrics has revealed that Ethereum has flipped Bitcoin in terms of seven-day average weekly transfer, which has now reached $3.08 billion compared to $3.01 for BTC.
ETH’s 7-day average adjusted transfer value has flipped BTC’s.
On September 5th, ETH’s 7-day average adjusted transfer value reached $3.08B, compared to $3.01B for BTC.
Read more in this week’s SOTN:https://t.co/6JXE5YEN8p pic.twitter.com/N3wcNUeunH
— CoinMetrics.io (@coinmetrics) September 9, 2020
It added that this is the first time since early 2018 that Ethereum’s seven-day average adjusted transfer value has topped Bitcoin’s. Back then, economic activity was driven by the ICO market and a plethora of new blockchain projects and tokens being launched almost daily. Because Bitcoin was comparatively slow and expensive (at the time), projects used Ethereum as a means of raising funds.
Fast forward two and a half years, and the momentum for the Ethereum economy today is DeFi. A surge in yield farming and protocol clones has resulted in a lot more financial value being transferred on the Ethereum network, which is the foundation for all things DeFi.
As much as 7 million ETH was locked into DeFi smart contracts last week, its highest ever level, according to DeFi Pulse. As markets cooled, collateral was withdrawn, and that figure has fallen to around 5 million ETH today. Compared to this time last year, that is an increase of 138%.
Token swapping and liquidity mining has driven a lot of this activity, and products such as Yearn Finance’s yETH vaults have also attracted a lot of ETH liquidity. At the time of writing, there was $81.5 million of liquidity in the yETH vault, according to Yearn stats.
Ethereum Price Rebounds
As DeFi markets rebound from their dip earlier this week, Ethereum prices are following. ETH has broken out of its four-day trading range and reached a five day high just above $365.
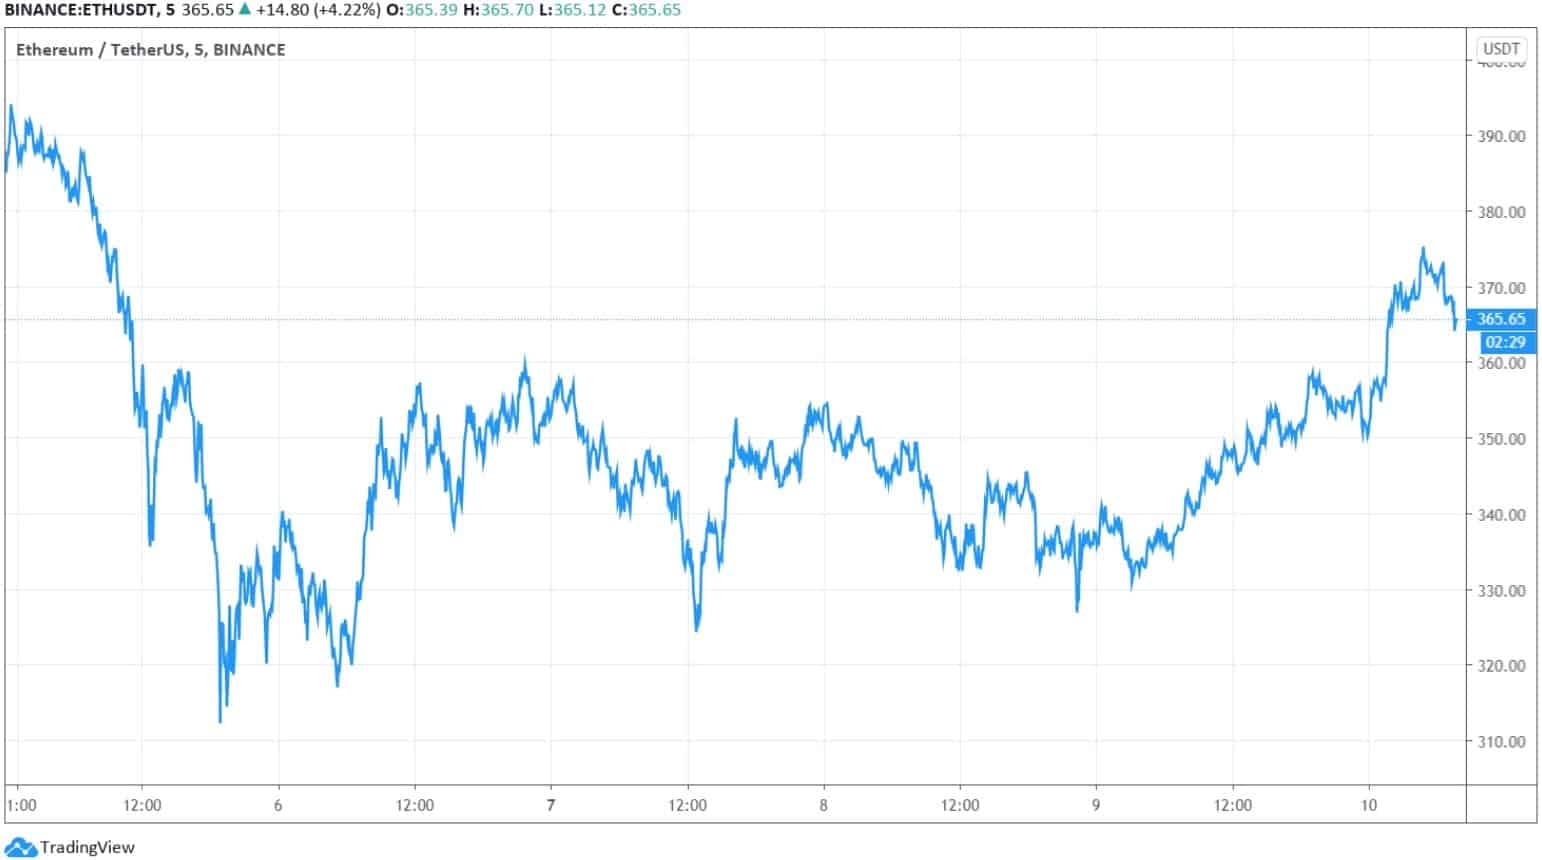
The move has taken it back across the 50 days moving average with the next level of resistance lying at the $385 level. Crypto markets are back in the green again today, and Ethereum is currently leading them with an eight percent gain on the day.
The post Ethereum Flips Bitcoin For Average Weekly Transfer Value appeared first on CryptoPotato.