ETH Uncertain Above $2.2K but is a Drop Toward $2,000 in Play? (Ethereum Price Analysis)
Ethereum’s price is currently finding it difficult to rally higher following weeks of aggressively bullish price action. Yet, there are still several support levels nearby that could keep the cryptocurrency from dropping lower.
Technical Analysis
By TradingRage
The Daily Chart
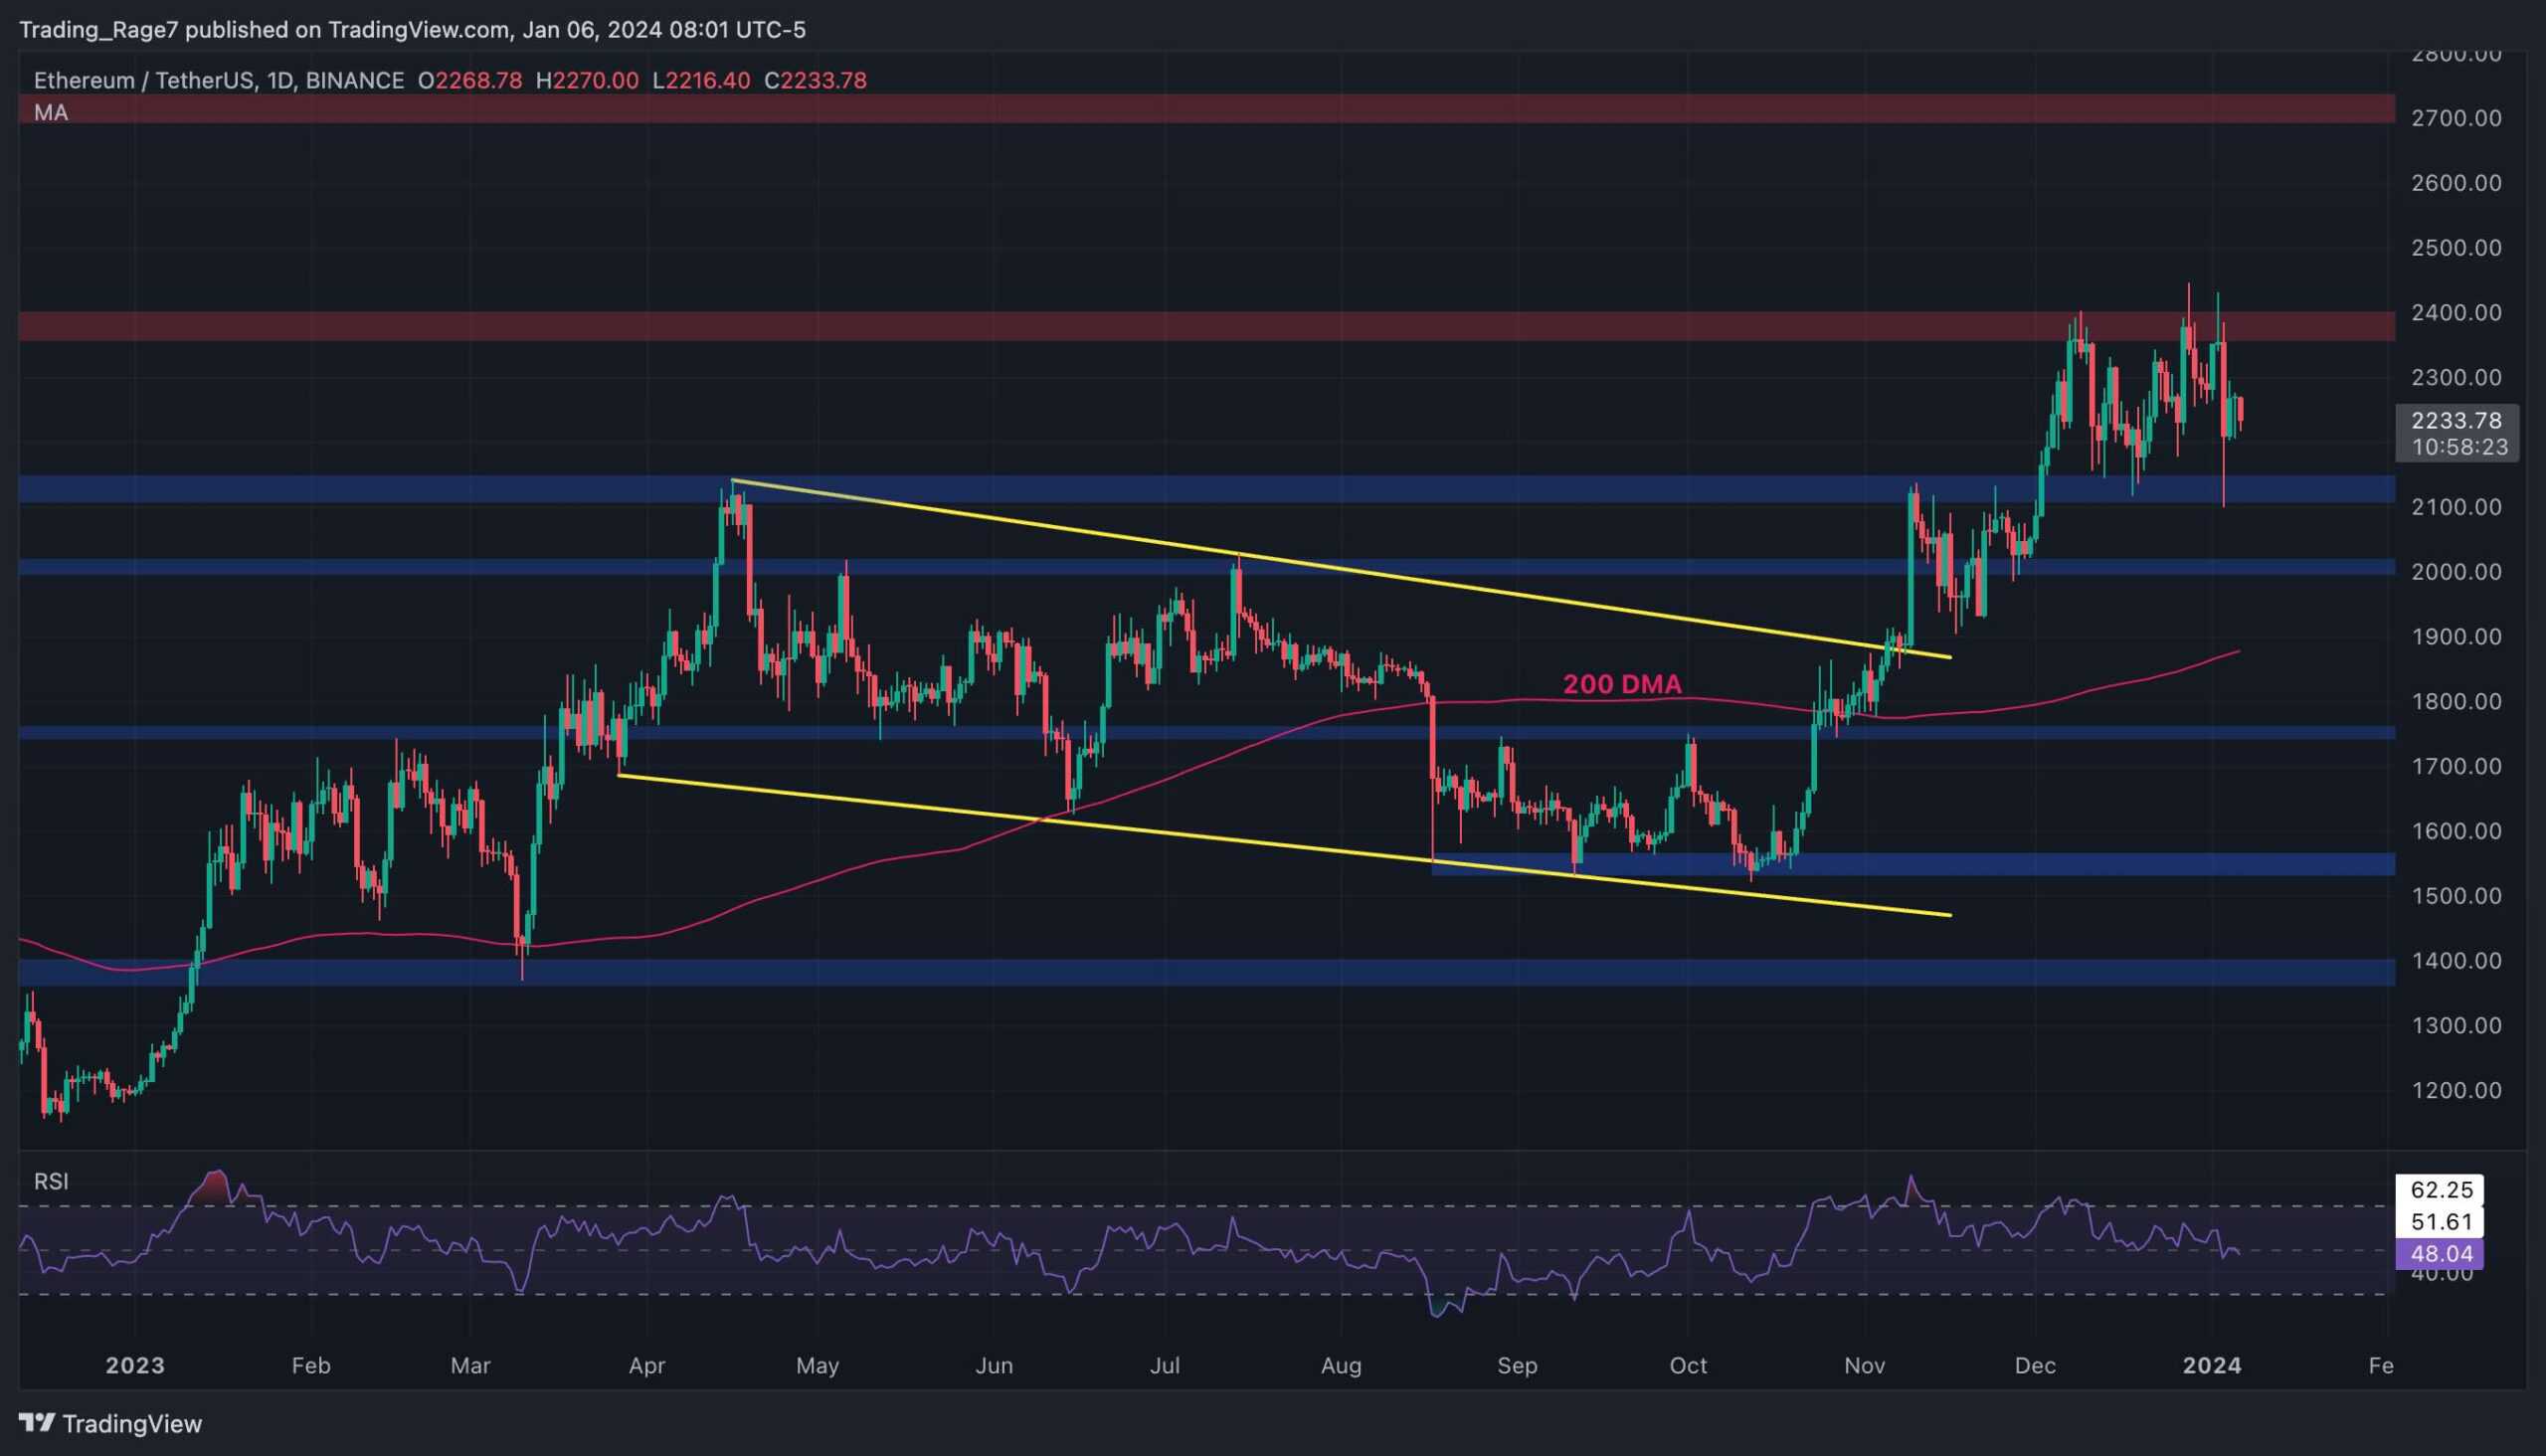
On the daily timeframe, the price has been on the rise since breaking above the 200-day moving average and the large descending channel. While ETH is still trading above the key $2,000 level, it is going through a consolidation phase below the $2,400 level, failing to climb higher.
The Relative Strength Index is also hovering around the 50% level, pointing to an equilibrium in momentum. As a result, the short-term price action heavily depends on whether the cryptocurrency drops below the $2,000 level or successfully breaks above the $2,400 level to target the $2,700 resistance zone.
The 4-Hour Chart
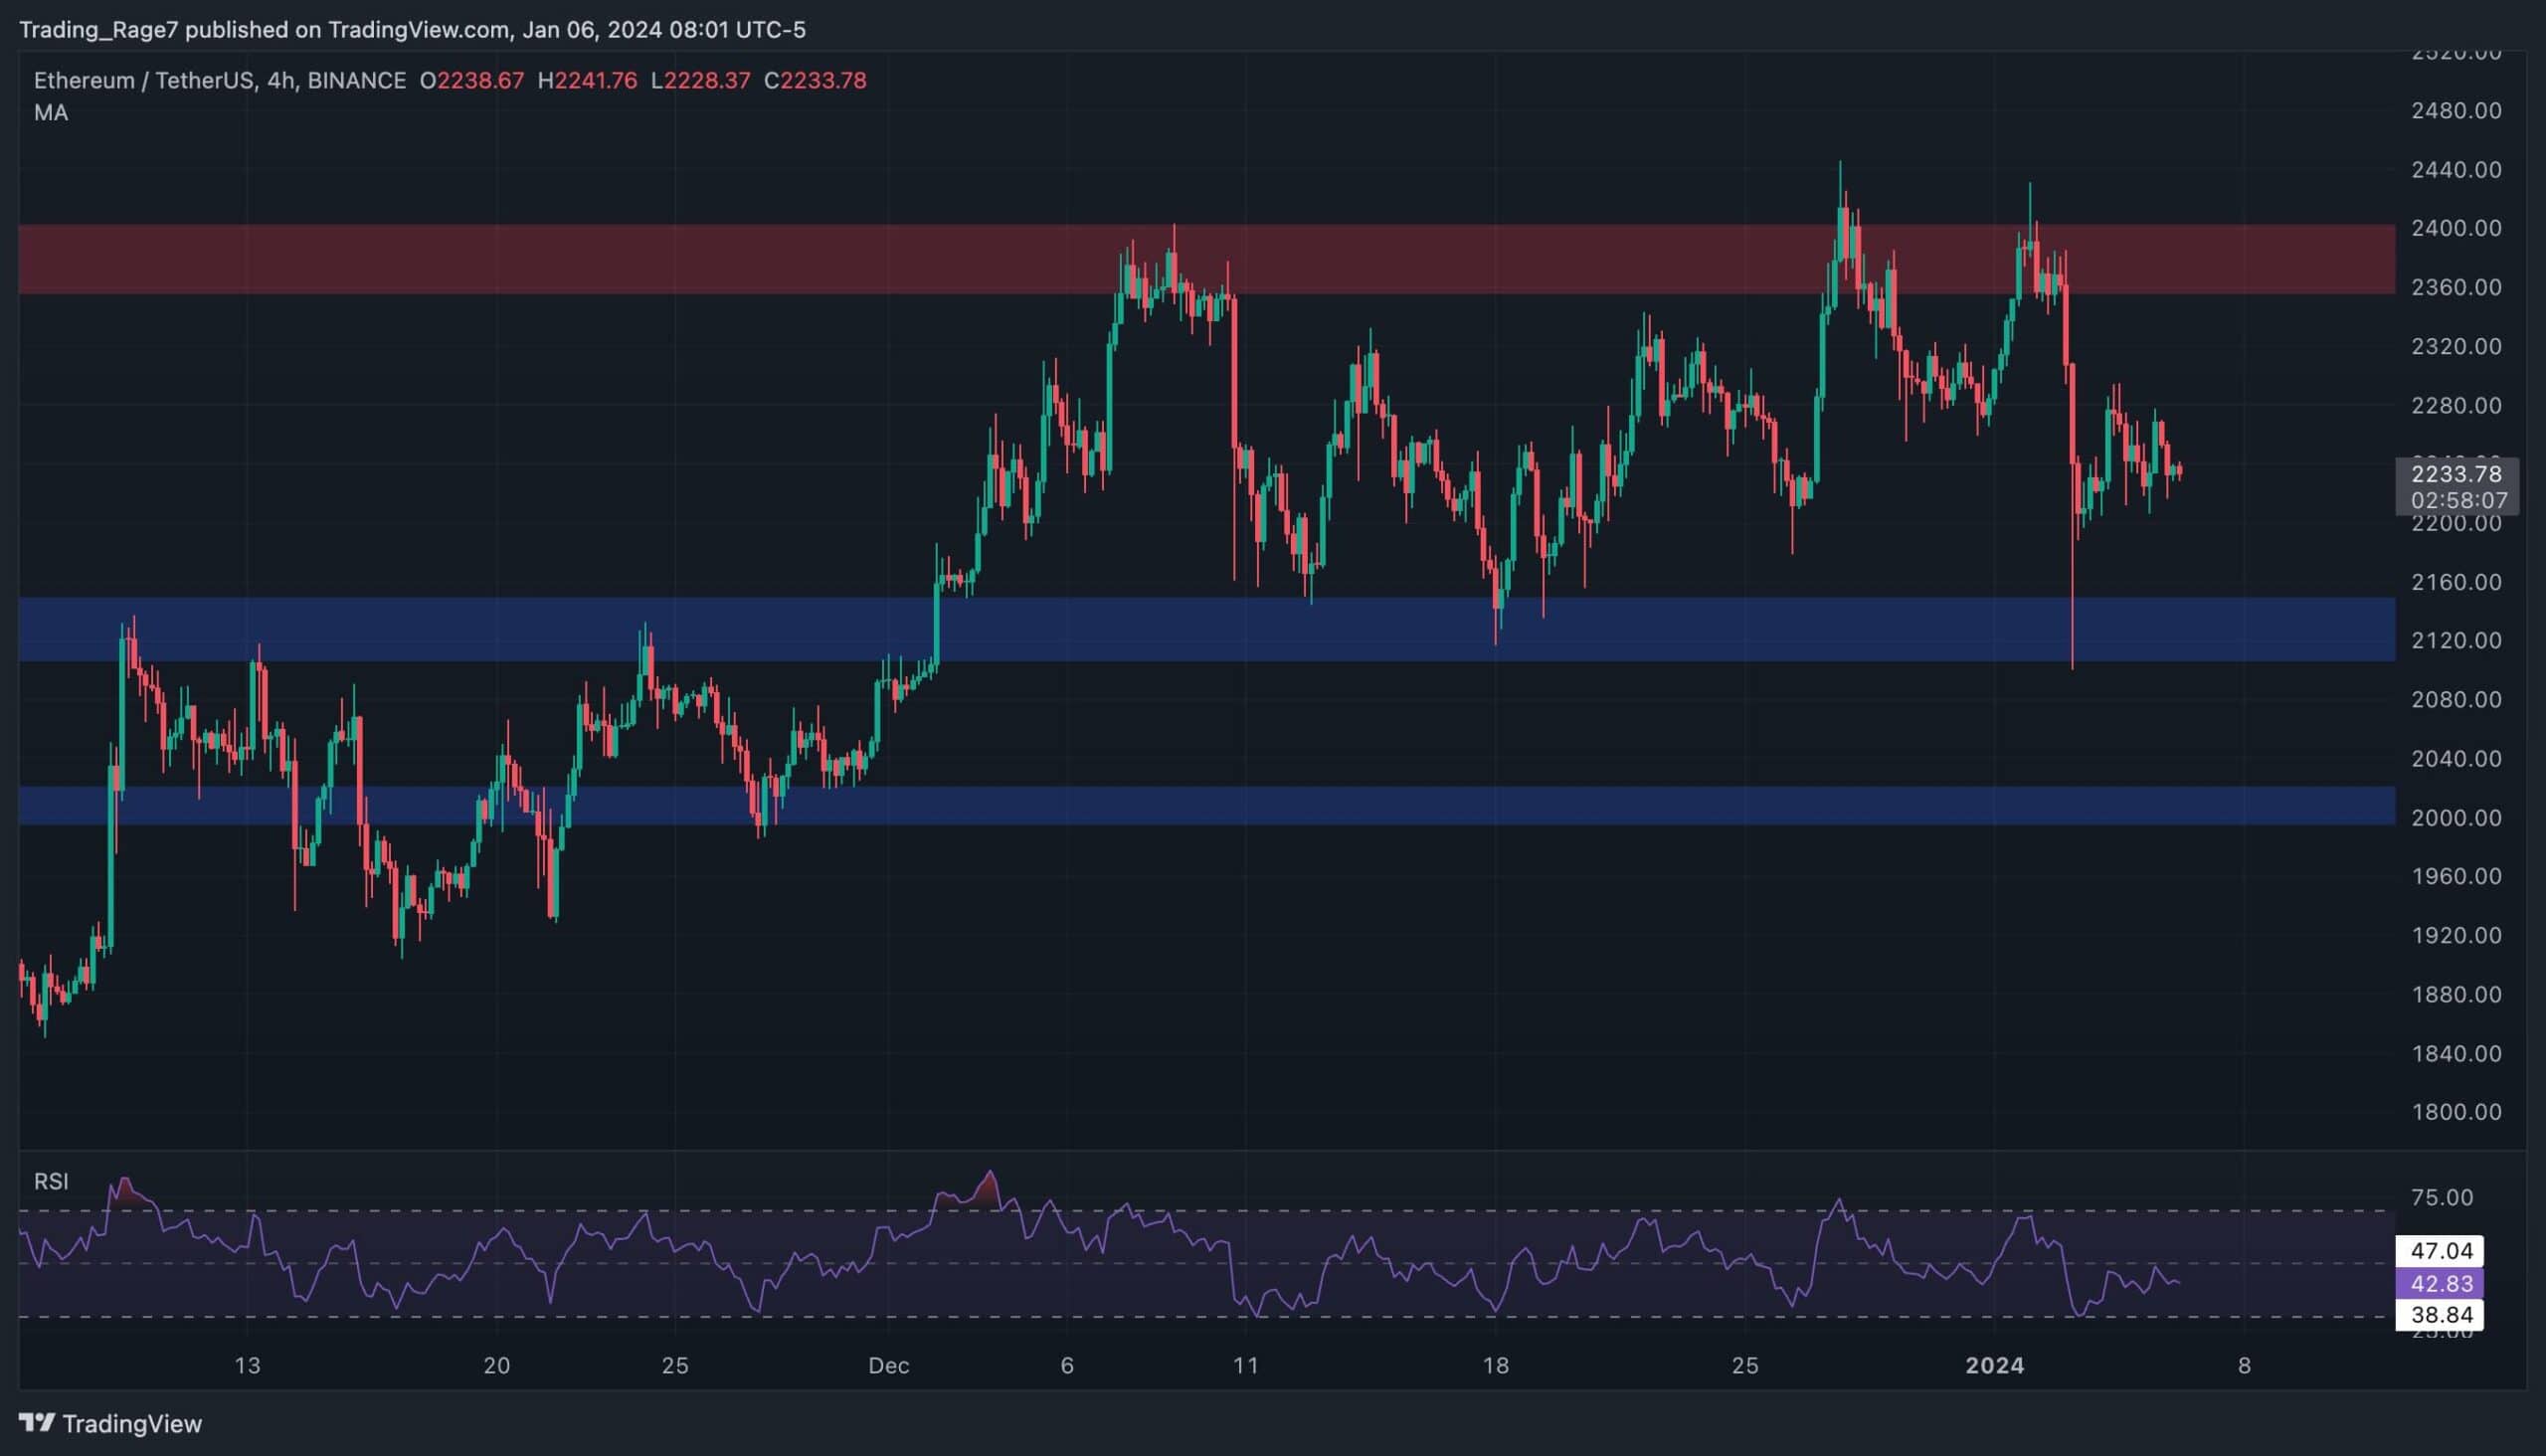
Looking at the 4-hour chart, it is evident that the price has been oscillating between the $2,100 and $2,400 levels over the last month. Following the recent rapid drop toward the former area, ETH has rebounded and is consolidating in the middle of the range.
Therefore, while the market structure is still relatively bullish, things could go either way, depending on the direction of the potential breakout from the mentioned range.
Sentiment Analysis
By Shayan
Ethereum Open Interest
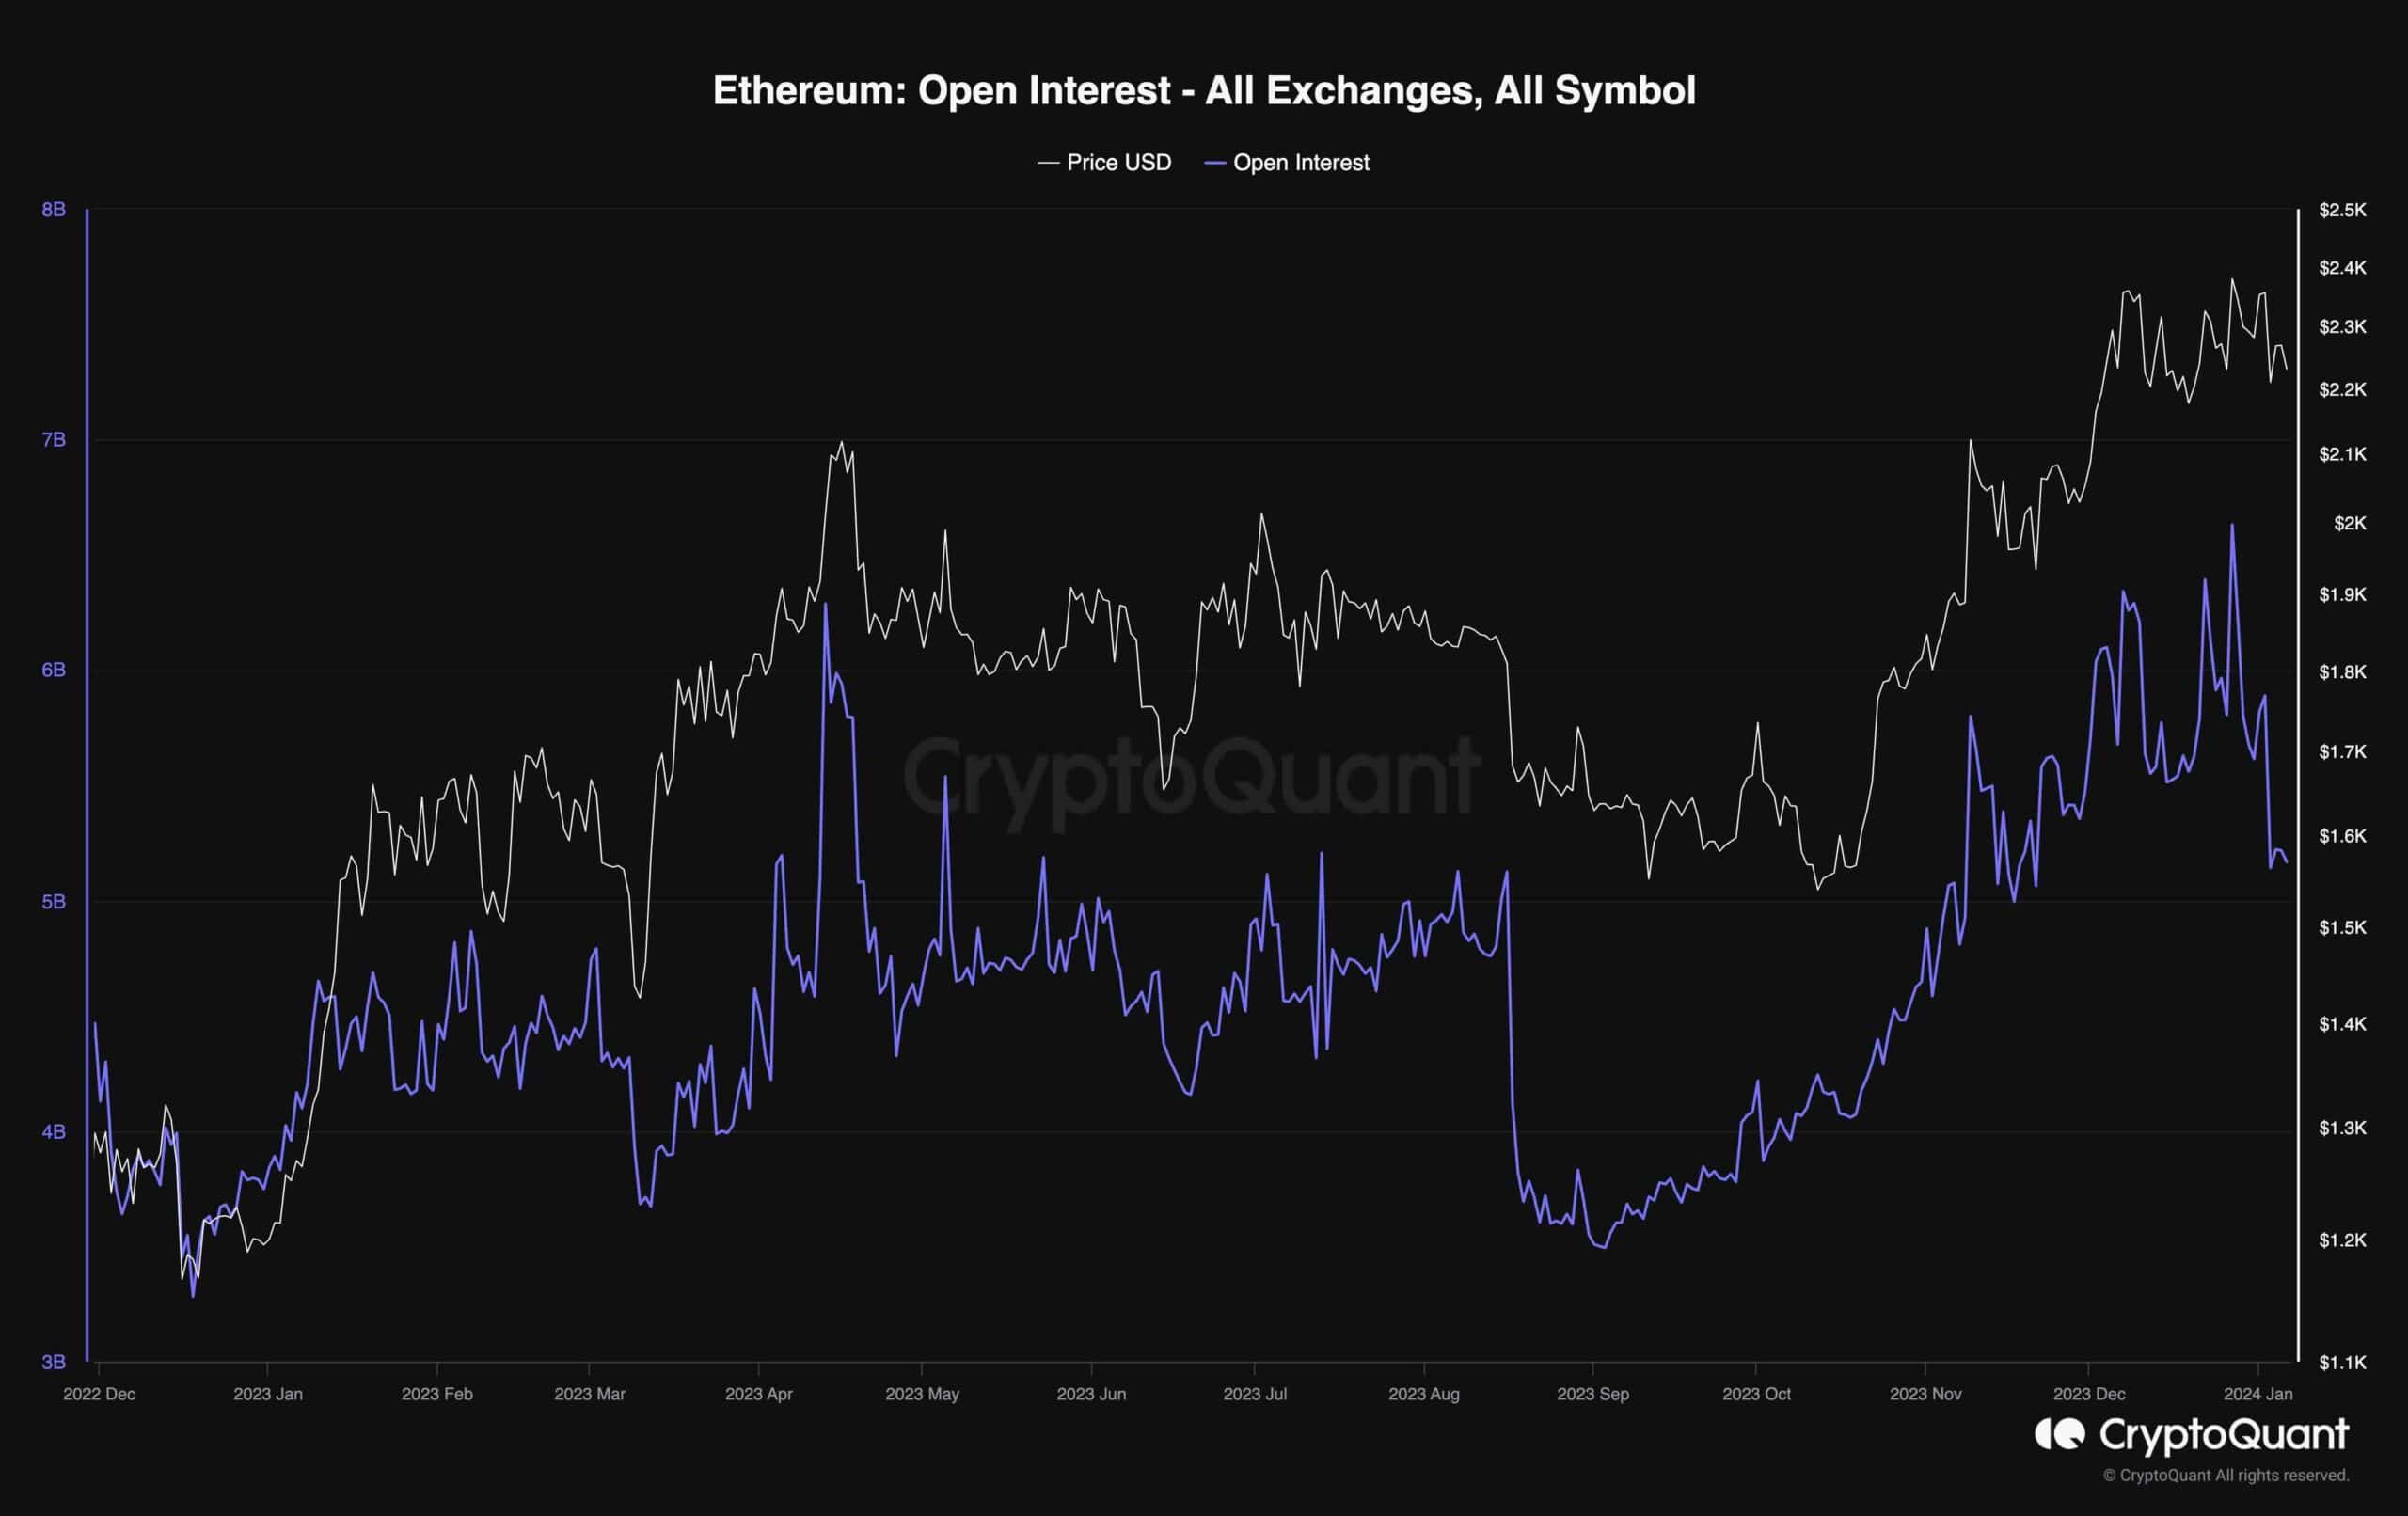
Ethereum has undergone a significant uptrend in recent months, surging from below $1K to over $2.4K. Currently, the price is exhibiting uncertainty about its future trajectory, prompting a closer look at futures market sentiment for valuable insights.
The provided chart illustrates the open interest metric across all exchanges, counting the number of open futures contracts regardless of trade direction. Higher values indicate confidence among futures traders regarding the trend, while lower values suggest uncertainty. Additionally, increased open interest correlates with heightened price volatility, raising the likelihood of liquidation cascades.
While the price has been on an upward trend, open interest has consistently risen, indicating a bullish market sentiment. However, a recent phase of sideways consolidation has coincided with a notable decline in open interest. This suggests that many long positions have been flushed out, indicating a healthy futures market, potentially paving the way for a renewed impulsive trend. The direction of the upcoming trend, however, remains uncertain until the funding rate metric experiences a notable move, either above or below one.
The post ETH Uncertain Above $2.2K but is a Drop Toward $2,000 in Play? (Ethereum Price Analysis) appeared first on CryptoPotato.