ETH Unable to Breach $2,000 as Bulls Running Out of Steam: Ethereum Price Analysis
Ethereum’s price rally has slowed down in recent weeks. The price has yet to break above the $2,000 level, which is making many market participants worried.
Ethereum Price Technical Analysis
By: Edris
The Daily Chart:
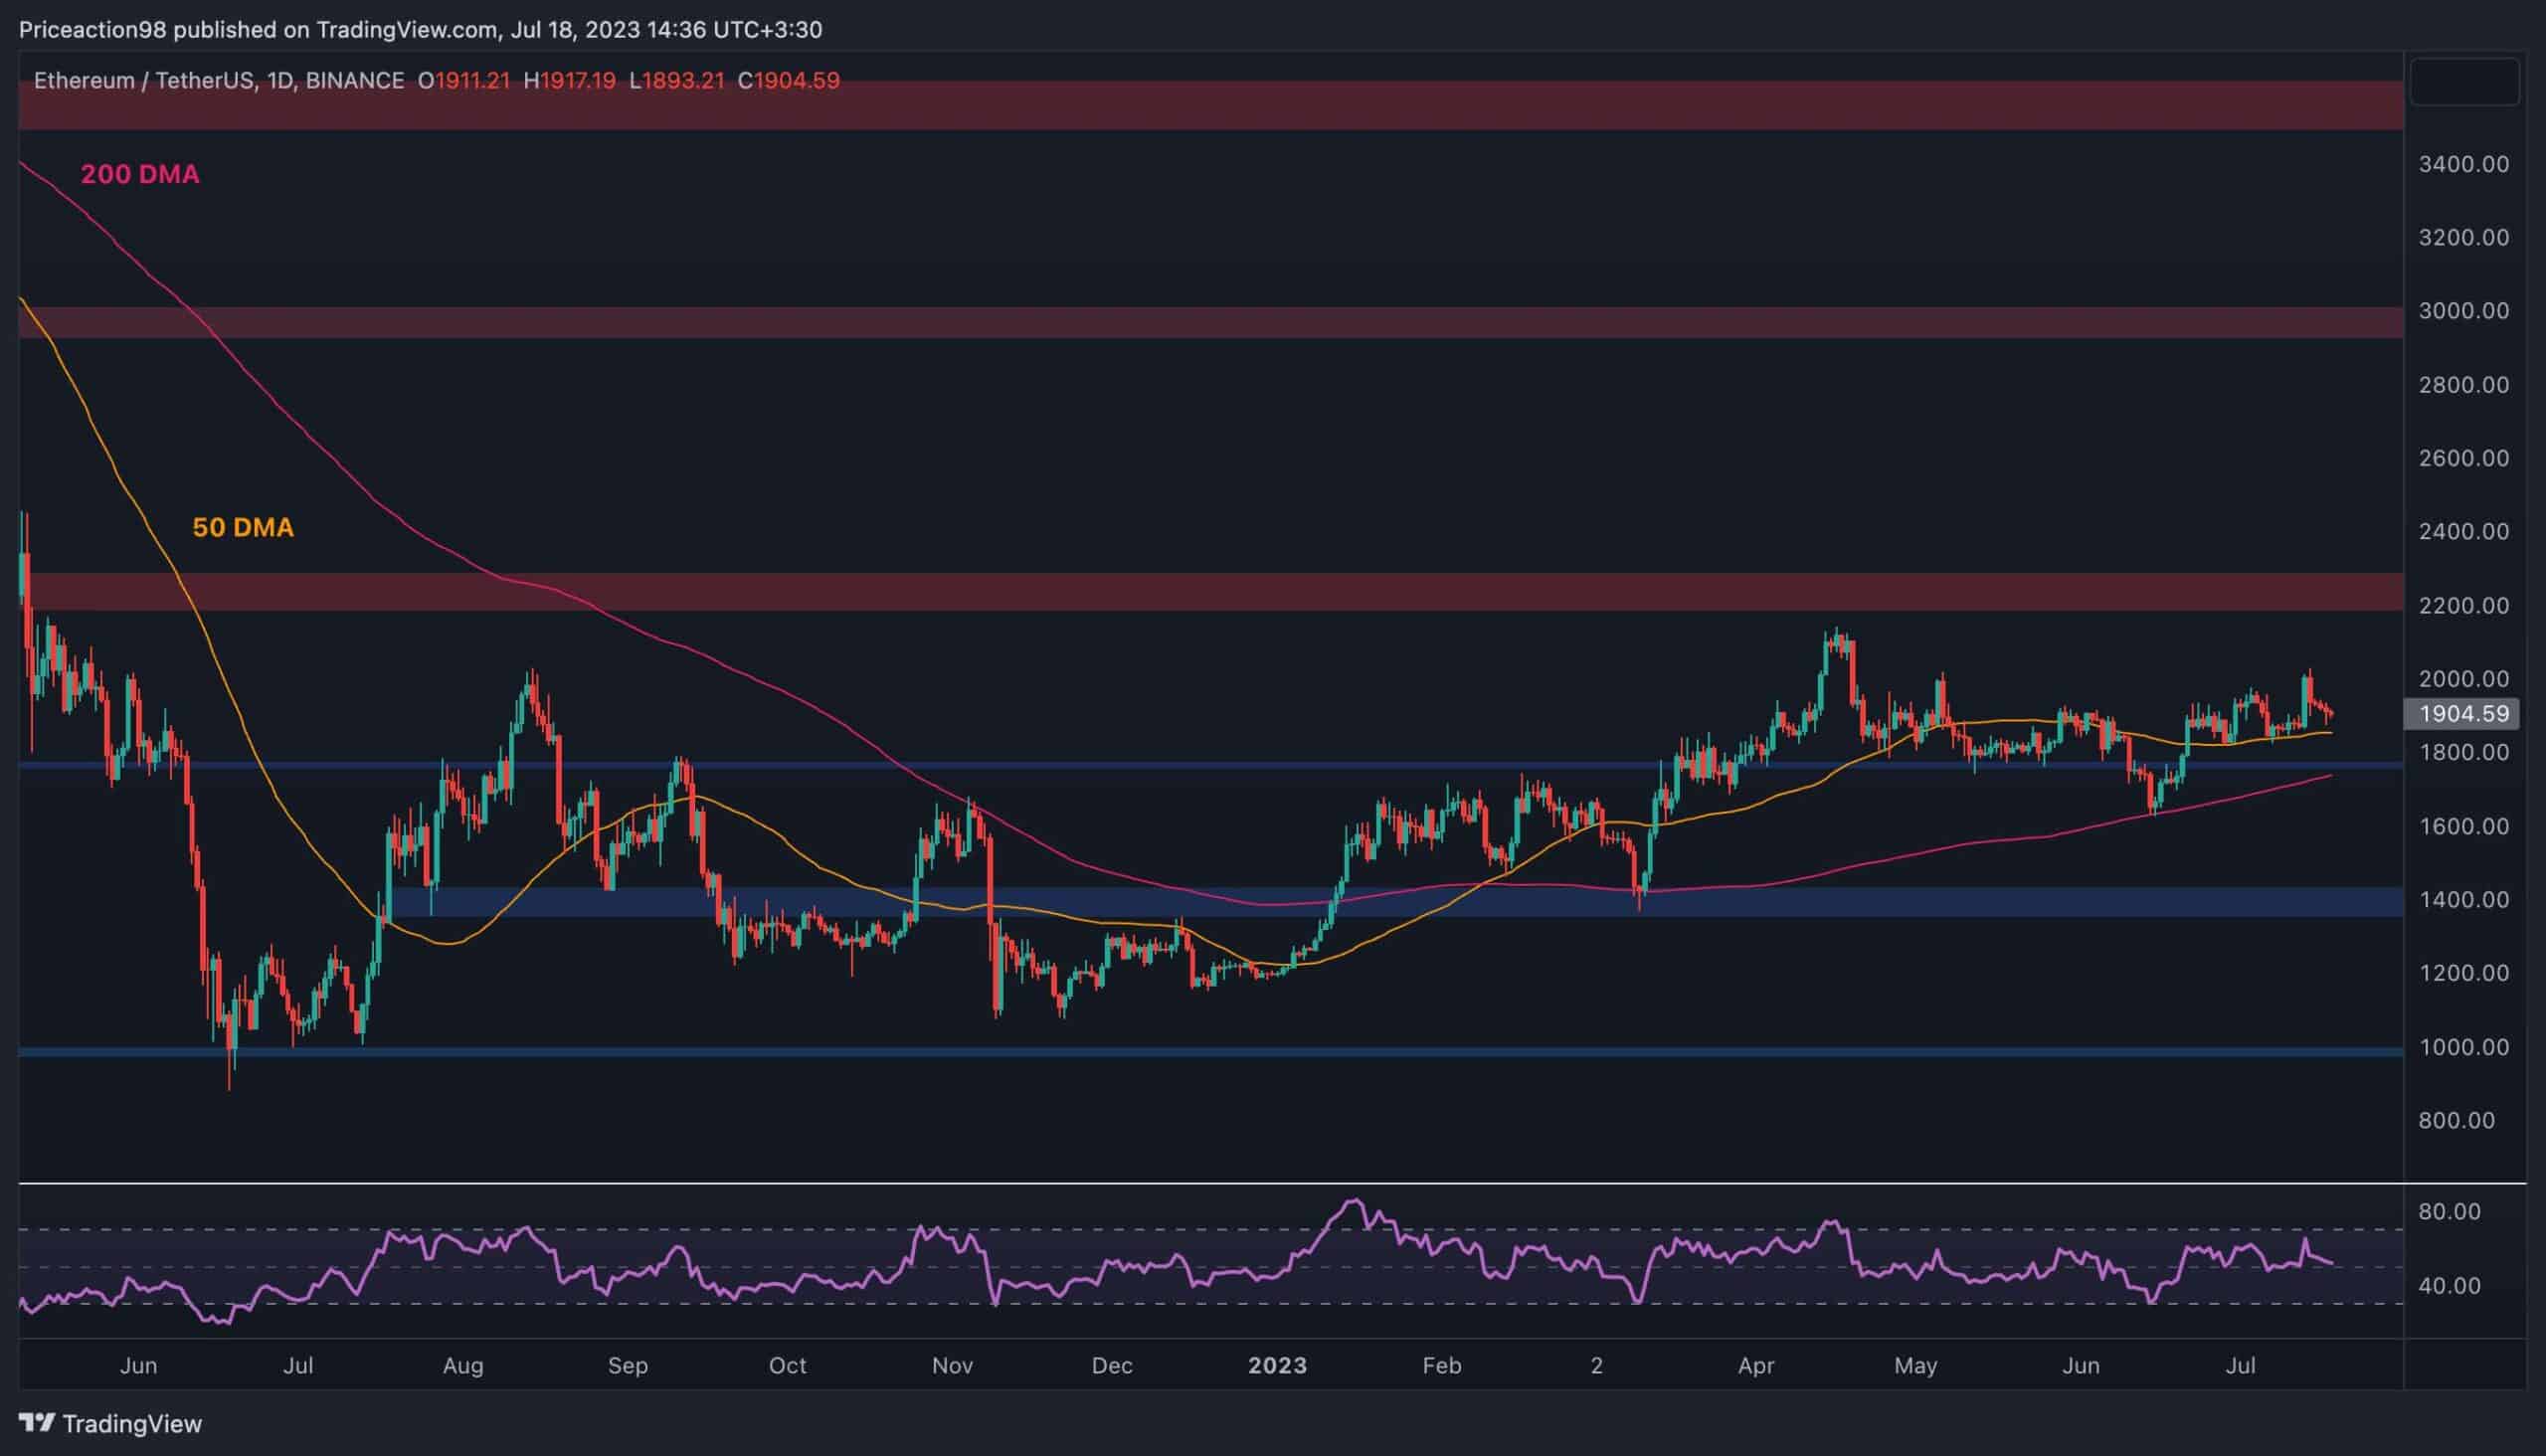
On the daily timeframe, the price has been forming higher highs and higher lows since rebounding from the 200-day moving average earlier in June.
However, there is a clear lack of bullish momentum, as the ETH price keeps pulling back towards the 50-day moving average located around the $1,900 mark. In case it breaks, there are two close support levels available: the $1,800 static level and the 200-day moving average close to the same price mark.
Therefore, while the momentum is seemingly fading, there is still hope that a rebound from either of these levels would initiate the next rally higher.
The 4-Hour Chart:
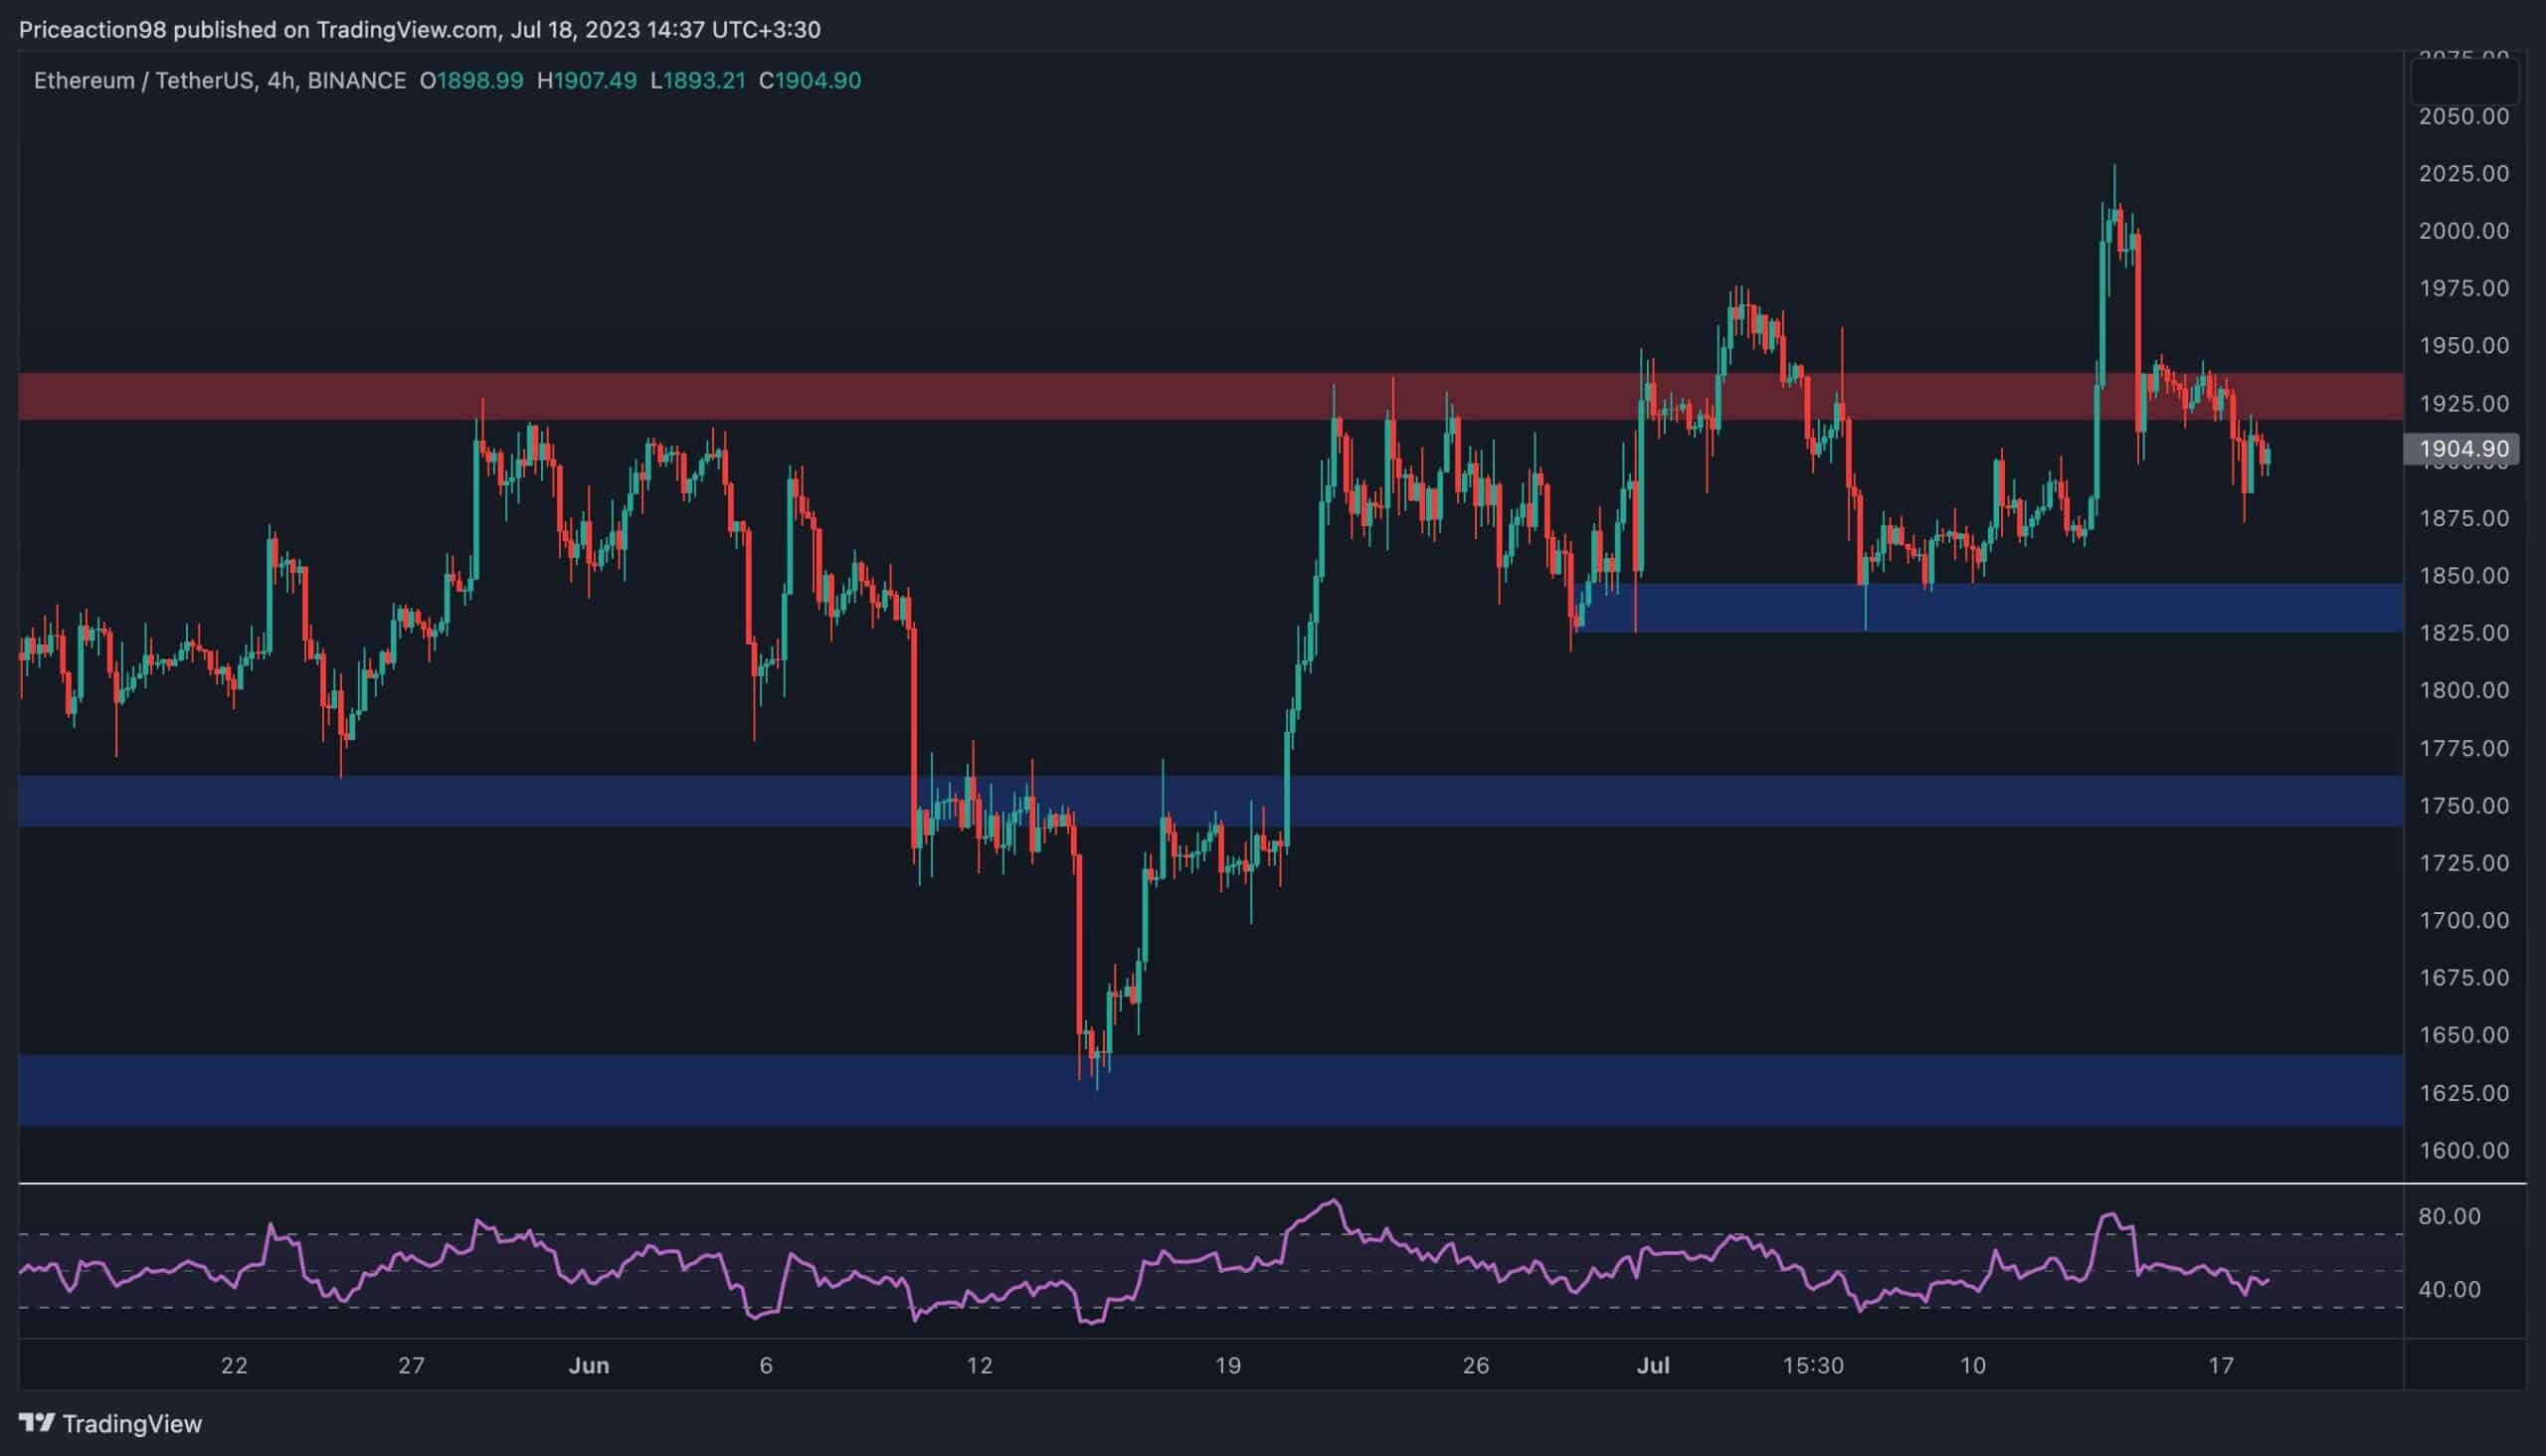
Recent PA developments become clearer on the 4-hour chart.
The ETH price has broken above the $1,930 resistance level a couple of times since the beginning of July but has failed in both instances, as it has rapidly dropped back below the level.
Currently, the price is seemingly targeting the $1,850 short-term support level once again, with the $1,750 level available as the next target in line in case the former level fails to hold. The RSI indicator, while previously signaling the potential fake breakout and drop, is offering little insight at the moment, as it is oscillating around the 50% value. This behavior confirms the indecisiveness of the market participants and the equilibrium in momentum.
Sentiment Analysis
By: Edris
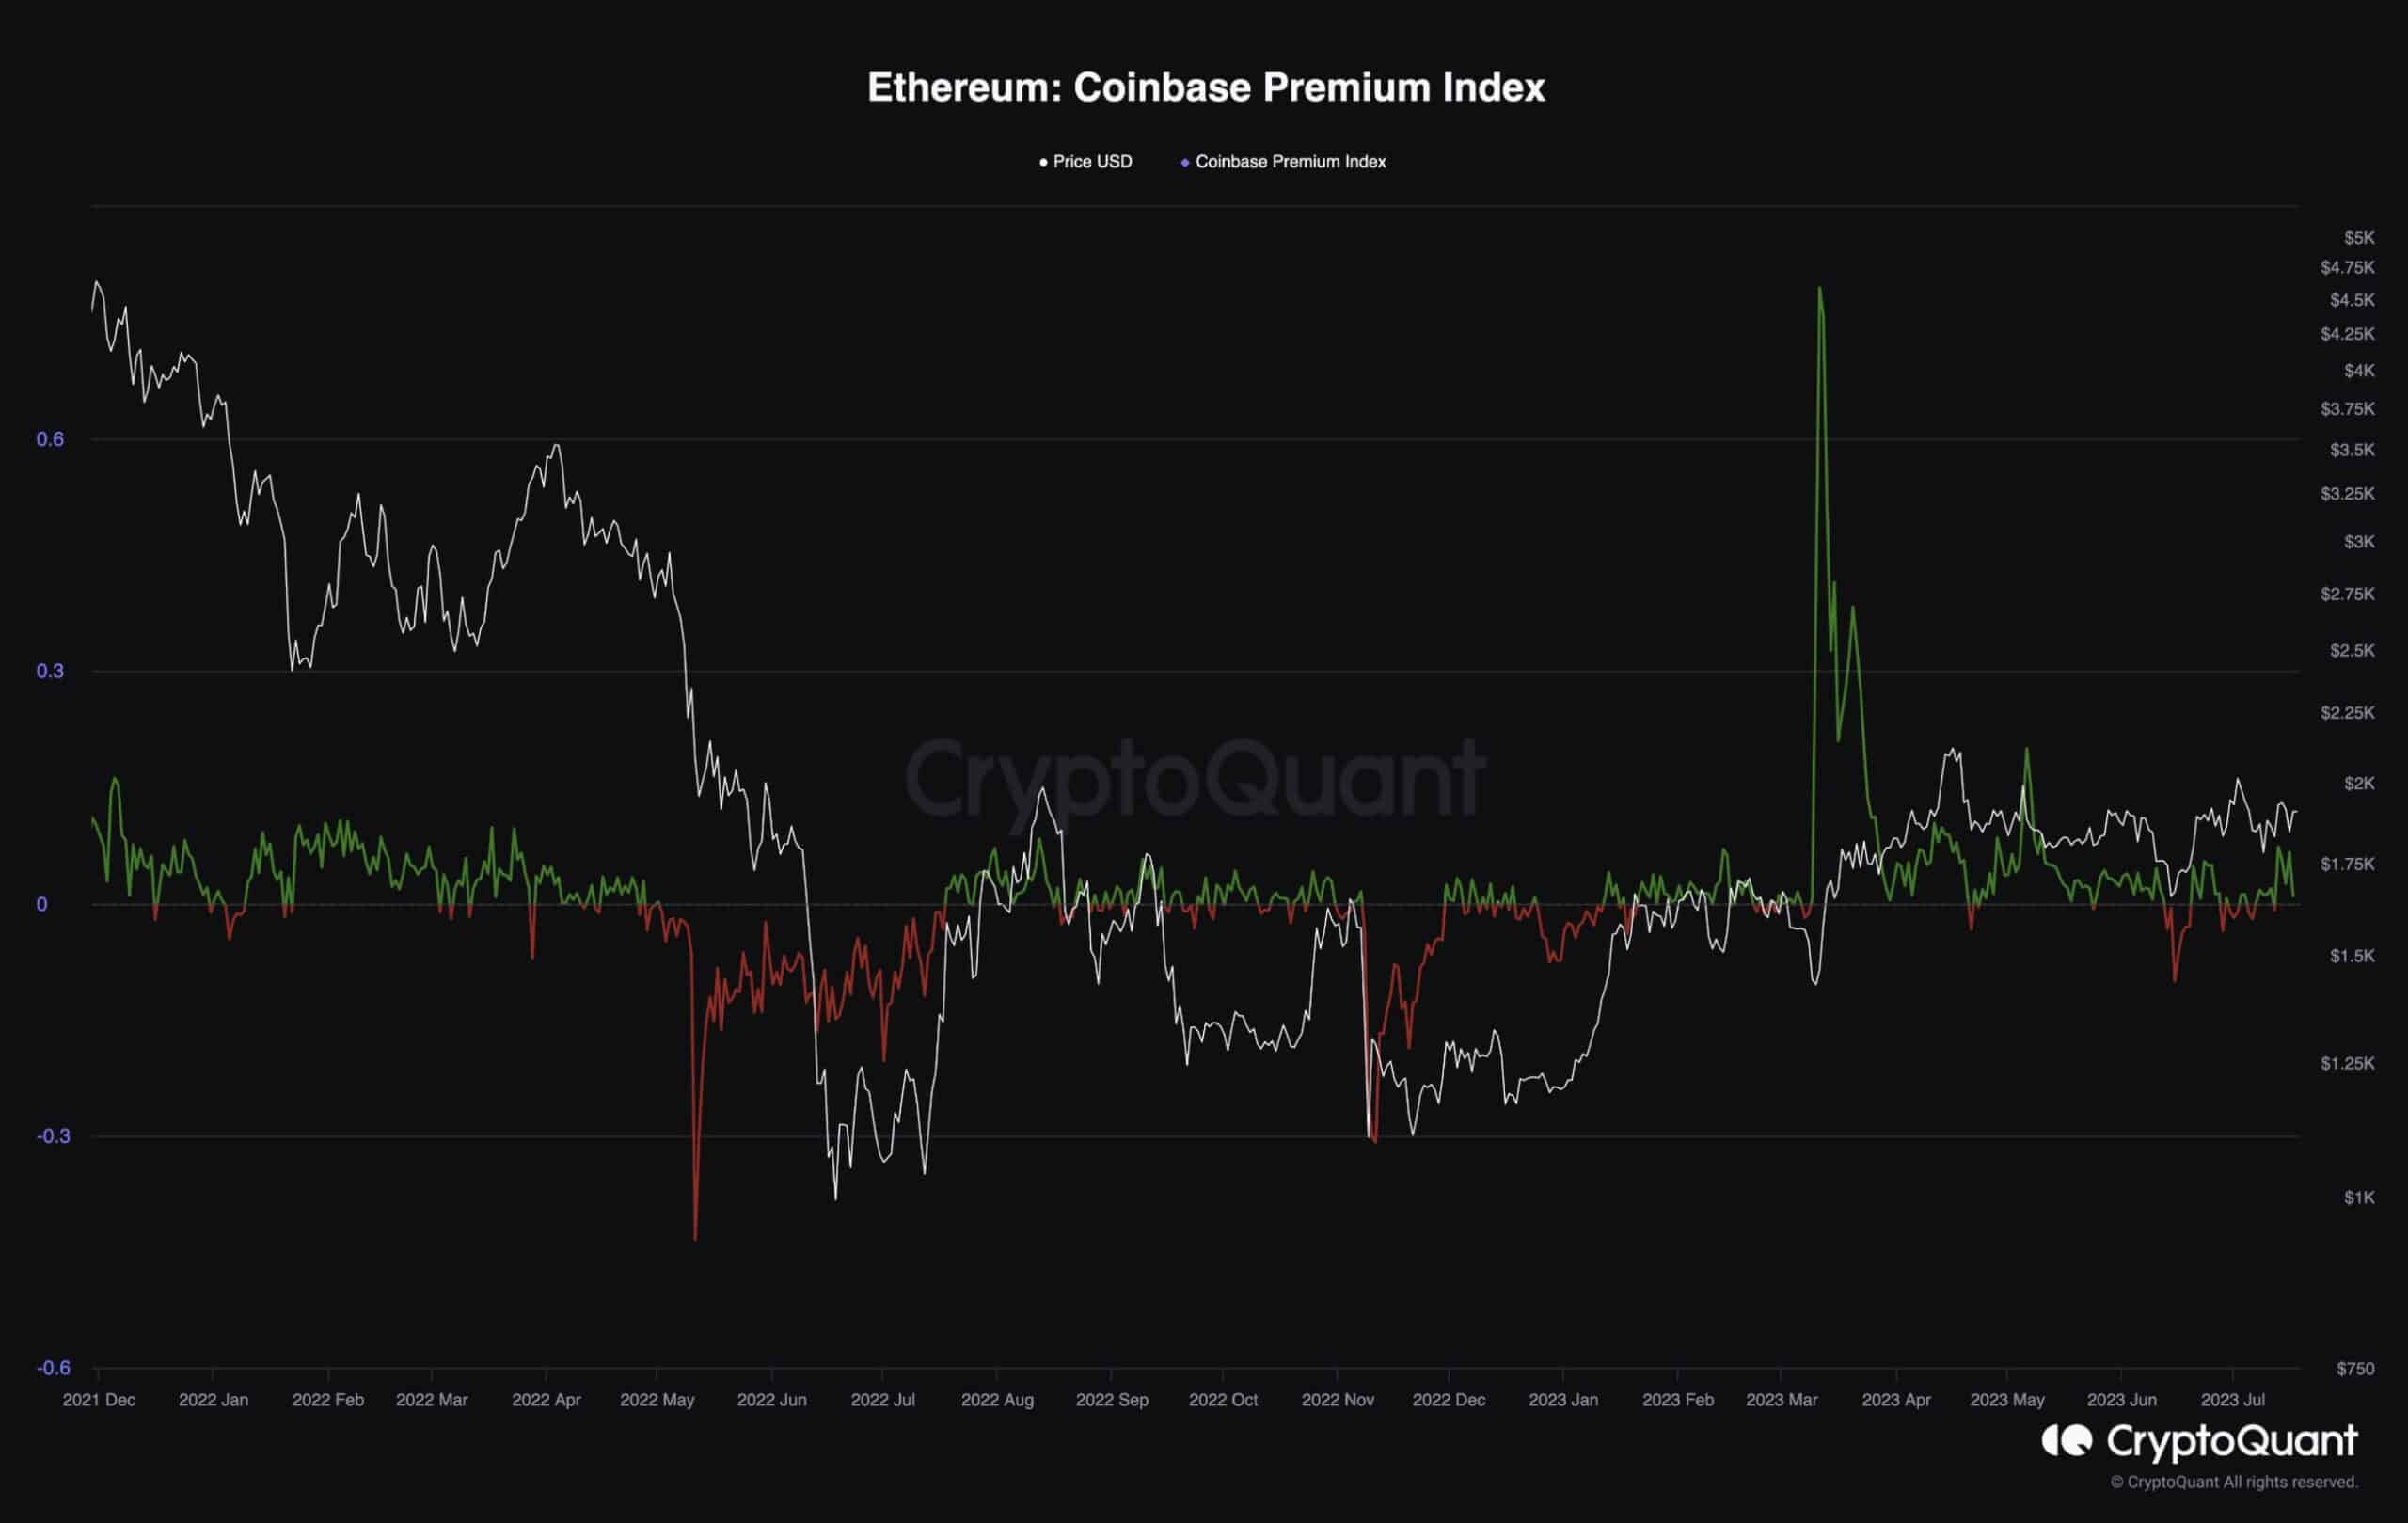
Ethereum Coinbase Premium Index
Ethereum’s price has remained relatively stagnant over the past few months, consolidating around the $2,000 level. However, interesting activity has been going on in the background.
The chart displays the Ethereum Coinbase premium gap, which is calculated based on the gap between ETH’s price on Coinbase and Binance, two of the largest exchanges in the world. This metric shows whether US investors are buying or selling on aggregate compared to other investors. Positive values indicate buying pressure from the United States.
As the image demonstrates, there has been a significant shift in the US market sentiment, as the premium gap index has mostly been positive. Considering that many US investors are wealthy individuals or institutions, this could be a positive signal for ETH, pointing out that it might be in the accumulation phase at the beginning of a new bull market.
The post ETH Unable to Breach $2,000 as Bulls Running Out of Steam: Ethereum Price Analysis appeared first on CryptoPotato.