ETH Price Analysis: Ethereum Showing Weakness Against Rising Bitcoin, Lower Targets Incoming?
- Ethereum bulls are currently trying to defend the 2019 high price at $364.
- The cryptocurrency is forming a descending triangle pattern on the 4HR charts.
- Against Bitcoin, ETH shows weakness as it starts to head back to the September support around 0.0329 BTC.
ETH/USD – Etheruem Starts To Form Short Term Descending Triangle
Key Support Levels: $364, $355, $336.
Key Resistance Levels: $390, $400, $410.
Ethereum dropped from the $390 resistance at the start of the week, but the bulls have defended the 2019 High price at $364. The market is now forming a short term descending triangle pattern, which can be seen on the following 4HR chart:
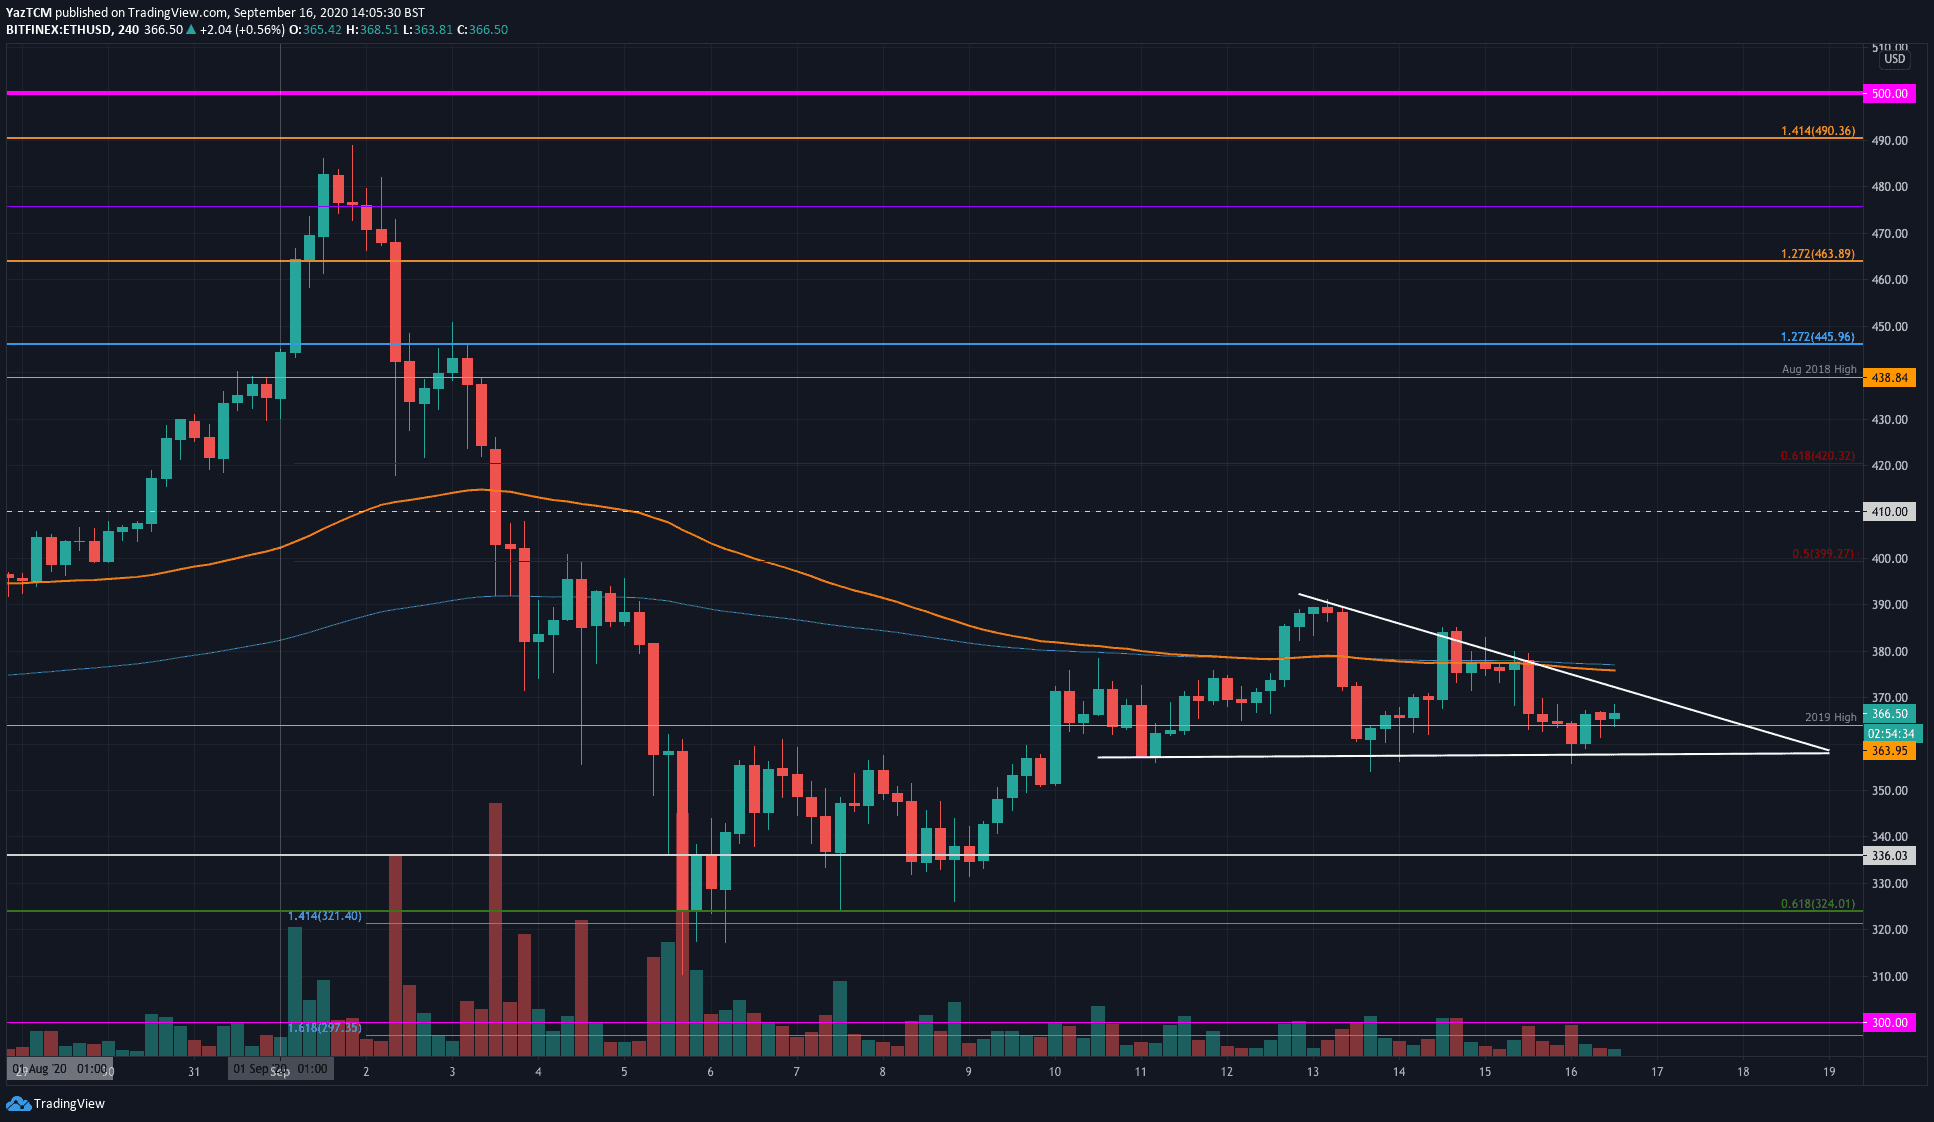
It shows the floor of the triangle at $355, and a break beneath here would see Ethereum heading back to the $324 support.
ETH-USD Short Term Price Prediction
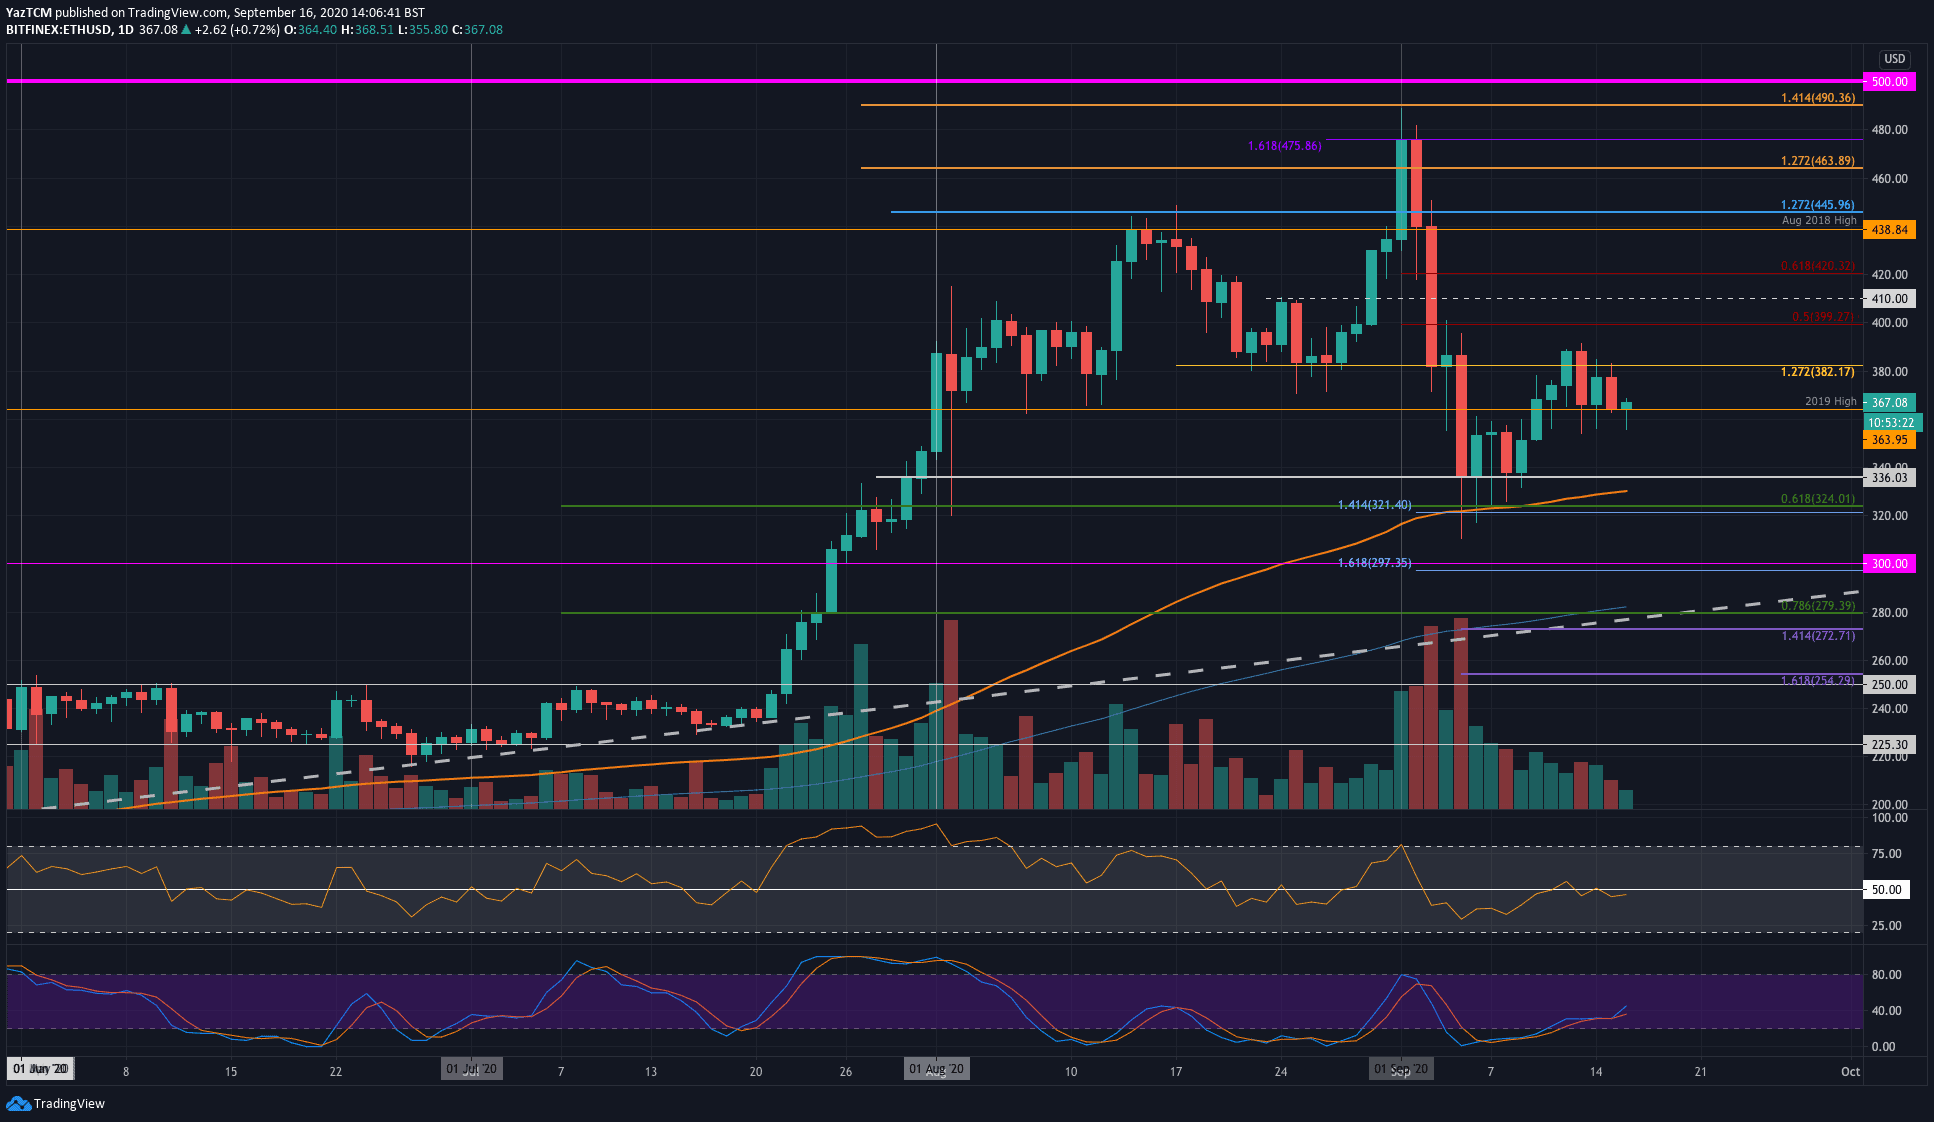
Looking ahead, if the sellers break beneath $364, the first level of support lies at the lower boundary of the short term descending triangle at $355. Beneath this, additional support lies at $336, $330 (100-days EMA), and $324 (.618 Fib Retracement). This is followed by support at $300.
On the other side, the first level of resistance lies at the upper boundary of the triangle. This is followed by resistance at $390, $400, $410, and $420 (bearish .618 Fib Retracement).
The RSI is hovering around the mid-line, which shows the market is in a state of indecision right now.
ETH/BTC – Sellers Push Back Beneath March 2019 Support
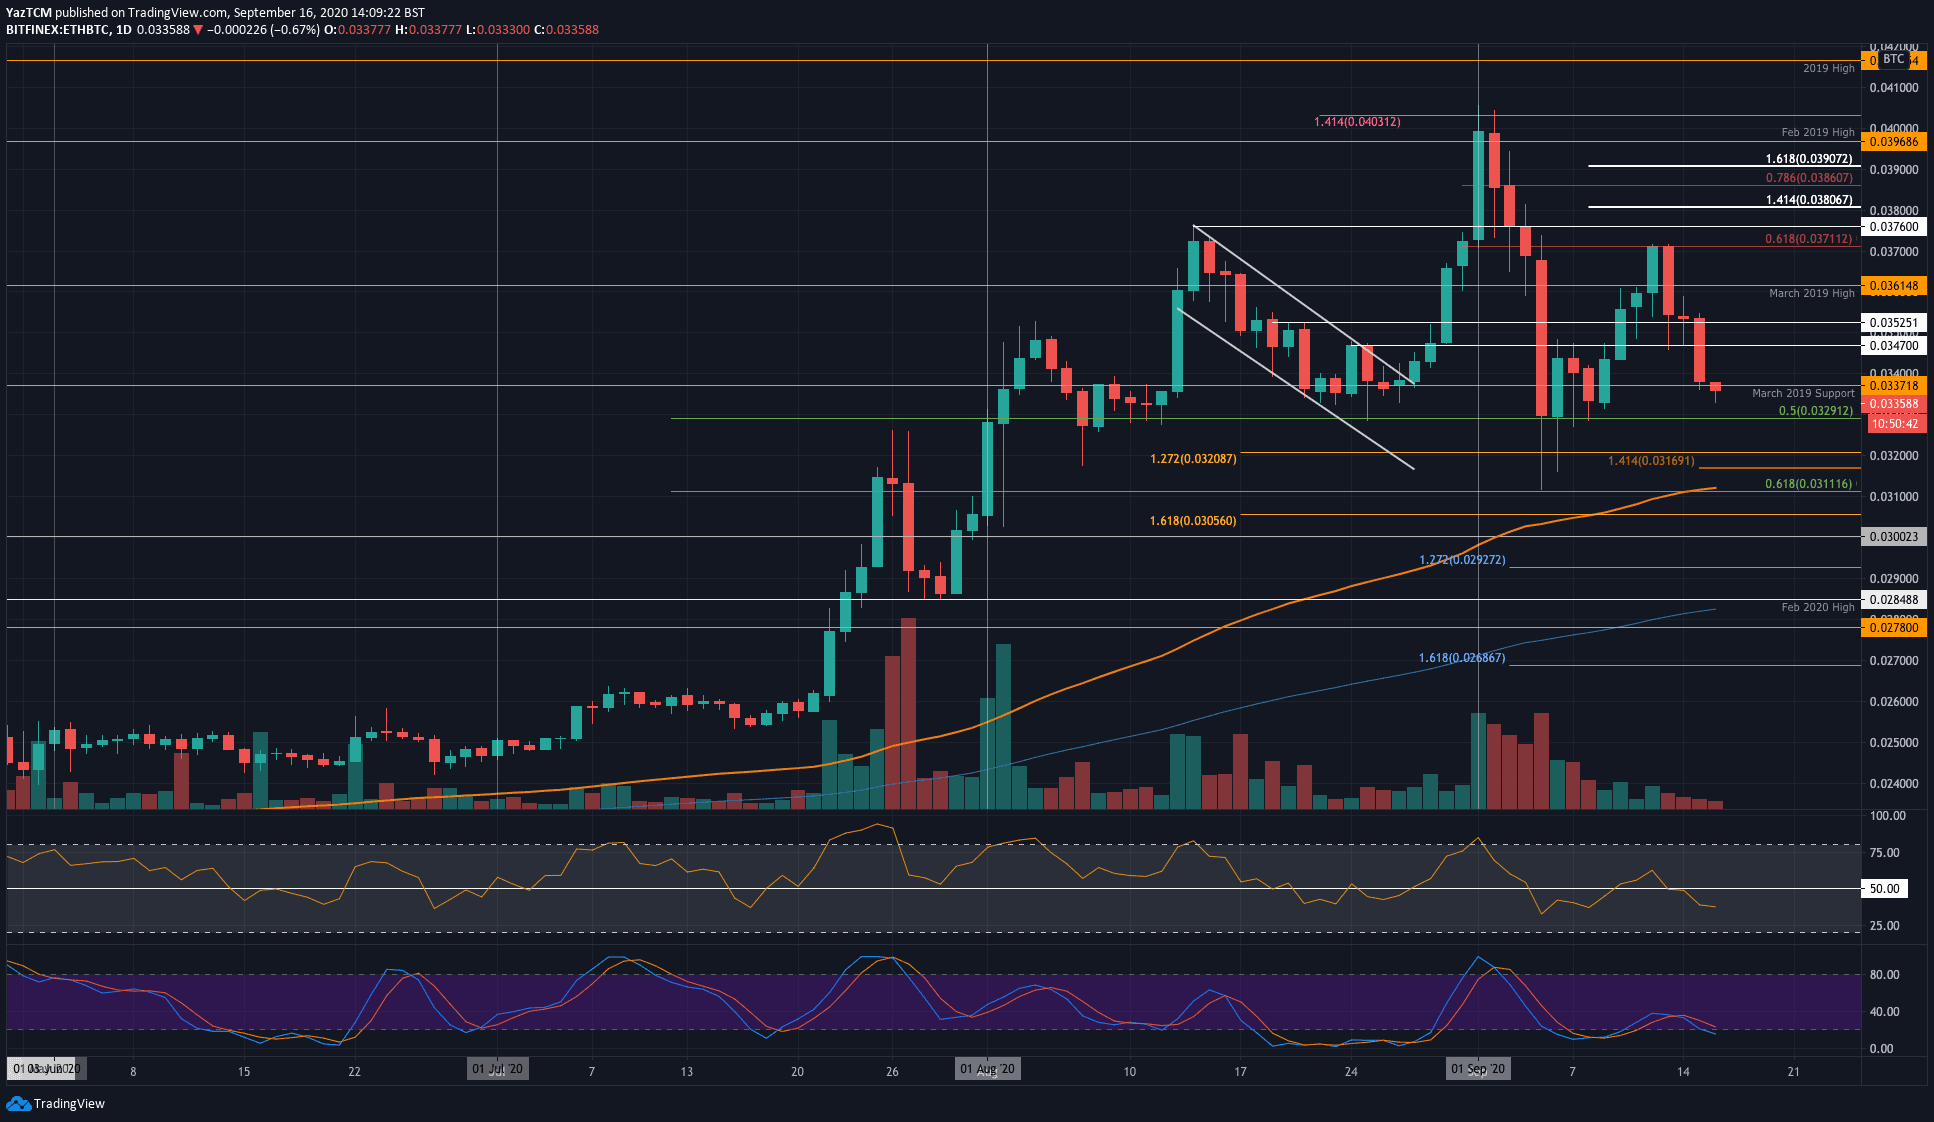
Key Support Levels: 0.0329 BTC, 0.032 BTC, 0.0316 BTC.
Key Resistance Levels: 0.034 BTC, 0.0347 BTC, 0.0361 BTC
Ethereum shows increased weakness against Bitcoin after it fell from the resistance at 0.0371 BTC (bearish .618 Fib Retracement) earlier in the week. The cryptocurrency fell into the March 2019 support at 0.0337 BTC yesterday and has continued to decline beneath here today.
ETH-BTC Short Term Price Prediction
Moving forward, the first level of strong support lies at 0.0329 BTC (.5 Fib Retracement). This is followed by added support at 0.032 BTC (downside 1.272 Fib Extension), 0.0316 BTC, and 0.0311 BTC (.618 Fib Retracement & 100-days EMA).
On the other side, the first level of resistance lies at 0.034 BTC. Added resistance lies at 0.0347 BTC, 0.0361 BTC (March 2019 Highs), and 0.0371 BTC (bearish .618 Fib Retracement).
The RSI is well beneath the mid-line and is falling, which indicates mounting bearish momentum.
The post ETH Price Analysis: Ethereum Showing Weakness Against Rising Bitcoin, Lower Targets Incoming? appeared first on CryptoPotato.