ETH Fails at $2K But WIll Bulls Attempt Another Push? (Ethereum Price Analysis)
After surpassing the 100-day moving average and retracing in the form of a pullback, Ethereum’s price initiated a rally that reached the resistance level of $2K. However, it has now temporarily paused, resulting in a consolidation phase around this crucial resistance.
Technical Analysis
By Shayan
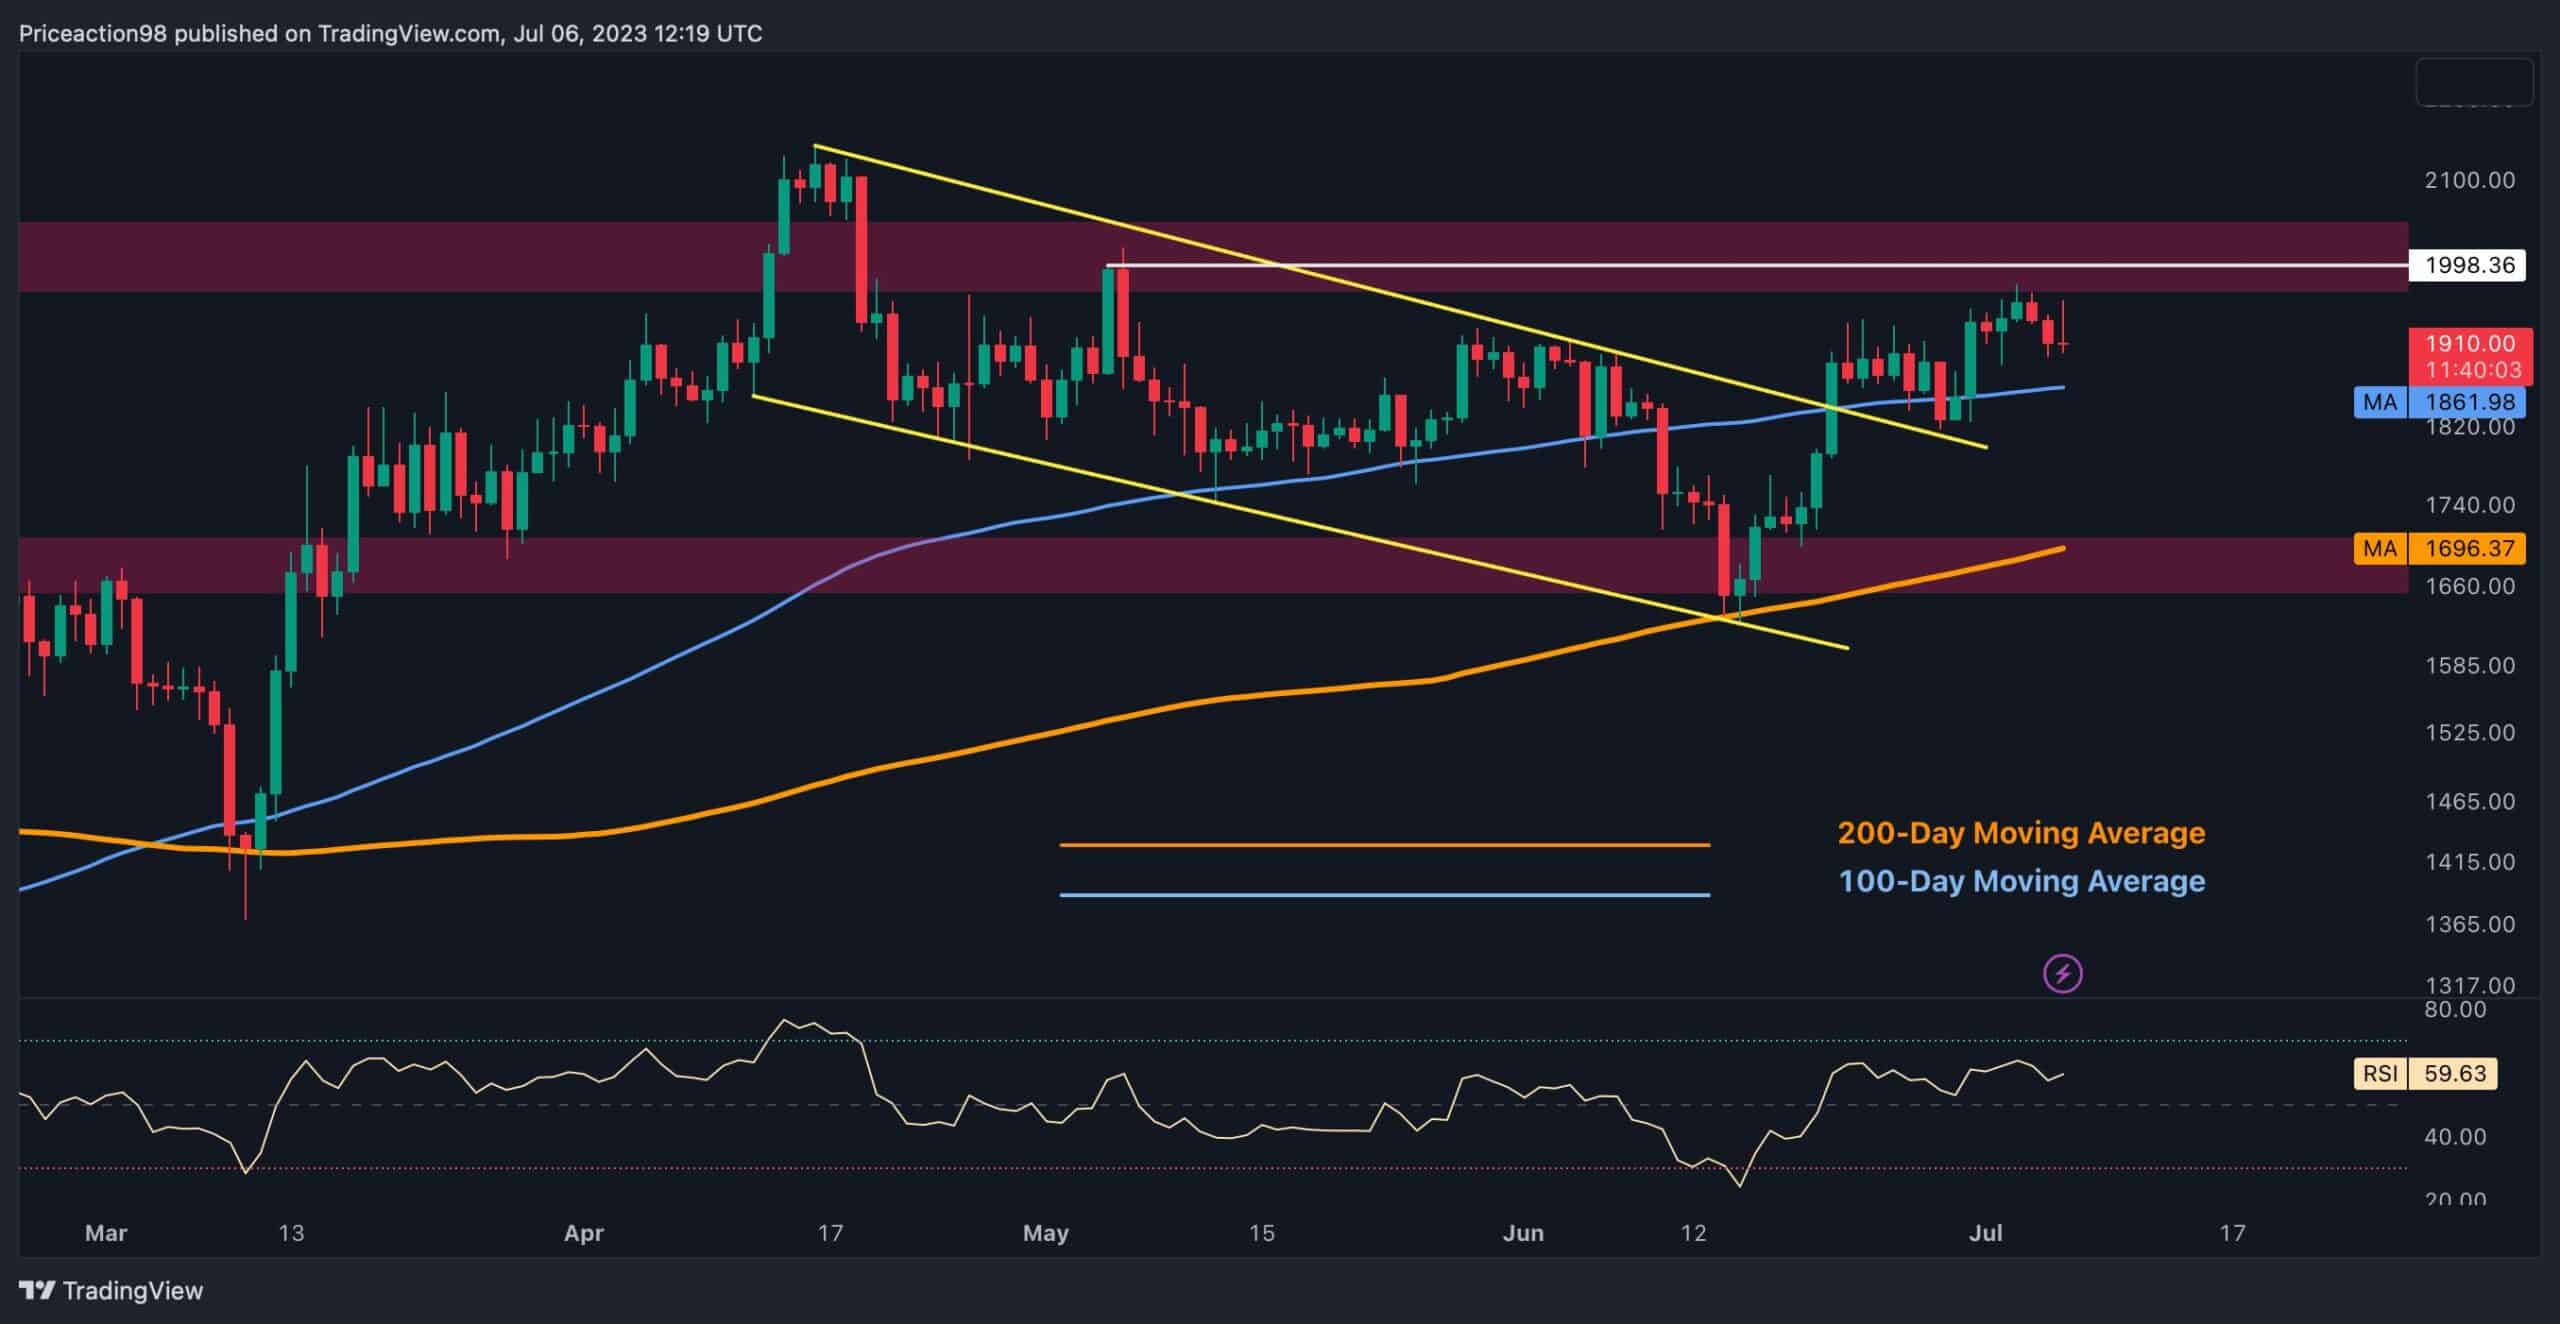
The Daily Chart
Ethereum’s price successfully broke above the 100-day moving average and the upper trendline of the descending channel, subsequently retesting them during a pullback. This led to increased buying pressure and a significant price rise, reaching the critical resistance region of $2K.
However, due to the prevailing selling pressure around this vital level, the price faced rejection and began consolidating. Notably, the $2K zone aligns with a prior major swing in Ethereum’s worth, making it a formidable barrier.
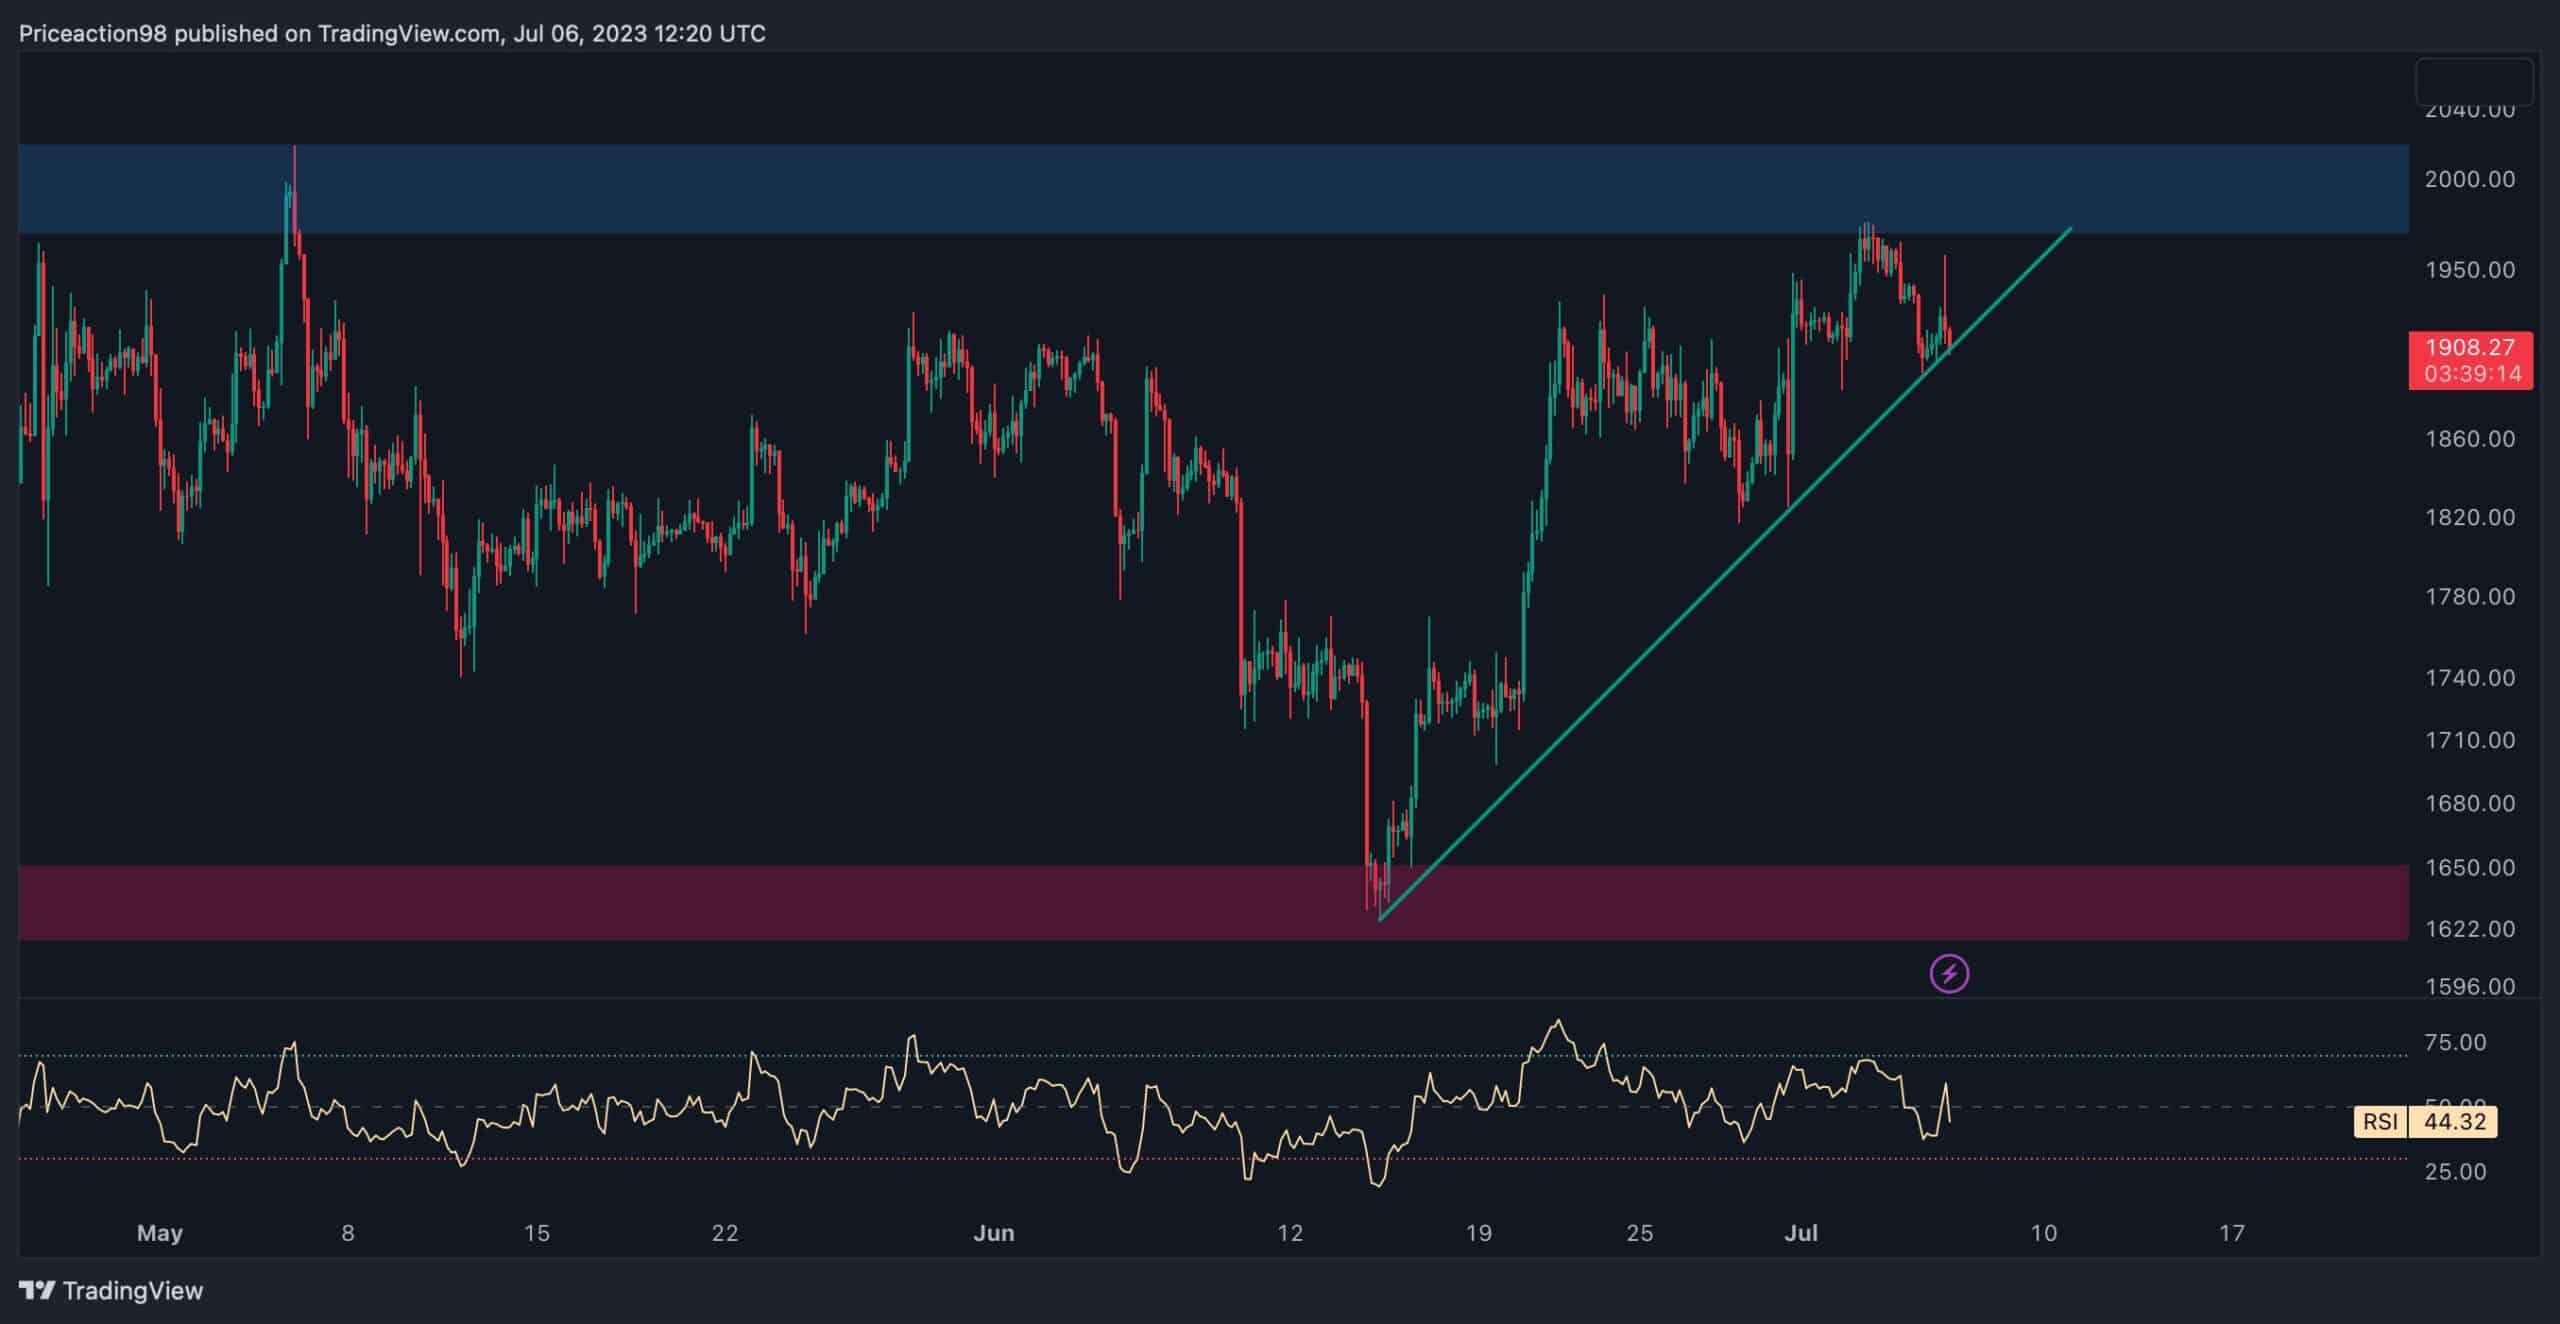
The 4-Hour Chart
Analyzing the 4-hour timeframe, it becomes evident that the momentum of the rally has weakened, and the price has formed a bearish head and shoulders reversal pattern. This suggests a bearish outlook for the price in the short-term, potentially leading to minor rejections.
On the other hand, as a result of the recent price drop, Ethereum has reached an ascending trendline (indicated in green) and is on the verge of breaking below it. If the price falls below the trendline, which currently acts as support, a cascade toward the significant support zone of $1.7K becomes highly likely.
Ultimately, Ethereum’s price appears to be confined within a static range between the $2K resistance and the $1.7K support zones, undergoing consolidation for the mid-term perspective.
On-chain Analysis
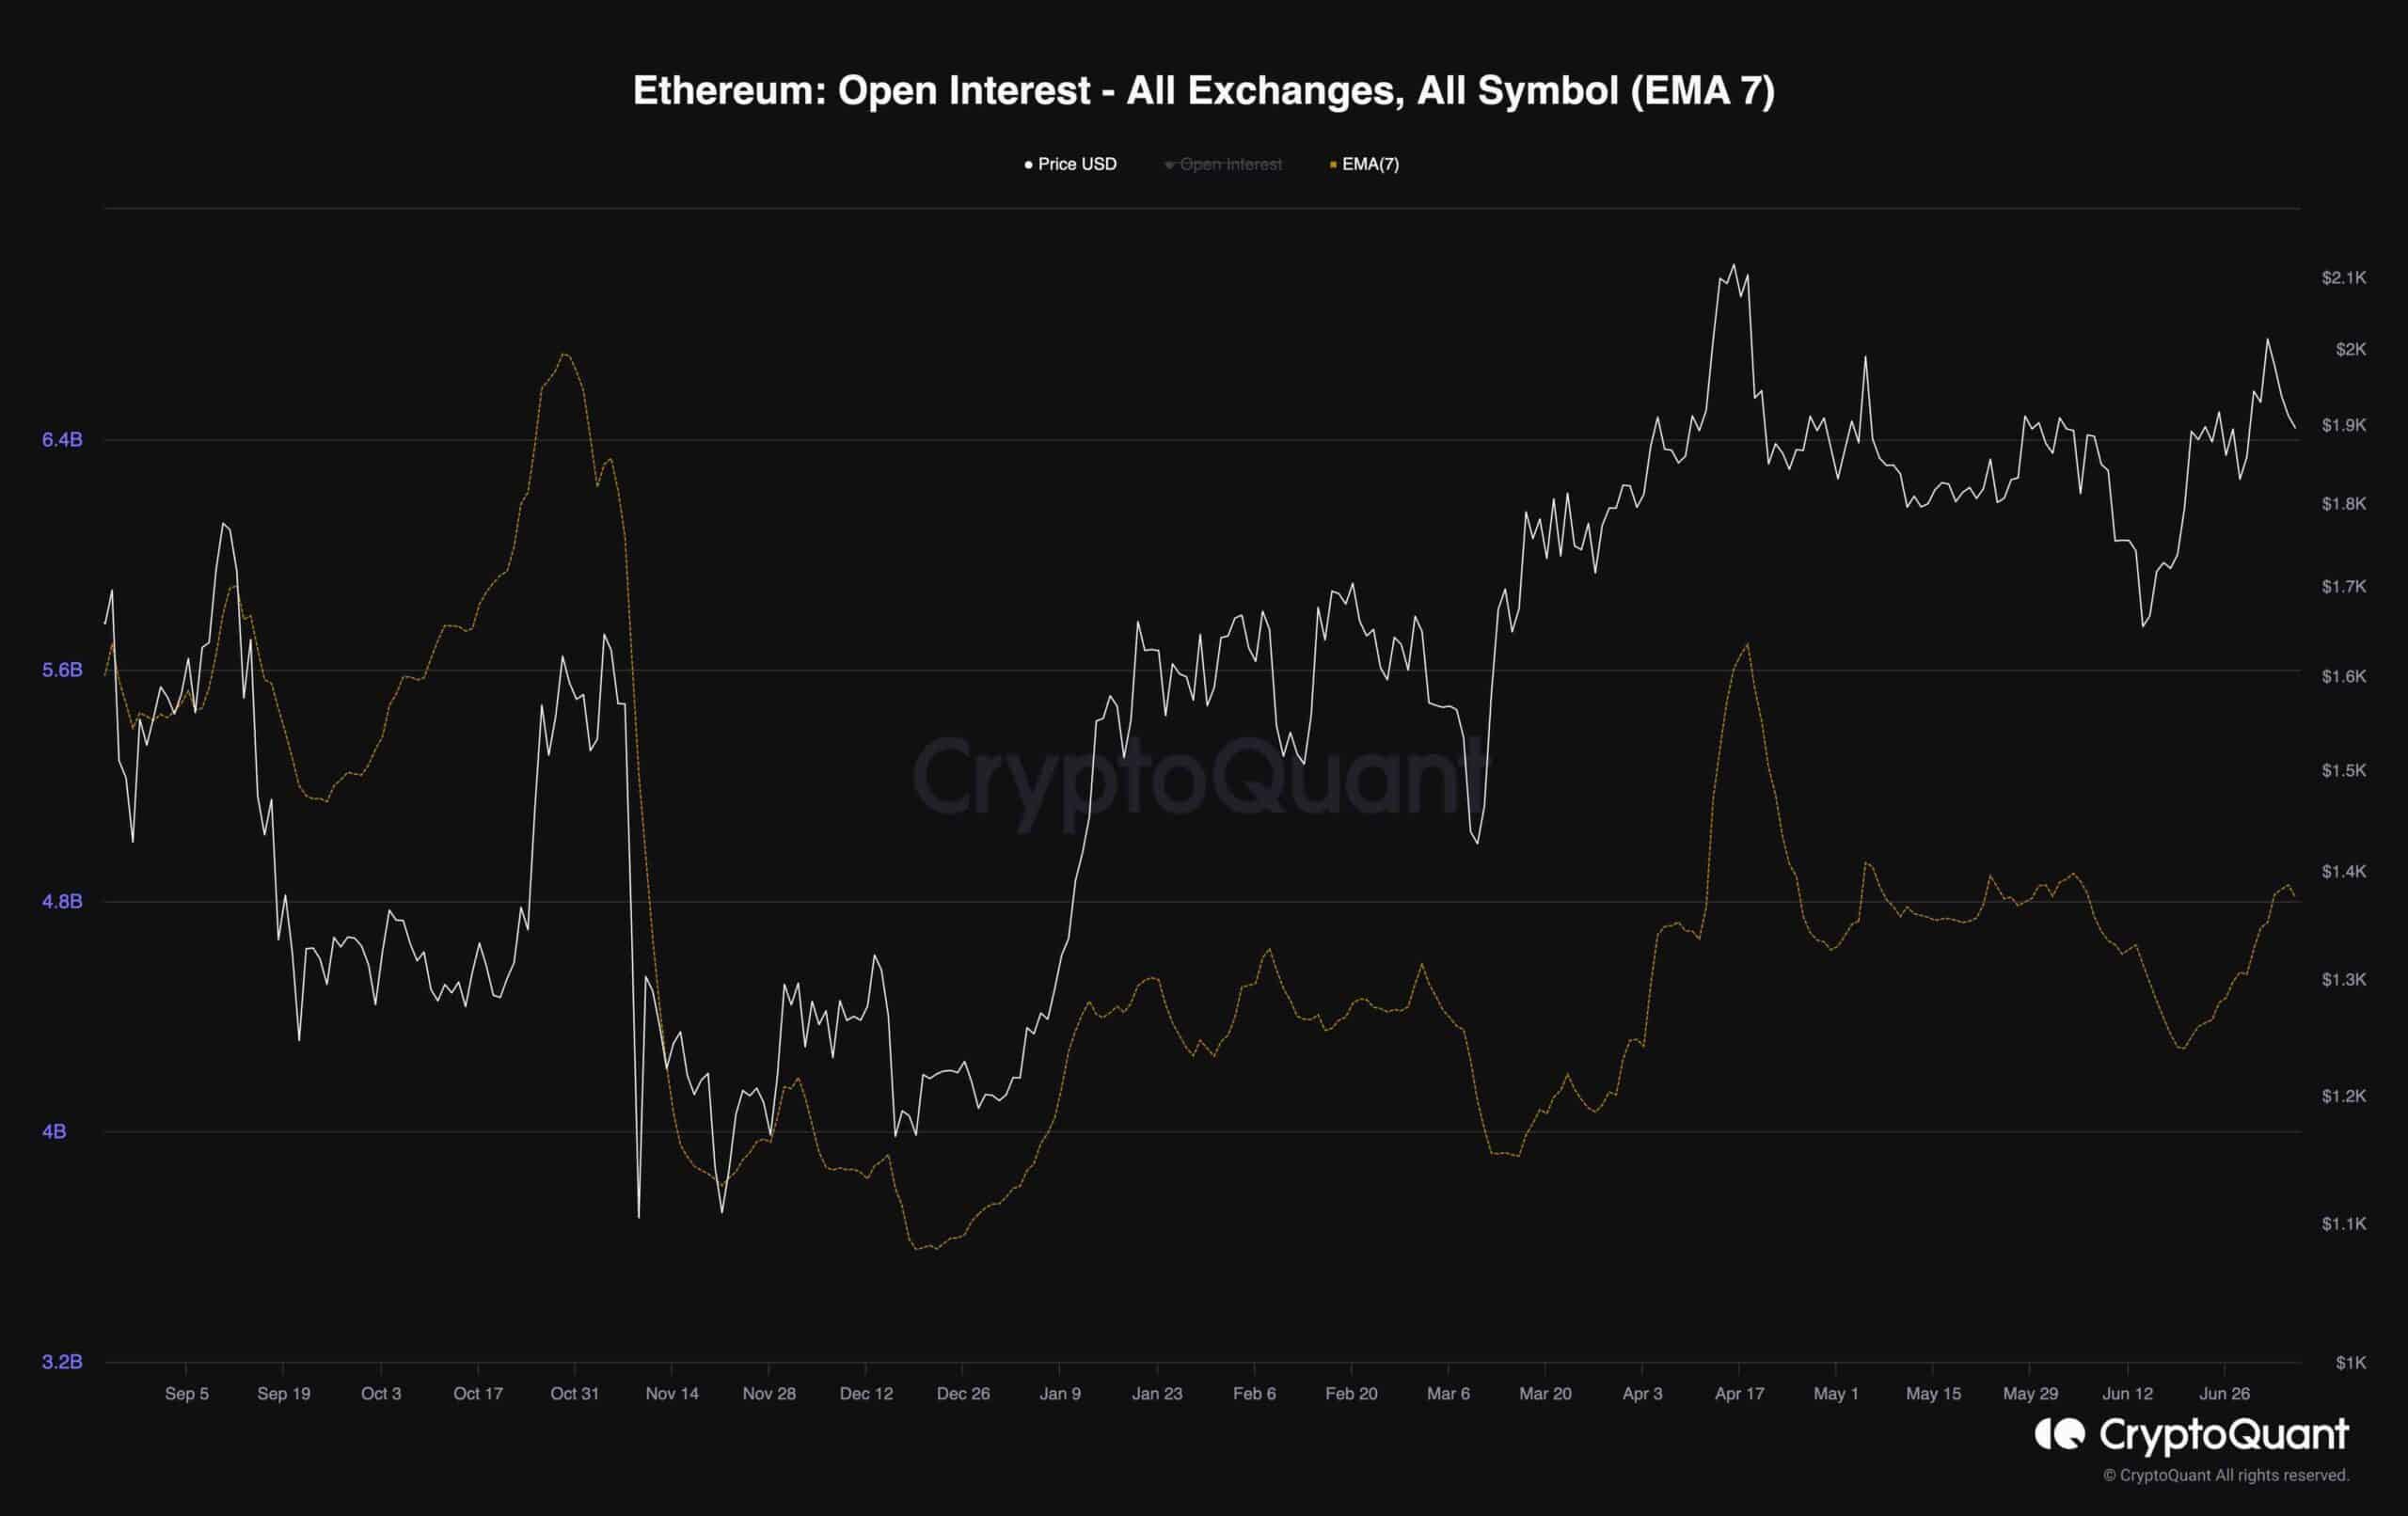
Ethereum’s price has recently undergone a significant upward movement following a period of consolidation. This upward momentum is likely to attract the attention of investors and traders, especially those involved in the perpetual futures market who engage in speculative trading.
The Open Interest Metric, which measures the number of active futures positions, has shown a slight increase and reached its two-month high. This suggests that there could be higher market volatility due to a greater possibility of both long and short positions being liquidated.
As a result, it seems reasonable to anticipate a continued upward trend in the medium term, as the futures market has not yet reached an overheated state. However, it is important to consider that this potential uptrend may also coincide with increased volatility characterized by sudden and significant price fluctuations.
It is worth noting that unforeseen events could disrupt the current scenario and impact the market dynamics. Therefore, it is essential to monitor any developments that may influence Ethereum’s price movement and market sentiment.
The post ETH Fails at $2K But WIll Bulls Attempt Another Push? (Ethereum Price Analysis) appeared first on CryptoPotato.