ETH Facing Critical Support at $1750, Will it Hold? (Ethereum Price Analysis)
Ethereum’s price has been violently breaking past resistance levels during the recent surge. However, for the long-term trend to be considered bullish, one obstacle still needs to be overcome.
Technical Analysis
By Edris
The Daily Chart
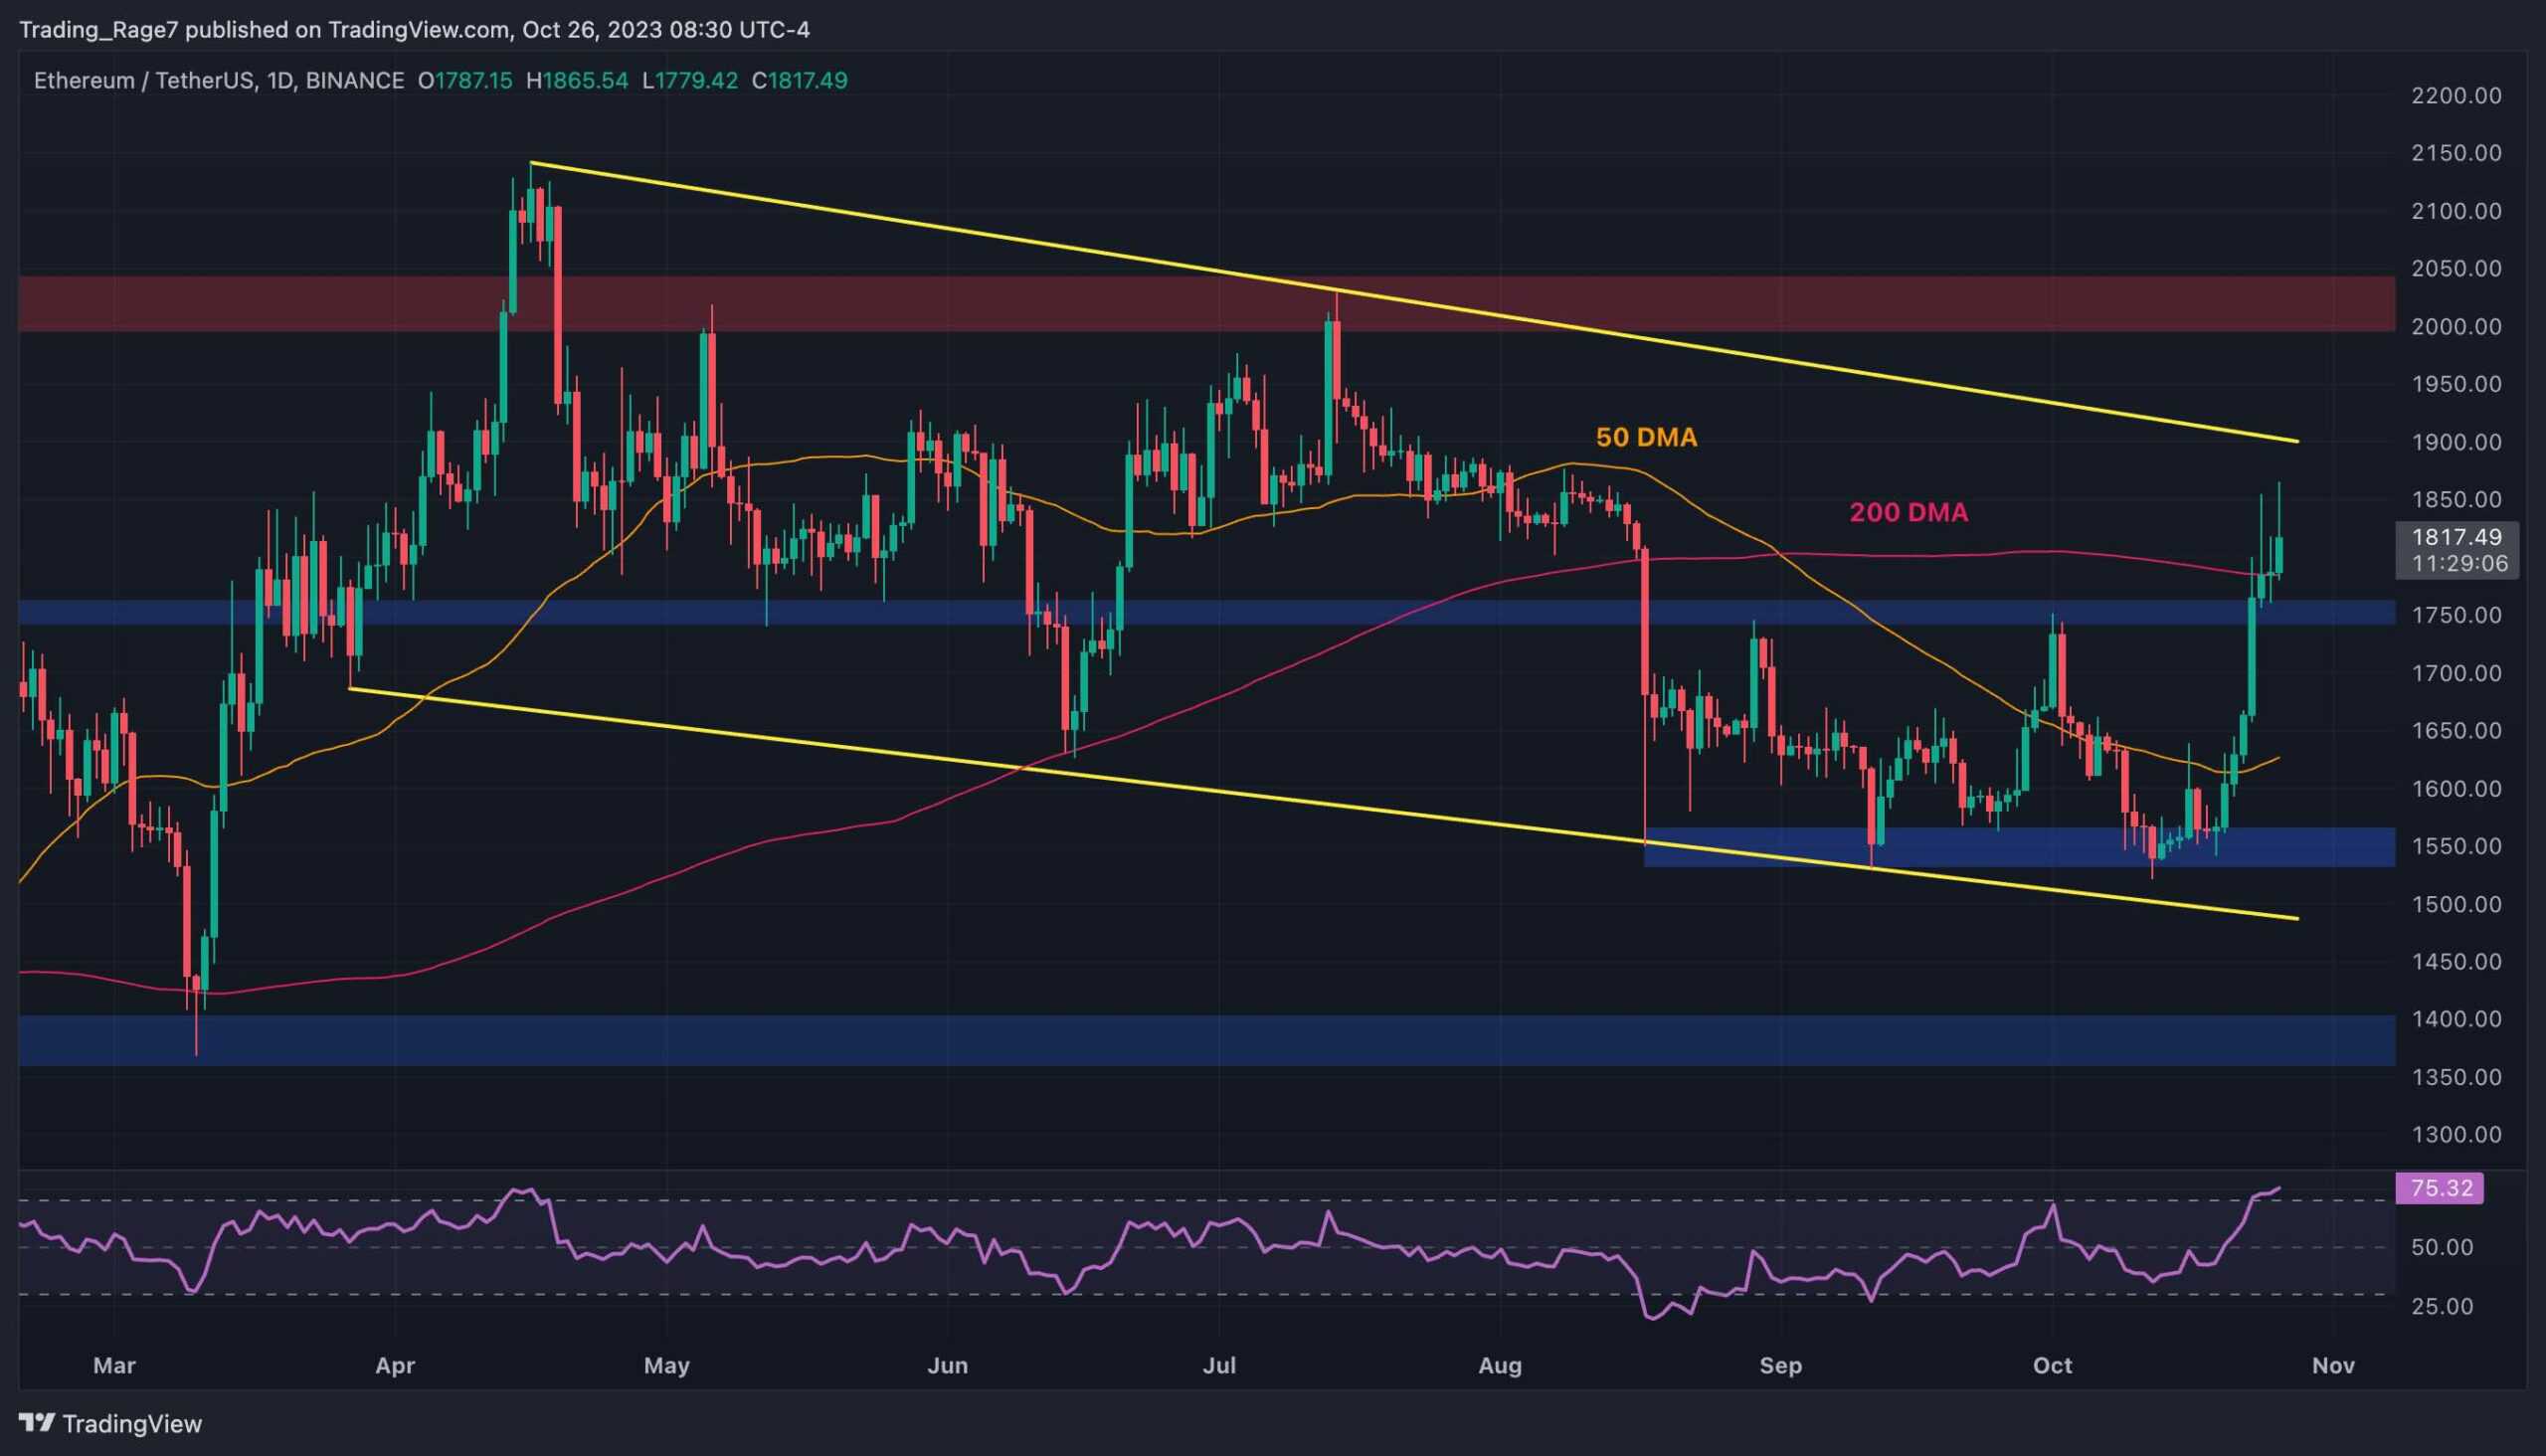
On the daily timeframe, the price has been steadily ascending since rebounding from the $1,550 support level and the lower boundary of the substantial descending channel. Notably, both the $1,750 level and the 200-day moving average, positioned around the $1,800 mark, have been decisively breached on the upside.
The market is presently on track to test the upper trendline of the channel, and should a bullish breakout occur, Ethereum is likely to trade above $2,000 once again in the near future.
The 4-Hour Chart
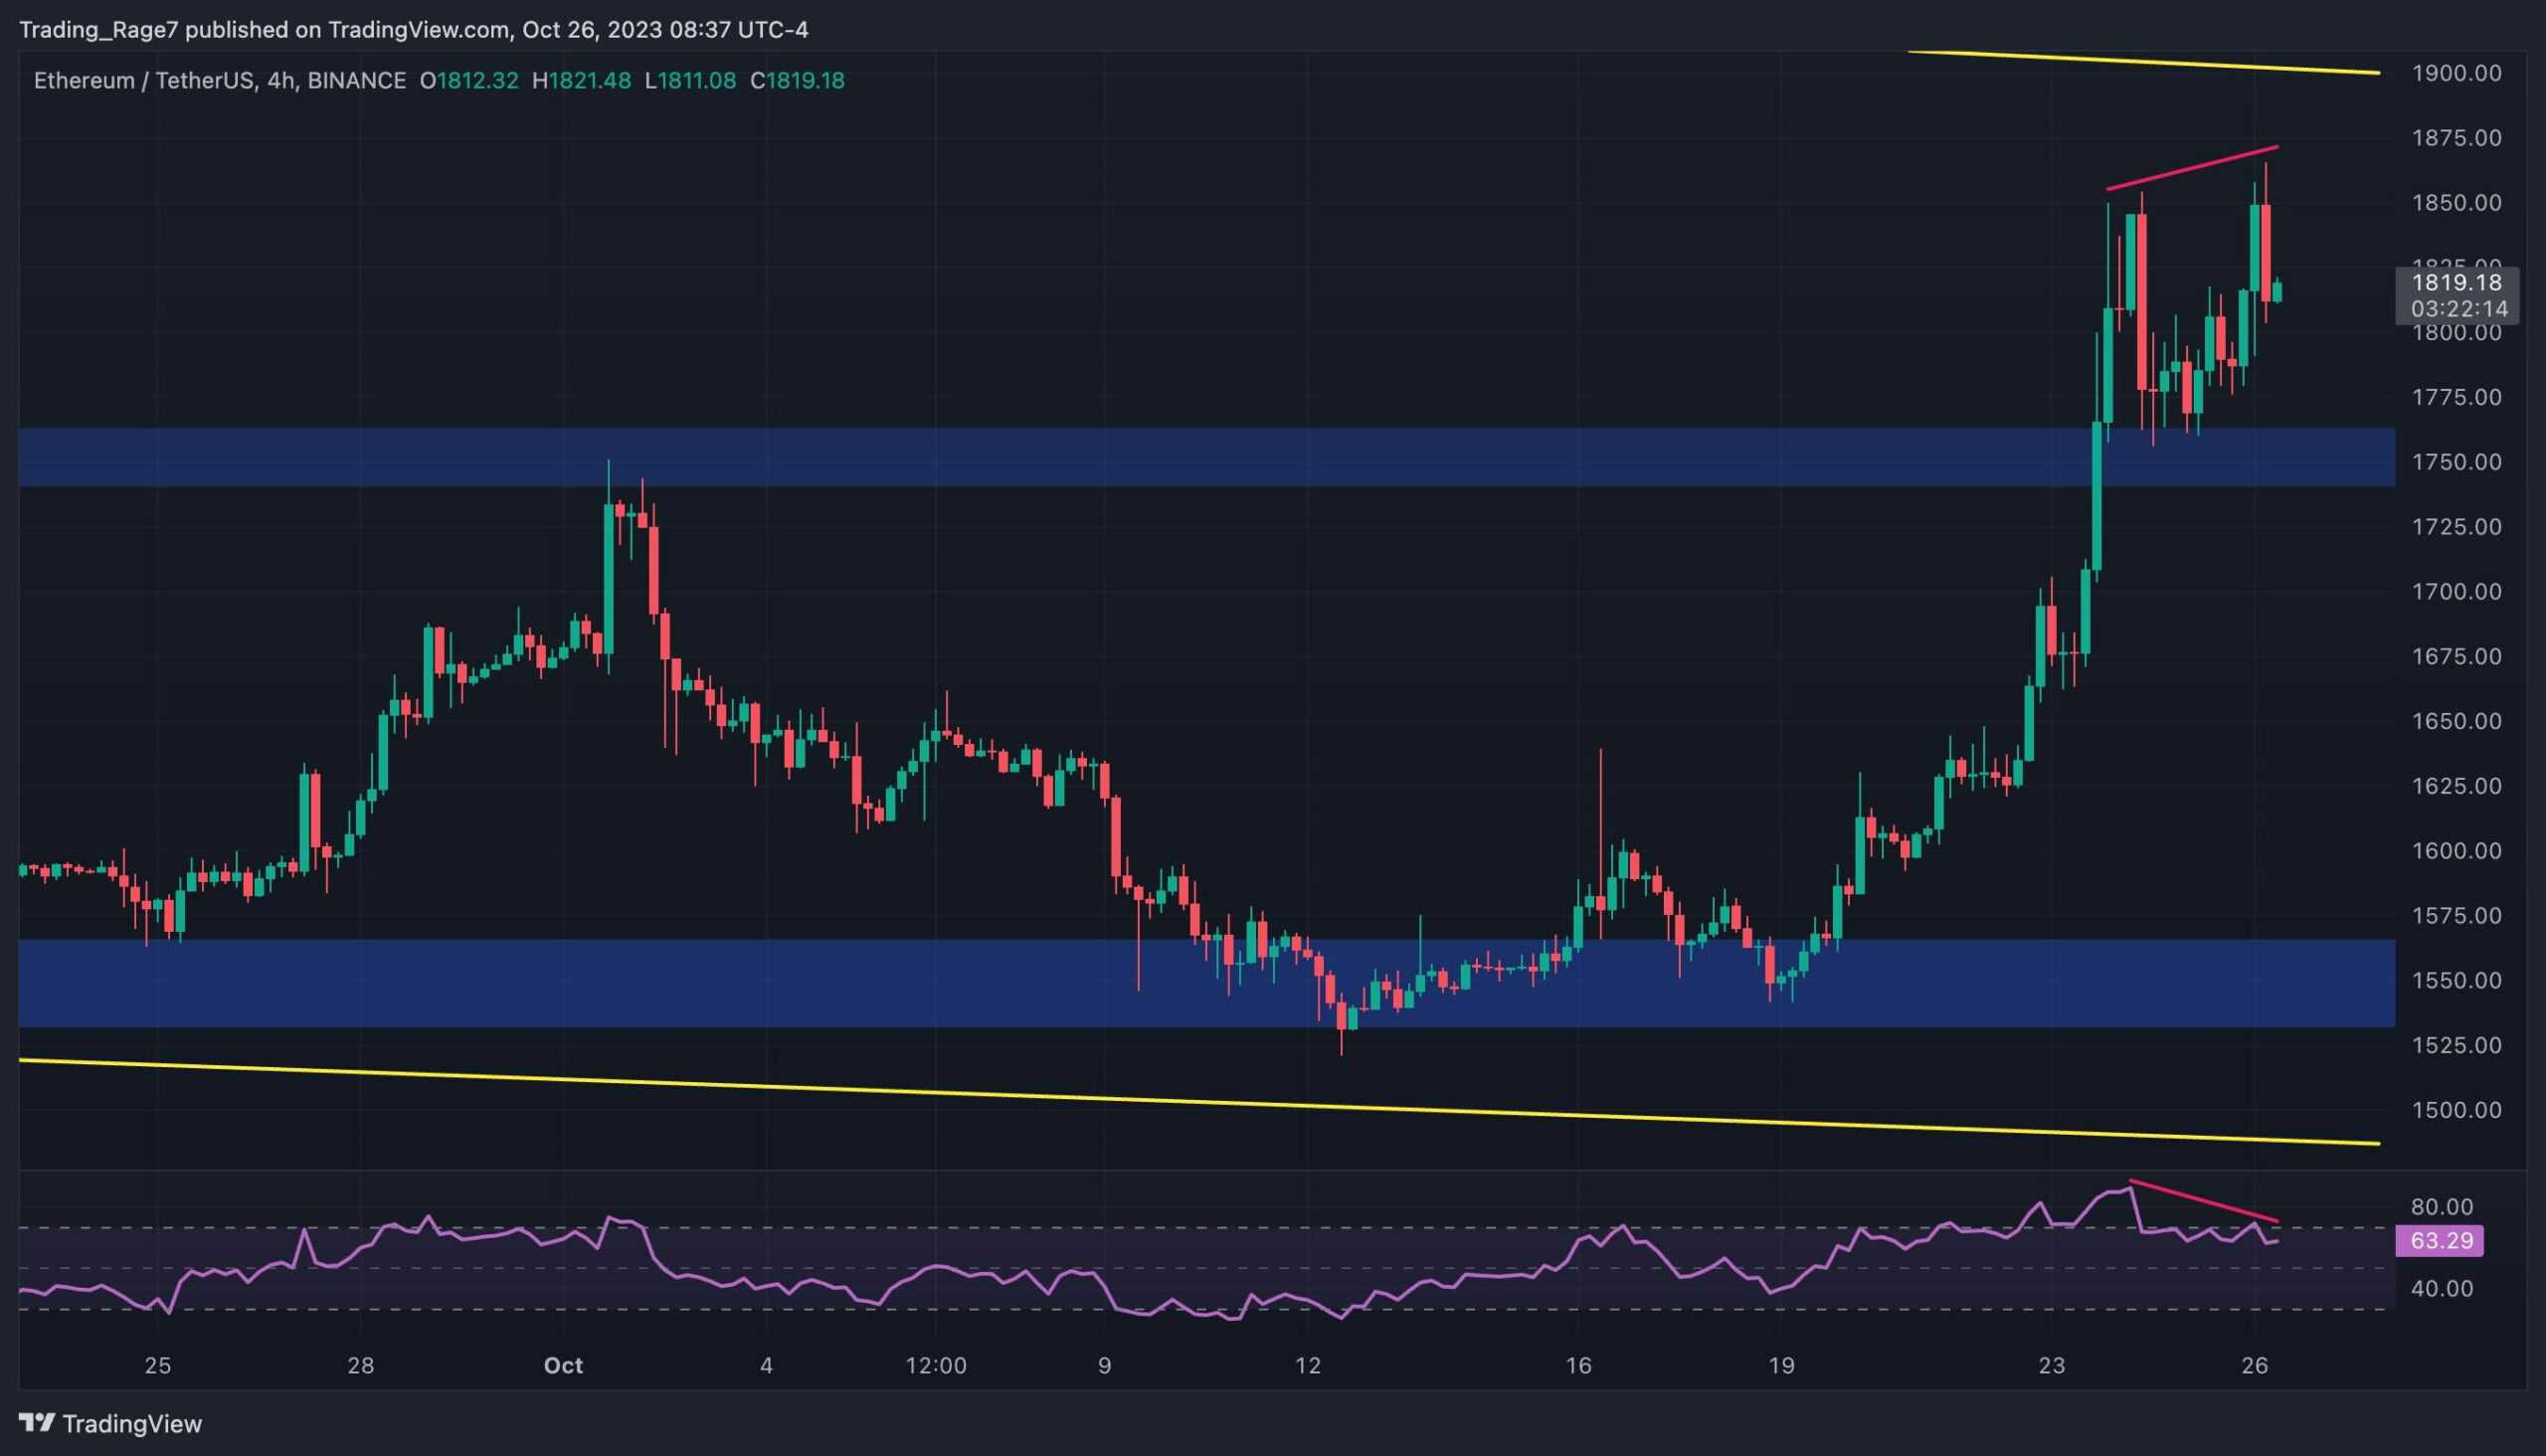
A closer examination of the 4-hour chart presents a more intricate scenario. While the price has managed to break and subsequently retest the $1,750 support level, it is encountering challenges in advancing further.
Given the current choppiness in PA and the overbought signal indicated by the relative strength index, the possibility of a retracement back to the $1,750 level or even lower cannot be discounted. After a relentless rally, the market may be due for a correction or consolidation phase.
Sentiment Analysis
By Edris
Funding Rates
Ethereum’s price has been rallying aggressively over the past few days, running toward the $2,000 key level. It is wise to analyze the futures market sentiment and determine whether this rally would be sustained.
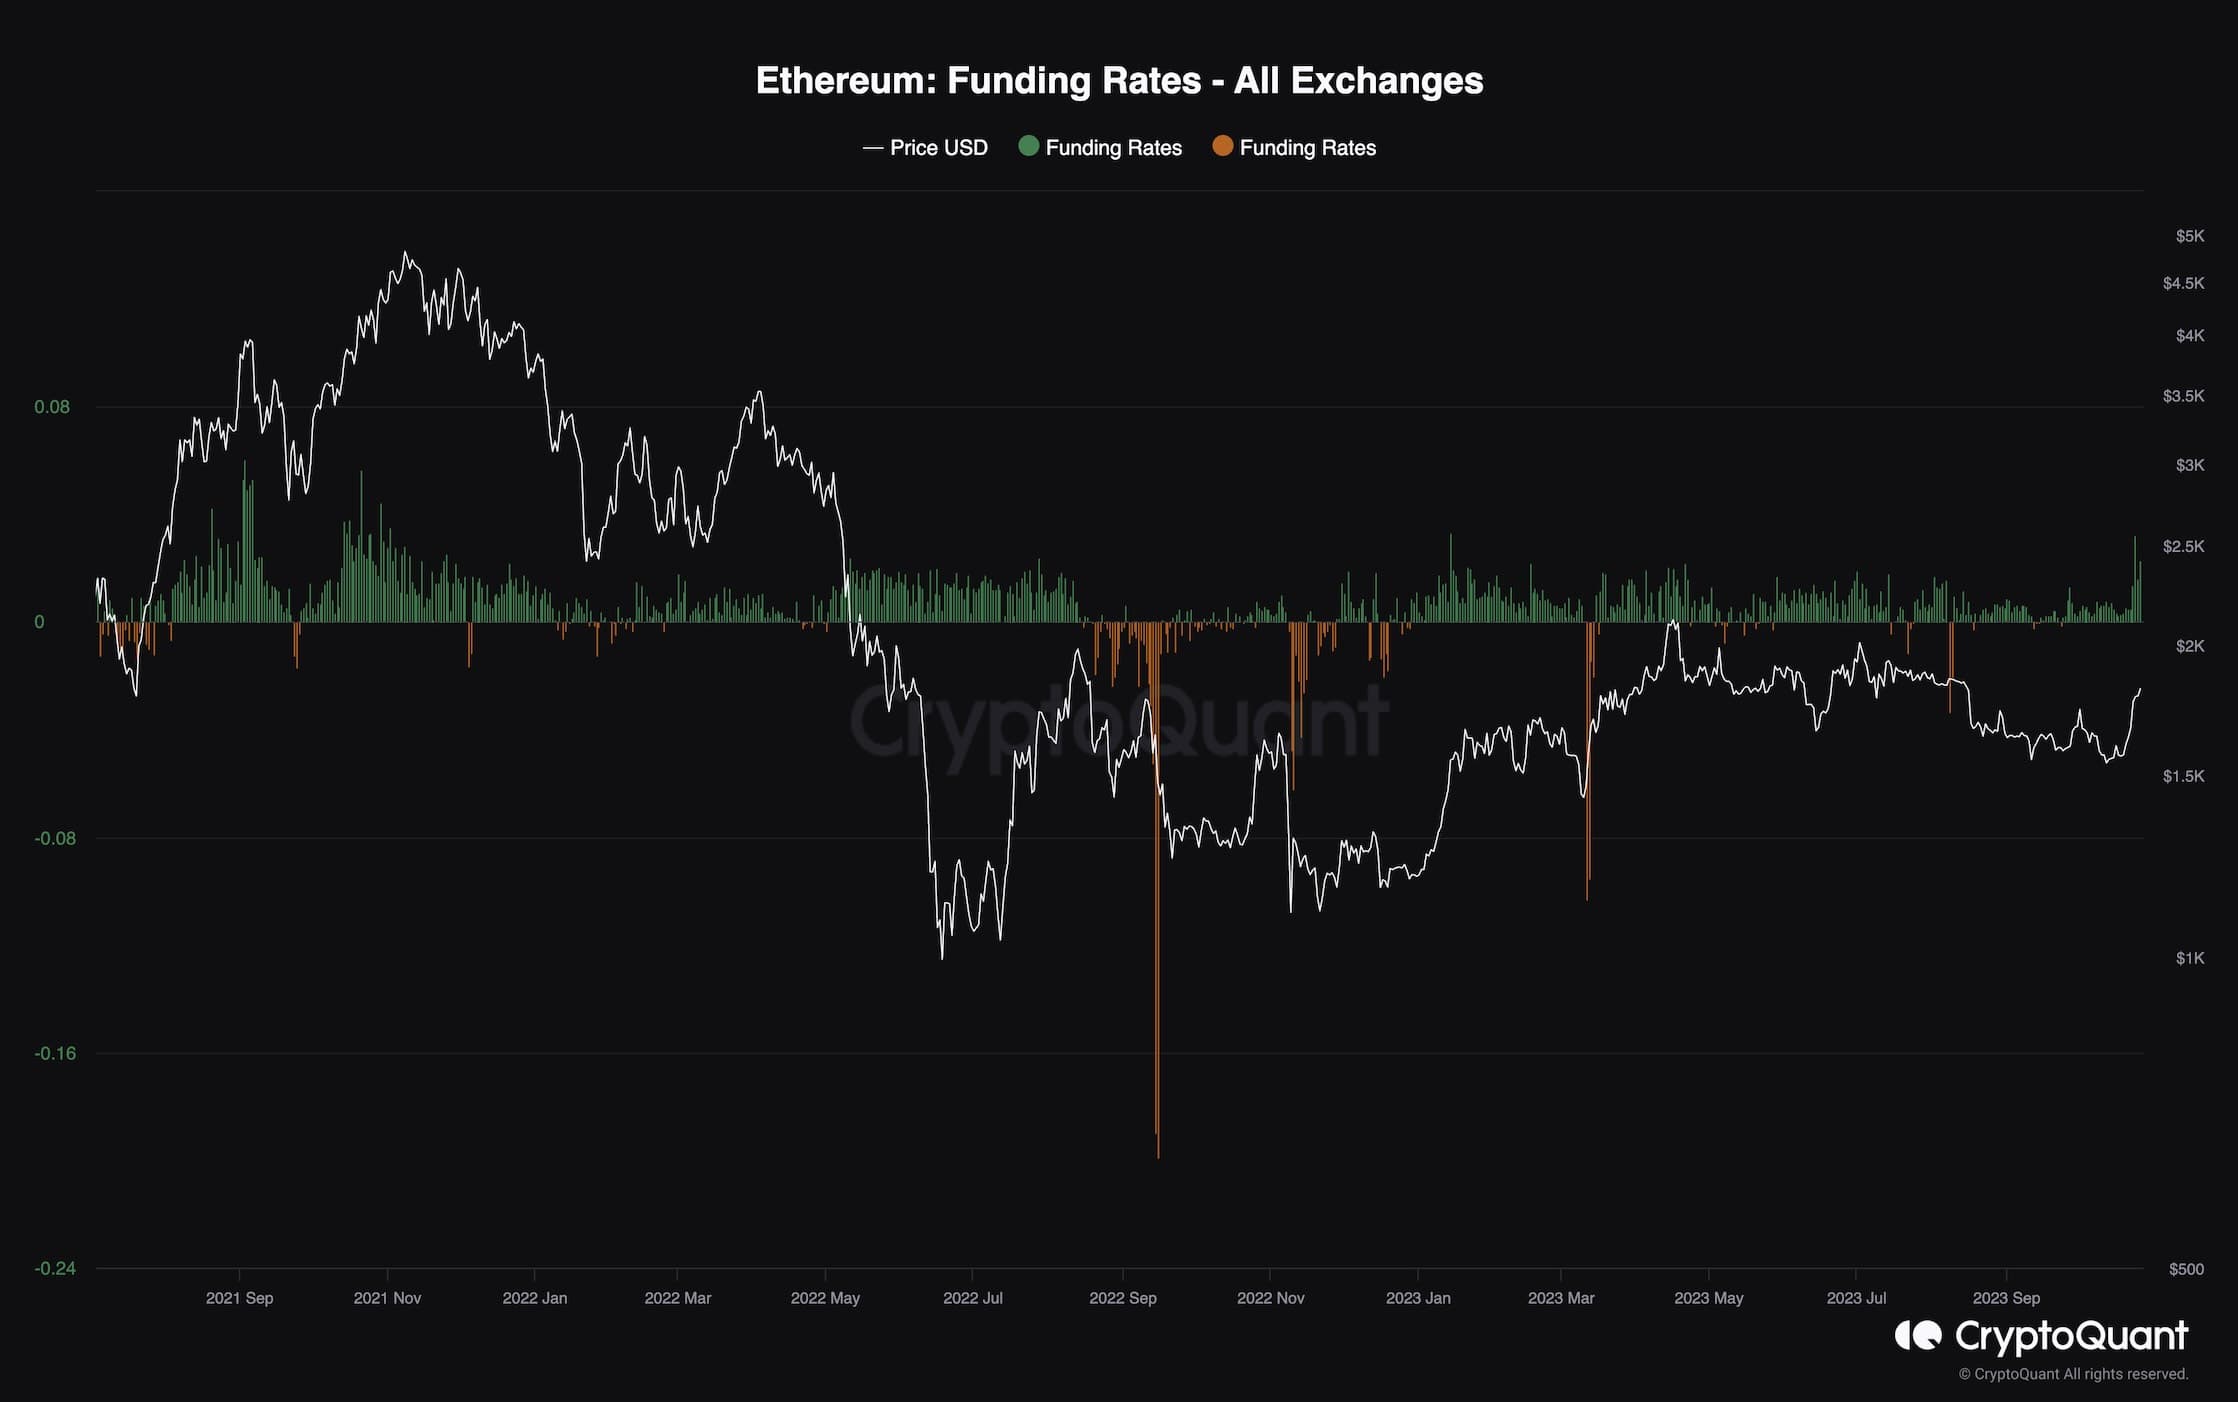
This chart represents the Ethereum funding rates, which is one of the most useful futures market sentiment indicators, determining whether the buyers or sellers are executing their orders more aggressively. Positive values show bullish sentiment, and conversely, negative values are associated with a bearish sentiment.
Evidently, the funding rates have been positive for some time now, which is positive as it shows traders are aggressively buying. However, the metric has spiked massively in recent days.
This can point to a probable correction or even a reversal as a result of a long liquidation cascade, which might begin in case of a small price pullback. Therefore, investors should be extremely careful and manage their risk, as a flash crash could be on the horizon.
The post ETH Facing Critical Support at $1750, Will it Hold? (Ethereum Price Analysis) appeared first on CryptoPotato.