ETH Enters 7-Day Consolidation but is a Huge Move Imminent? (Ethereum Price Analysis)
Following a period of correction, Ethereum’s price found support at a significant region comprising the 200-day moving average and the lower trendline of the flag pattern, located at $1.6K. As a result, the price initiated a slight bullish rally.
Technical Analysis
By Shayan
The Daily Chart
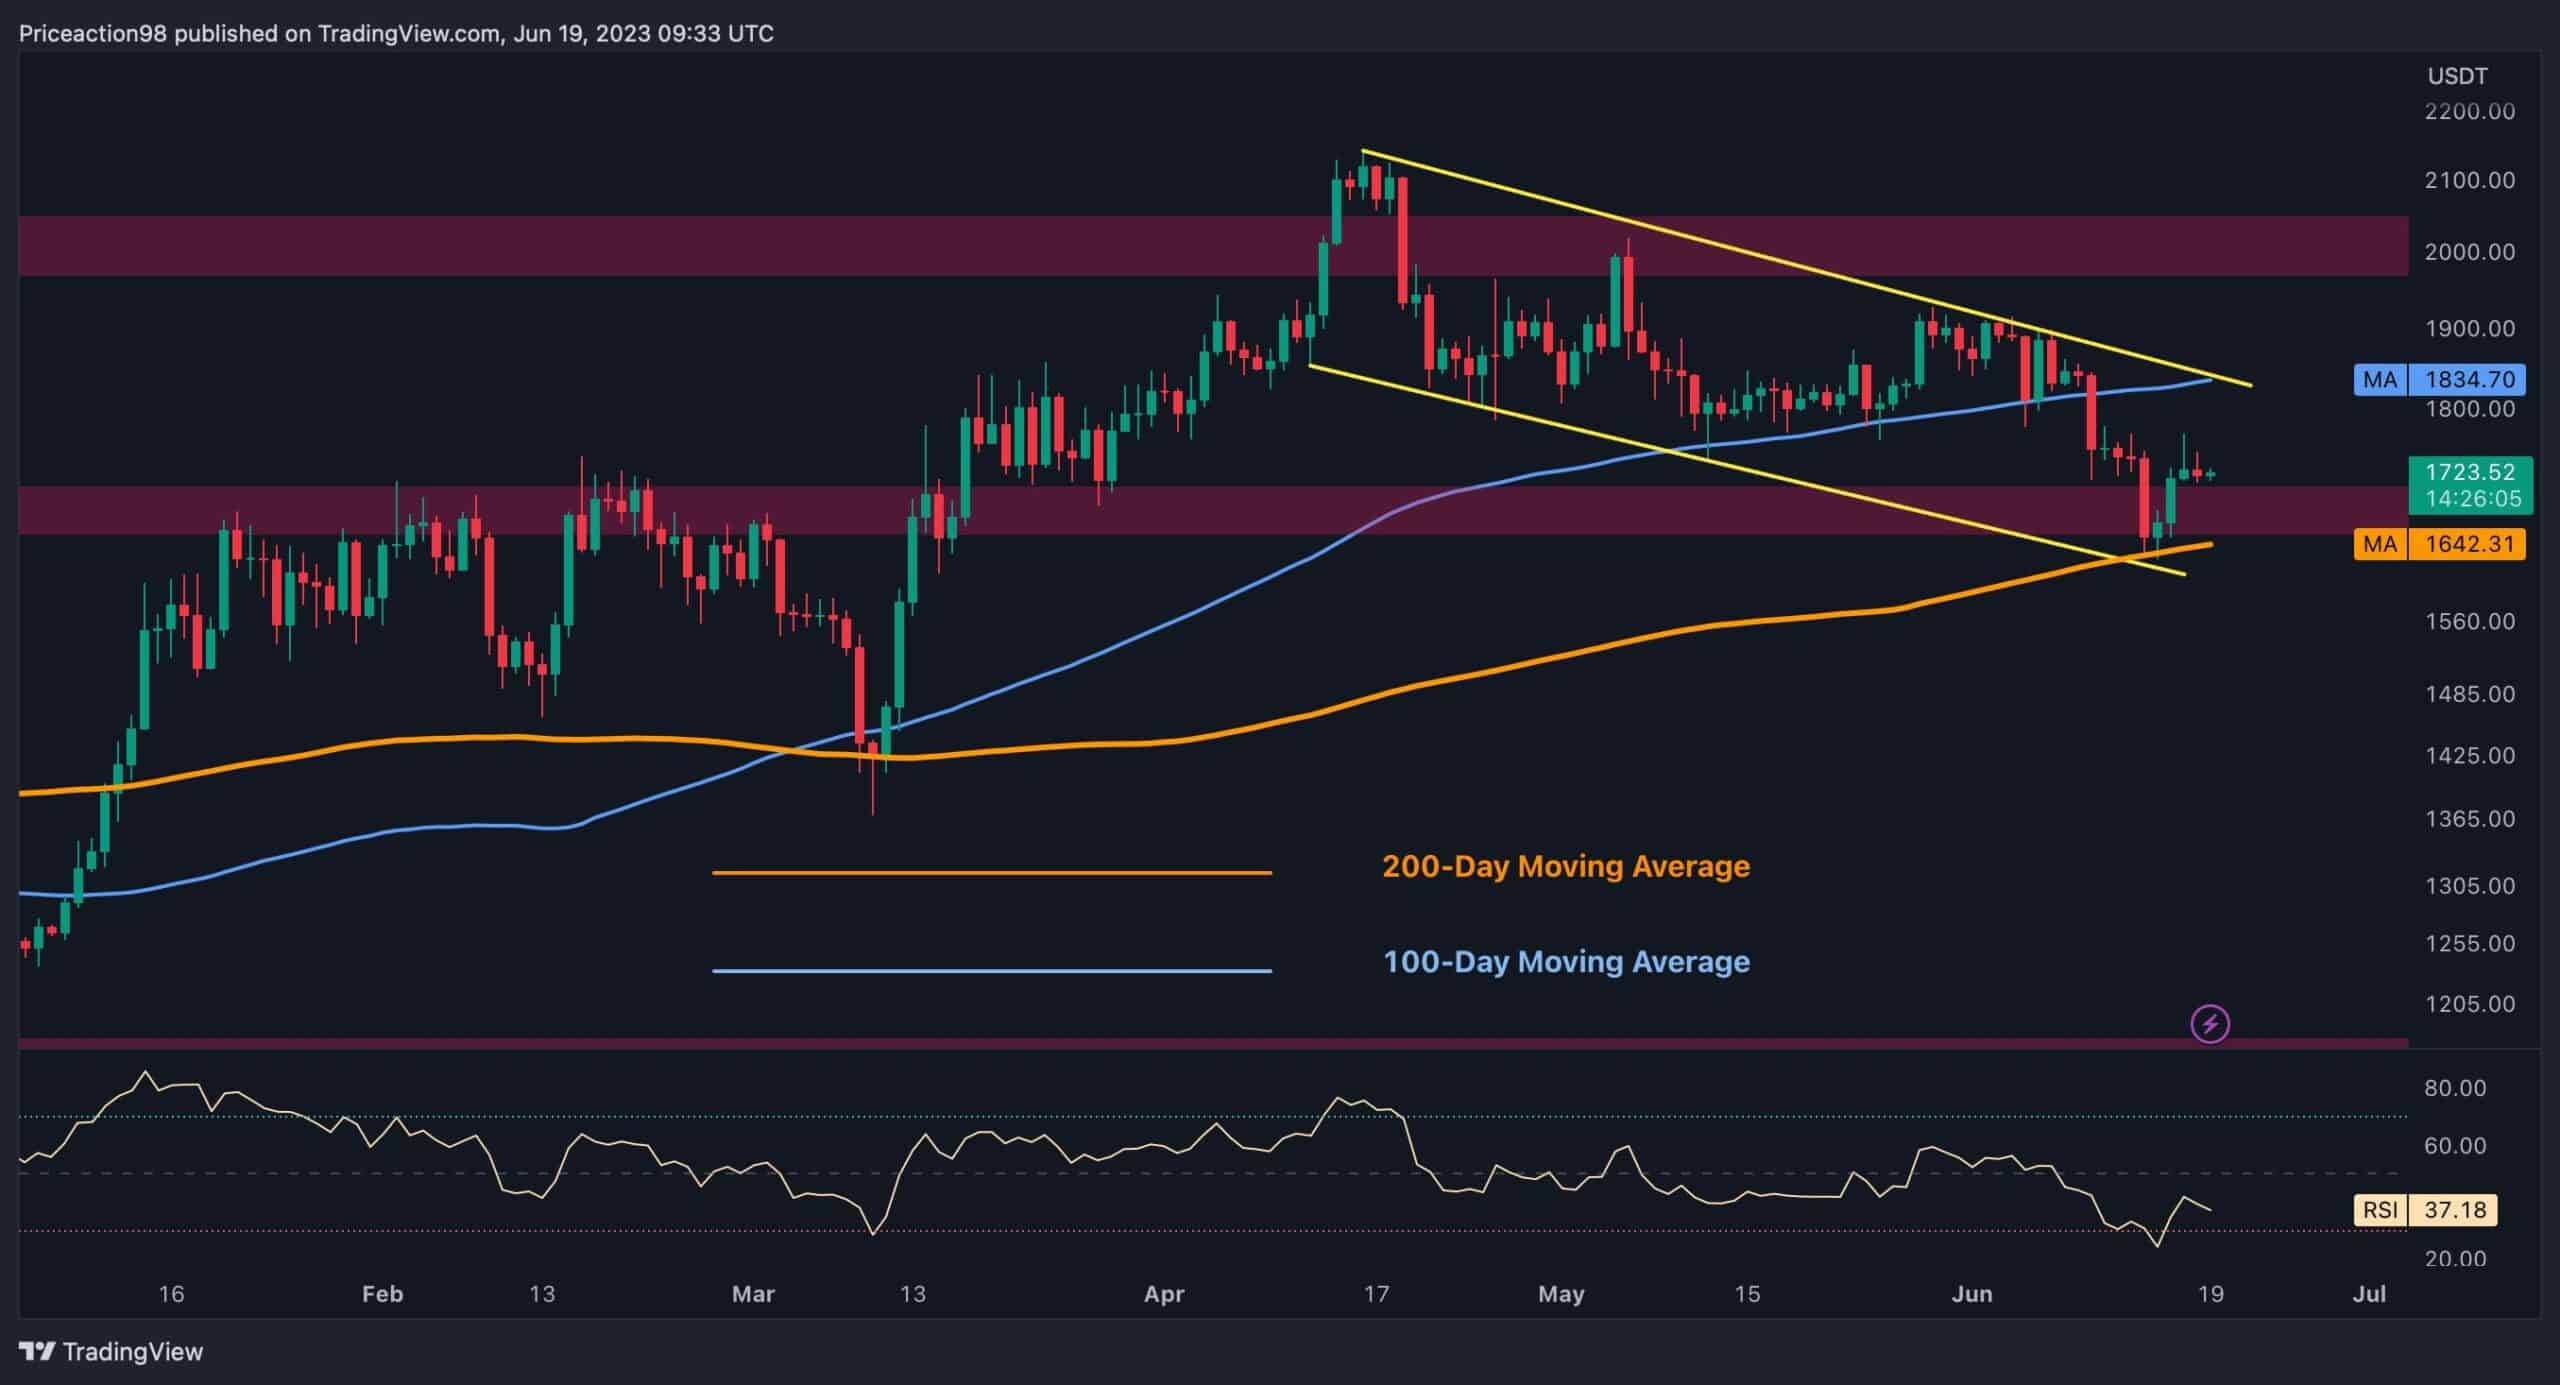
After an extended bearish phase, the price reached a notable support region encompassing the 200-day moving average and the lower boundary of the flag pattern. This zone serves as robust support, as it also aligns with the static support level of $1.6K, indicating substantial buying pressure.
Consequently, this buying pressure led to the formation of a bullish rally. However, the positive momentum weakened upon reaching the previous minor swing on the daily chart, resulting in decreased volatility and the development of very small candles.
Nonetheless, if the bullish rally continues, Ethereum’s next target will be the 100-day moving average and the upper trendline of the flag pattern, positioned at $1834.
The 4-Hour Chart
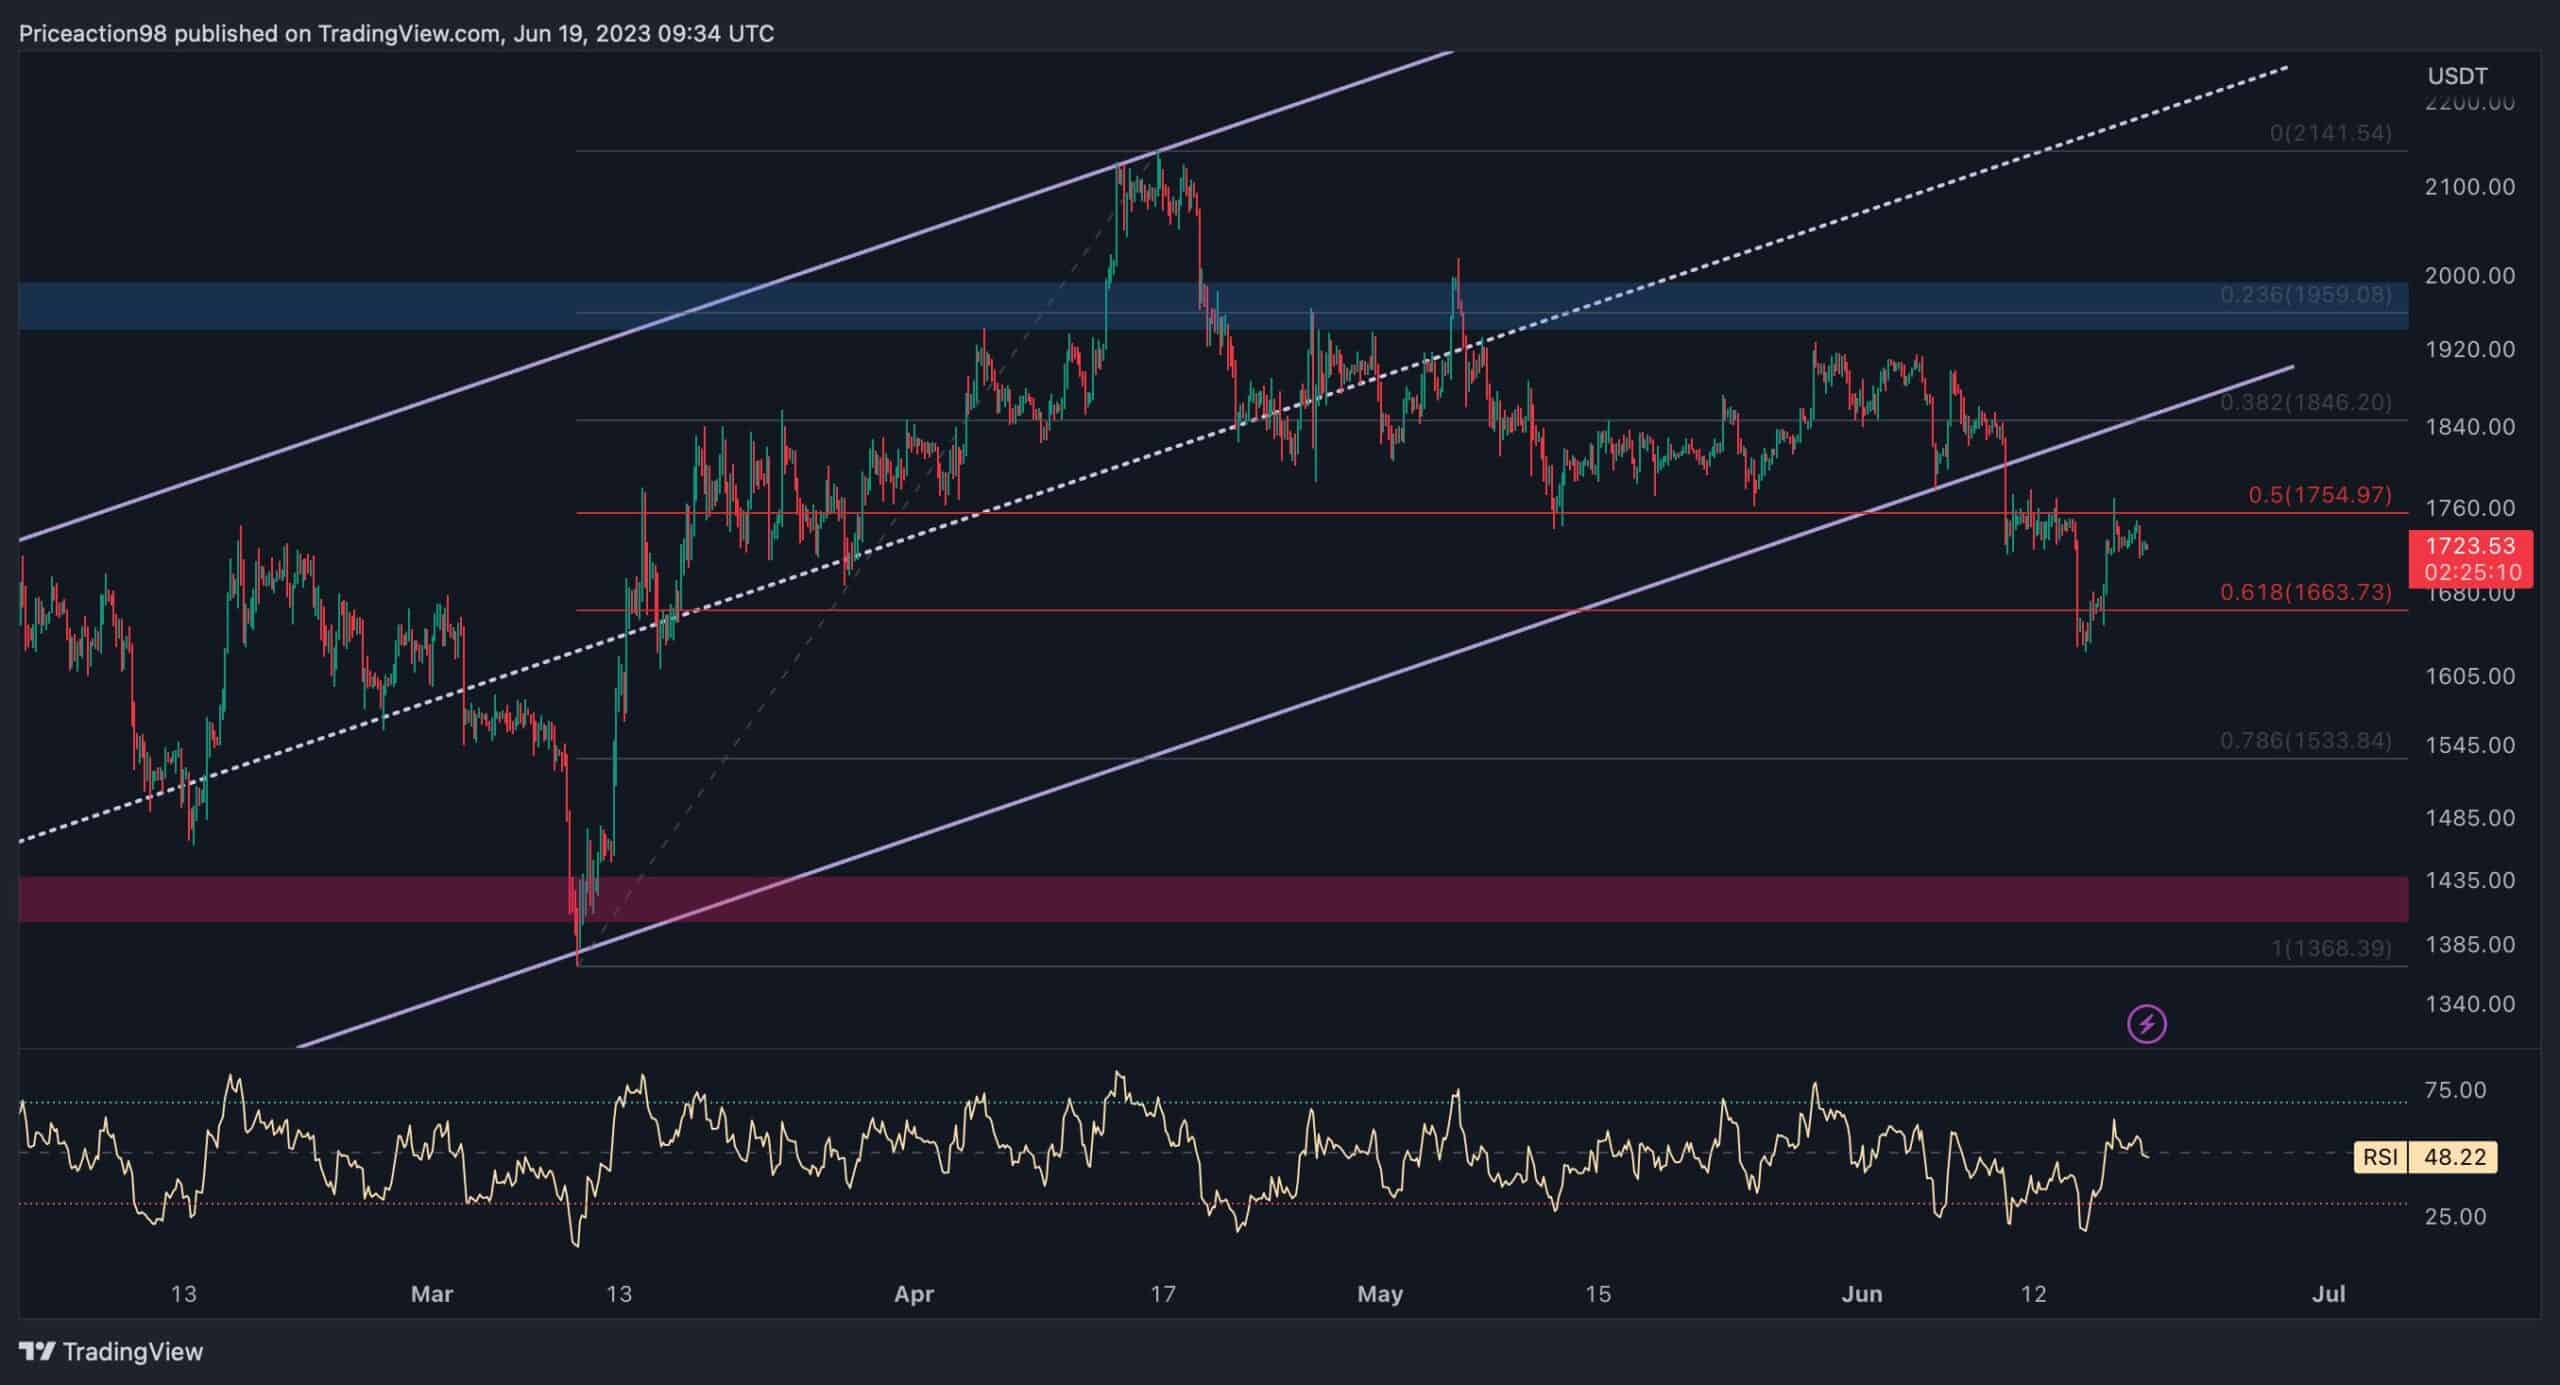
On to the 4-hour chart, after breaking below the lower trendline of the extended ascending channel, the selling pressure remained high, causing the price to continue plummeting.
Nevertheless, after a few days of red candles, ETH reached the crucial Fibonacci level of 61.8%, representing the initial target for the correction legs during the bullish rally that originated from $1368 and persisted until encountering significant resistance at $2.1K.
However, it is worth noting that the recent rebound could be a retracement toward the broken level. Ultimately, Ethereum’s next move will be determined by future price action.
On-chain Analysis
By Shayan
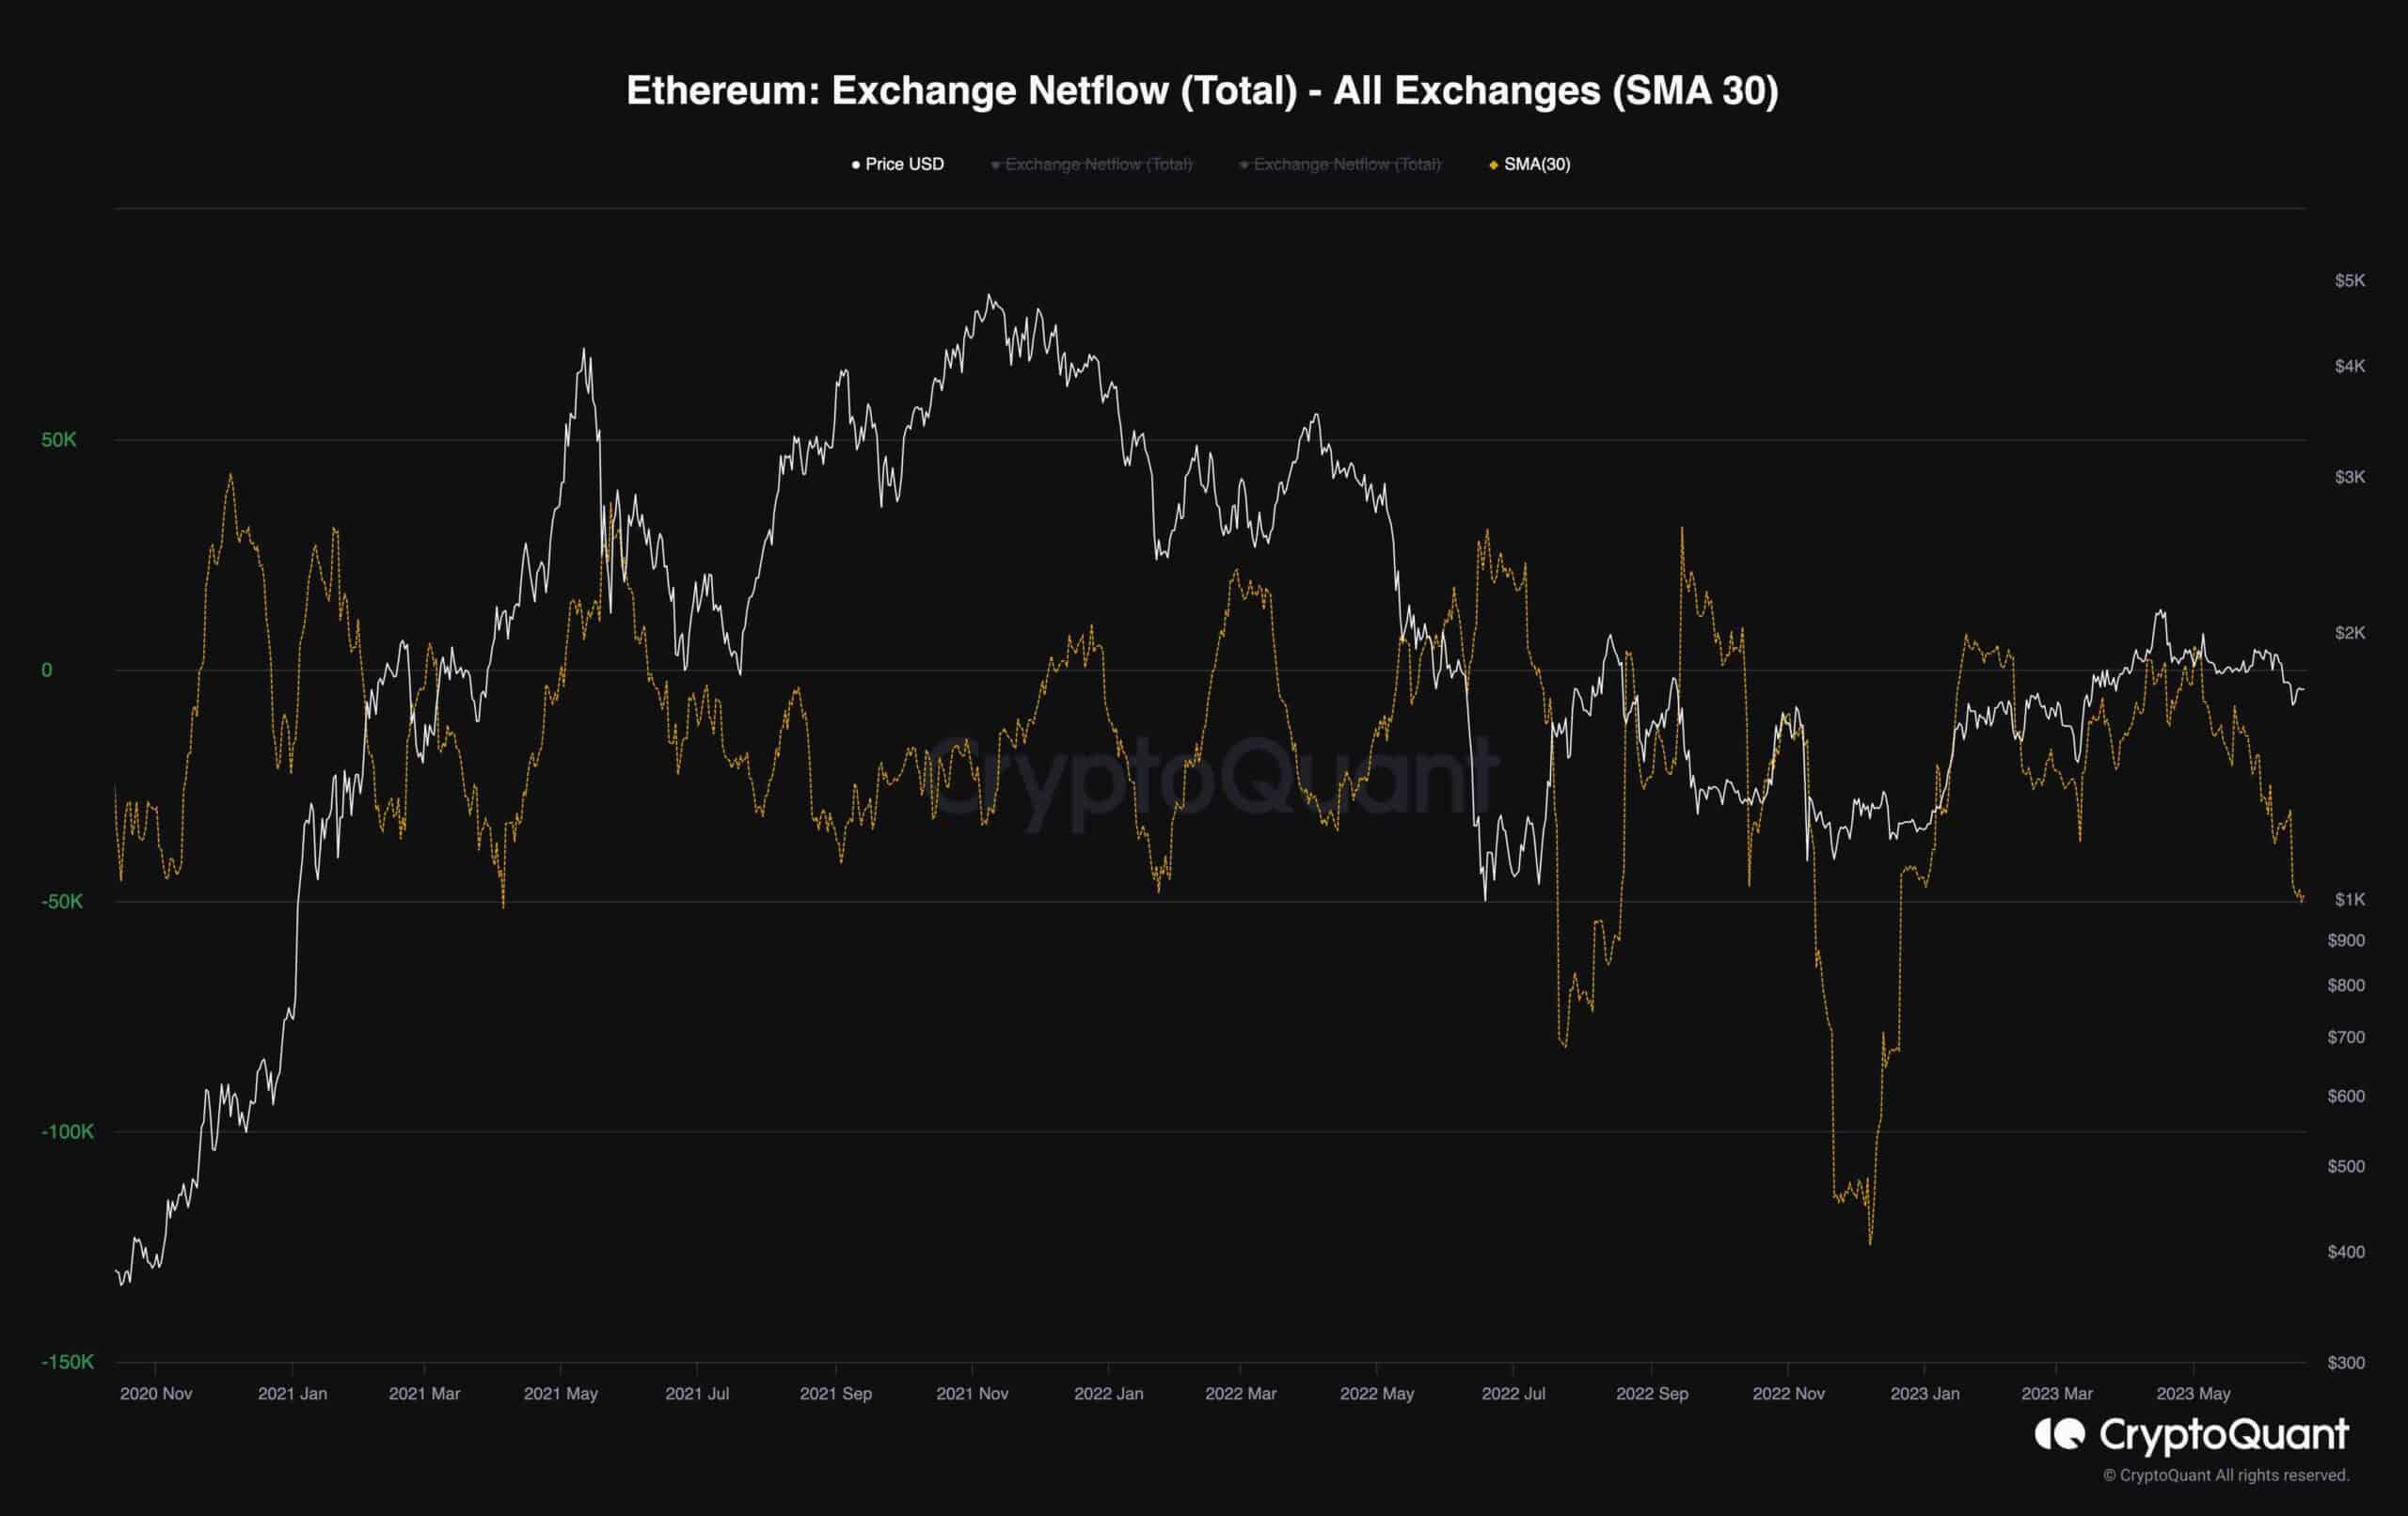
The following chart illustrates the relationship between Ethereum’s Exchange Netflow metric and its price. After encountering resistance at the $2.1K level, Ethereum’s price entered a prolonged consolidation correction phase, leading to a 24% correction. As depicted in the chart, the Netflow metric exhibited a downtrend during this market condition, ultimately plummeting below 0.
However, the recent lawsuit involving Binance, Coinbase, and the SEC acted as a catalyst for the bearish trend in the market, prompting participants to withdraw their assets from these exchanges. Consequently, the Netflow metric experienced a further impulsive decline, indicating the prevailing fear within the market.
Nevertheless, it is important to note that a robust and sustainable bullish rally should not be anticipated until the fear and uncertainty vanish from the market and sufficient demand returns.
The post ETH Enters 7-Day Consolidation but is a Huge Move Imminent? (Ethereum Price Analysis) appeared first on CryptoPotato.