ETH Bulls Aimed at $2K Following 4.6% Weekly Increase: Ethereum Price Analysis
Technical Analysis
By TradingRage
Ethereum’s price has been rising rapidly following a rebound from the $1,550 support level. While it is yet to reach the key $2,000 level, specific clues on the chart suggest that it is only a matter of time before it does.
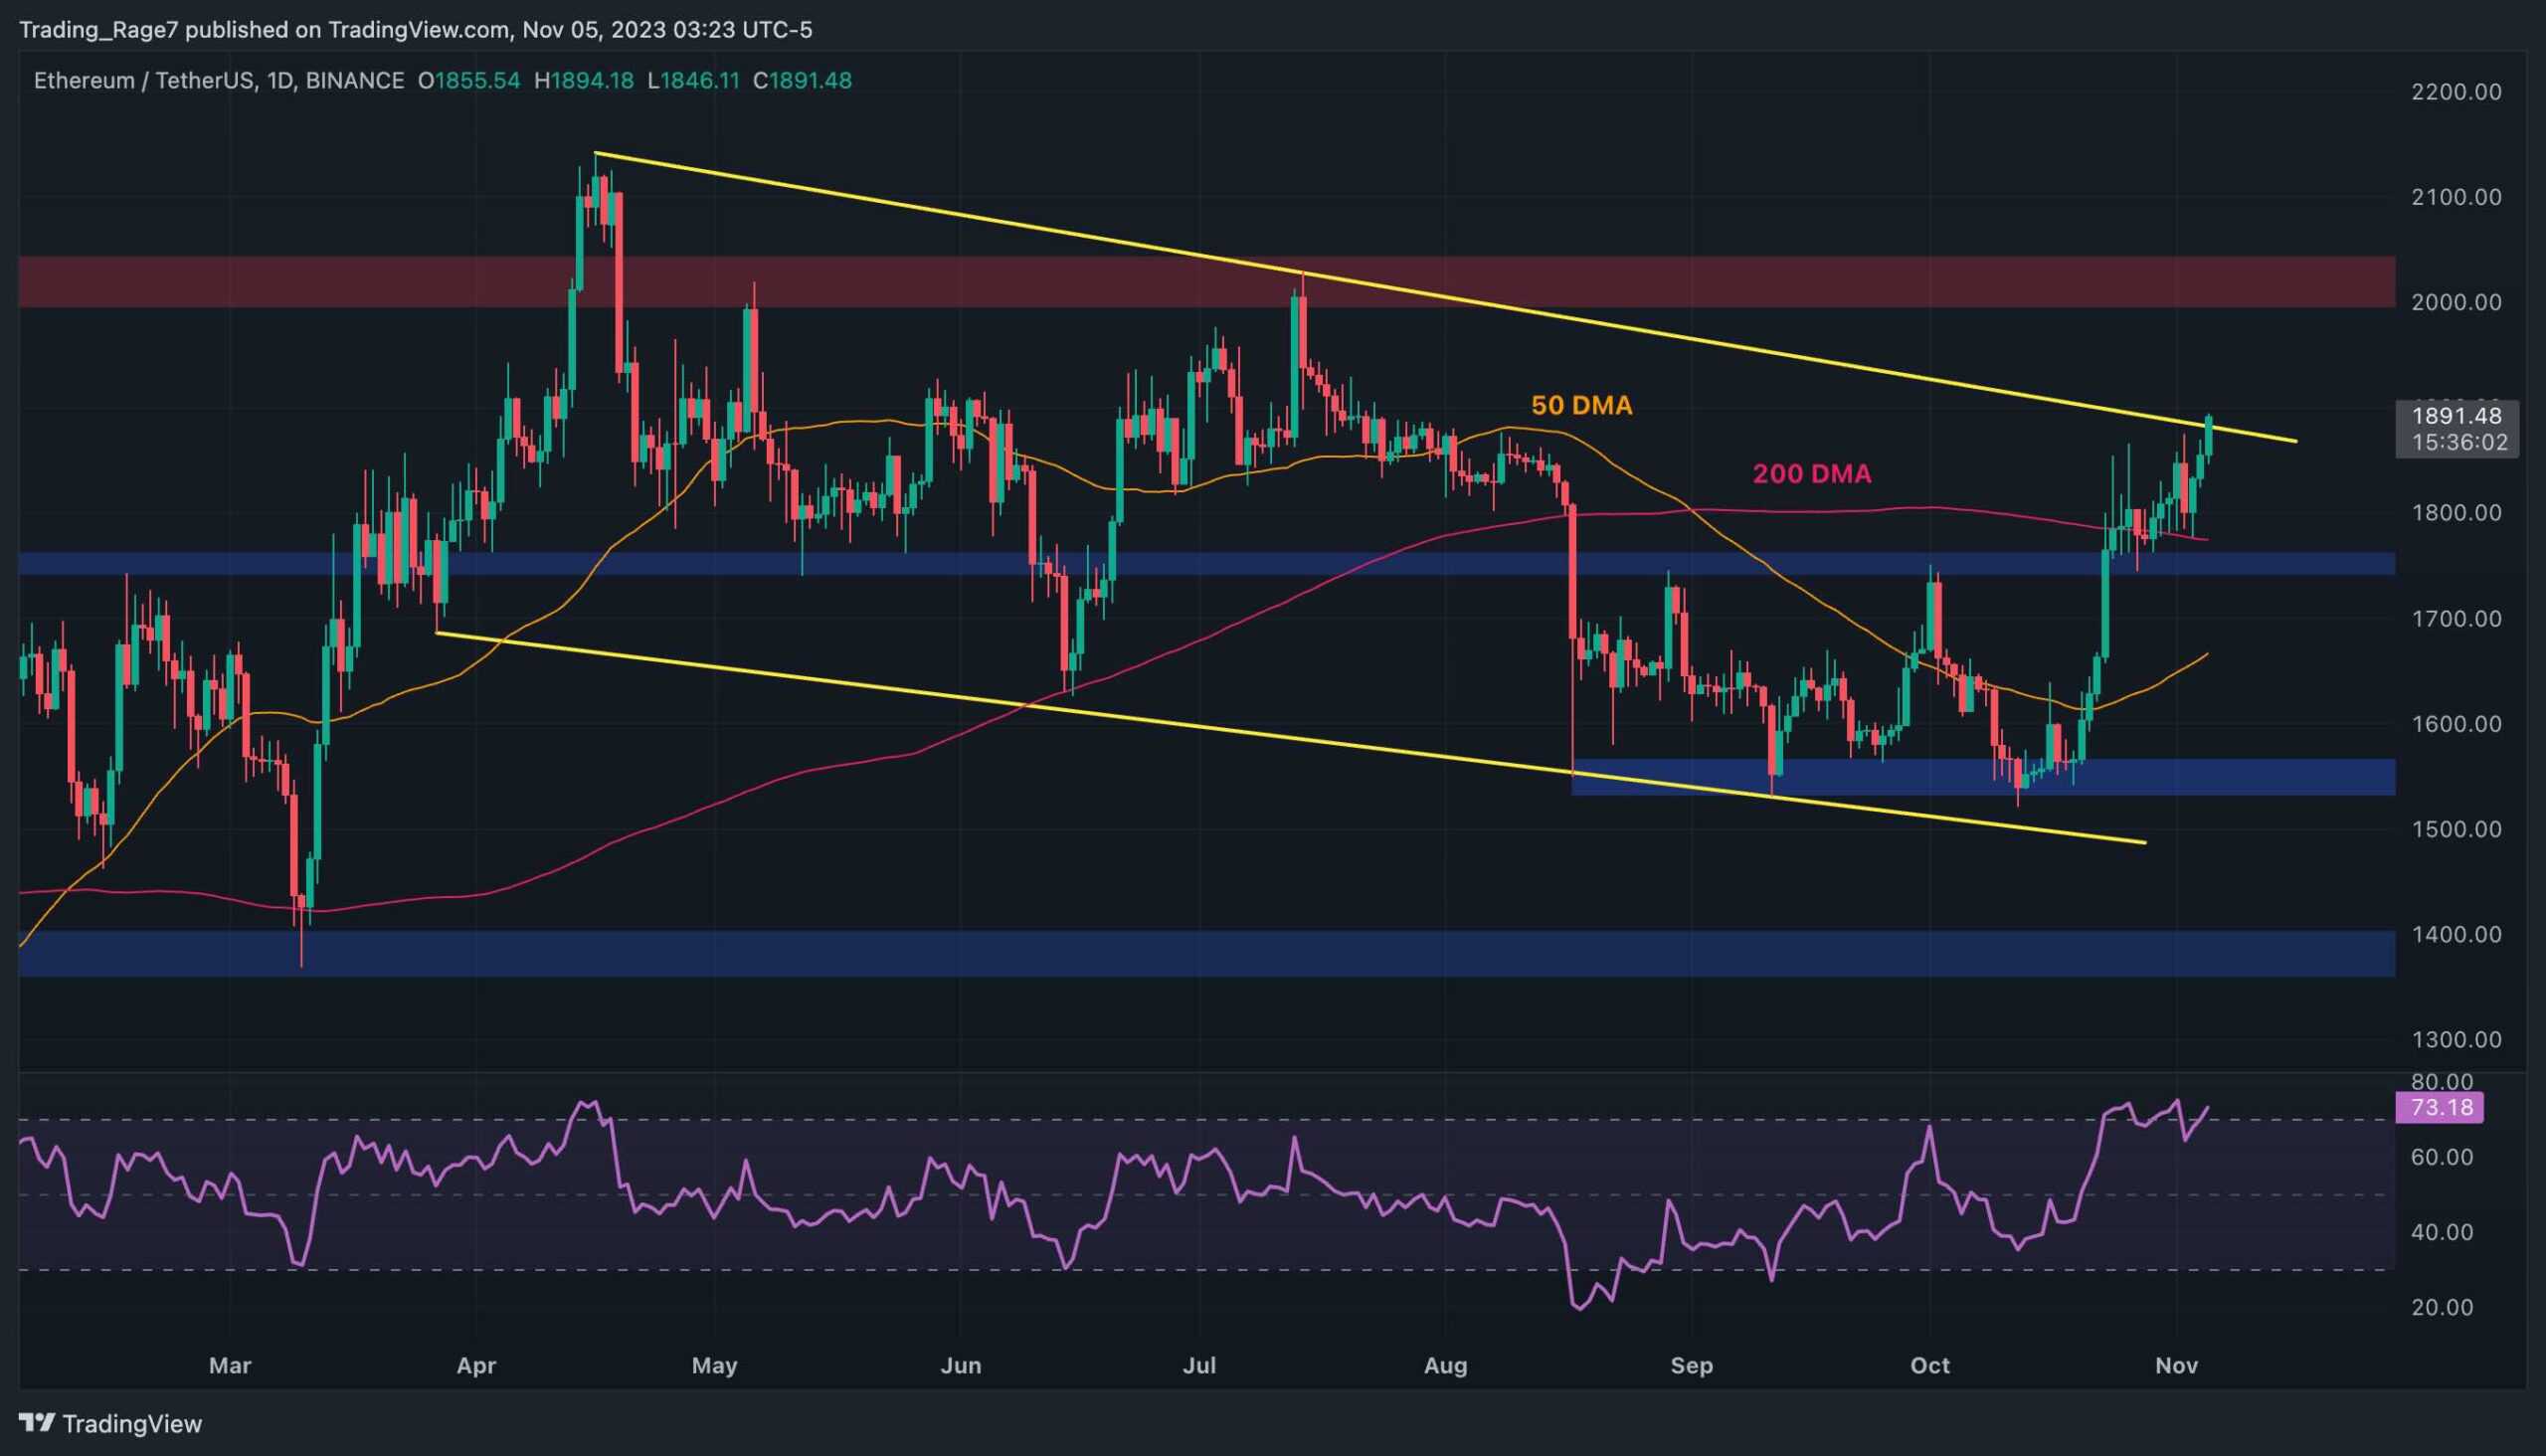
The Daily Chart
On the daily chart, both the 50-day and the 200-day moving averages, located around the $1,700 and $1,800 marks, respectively, have been broken to the upside.
The market is currently piercing through the large descending channel, a pattern that points to a potential test and breakout above the $2,000 level soon. The Relative Strengths Index, however, demonstrates a clear overbought signal, which is a subtle hint that a correction or consolidation might occur before further continuation.
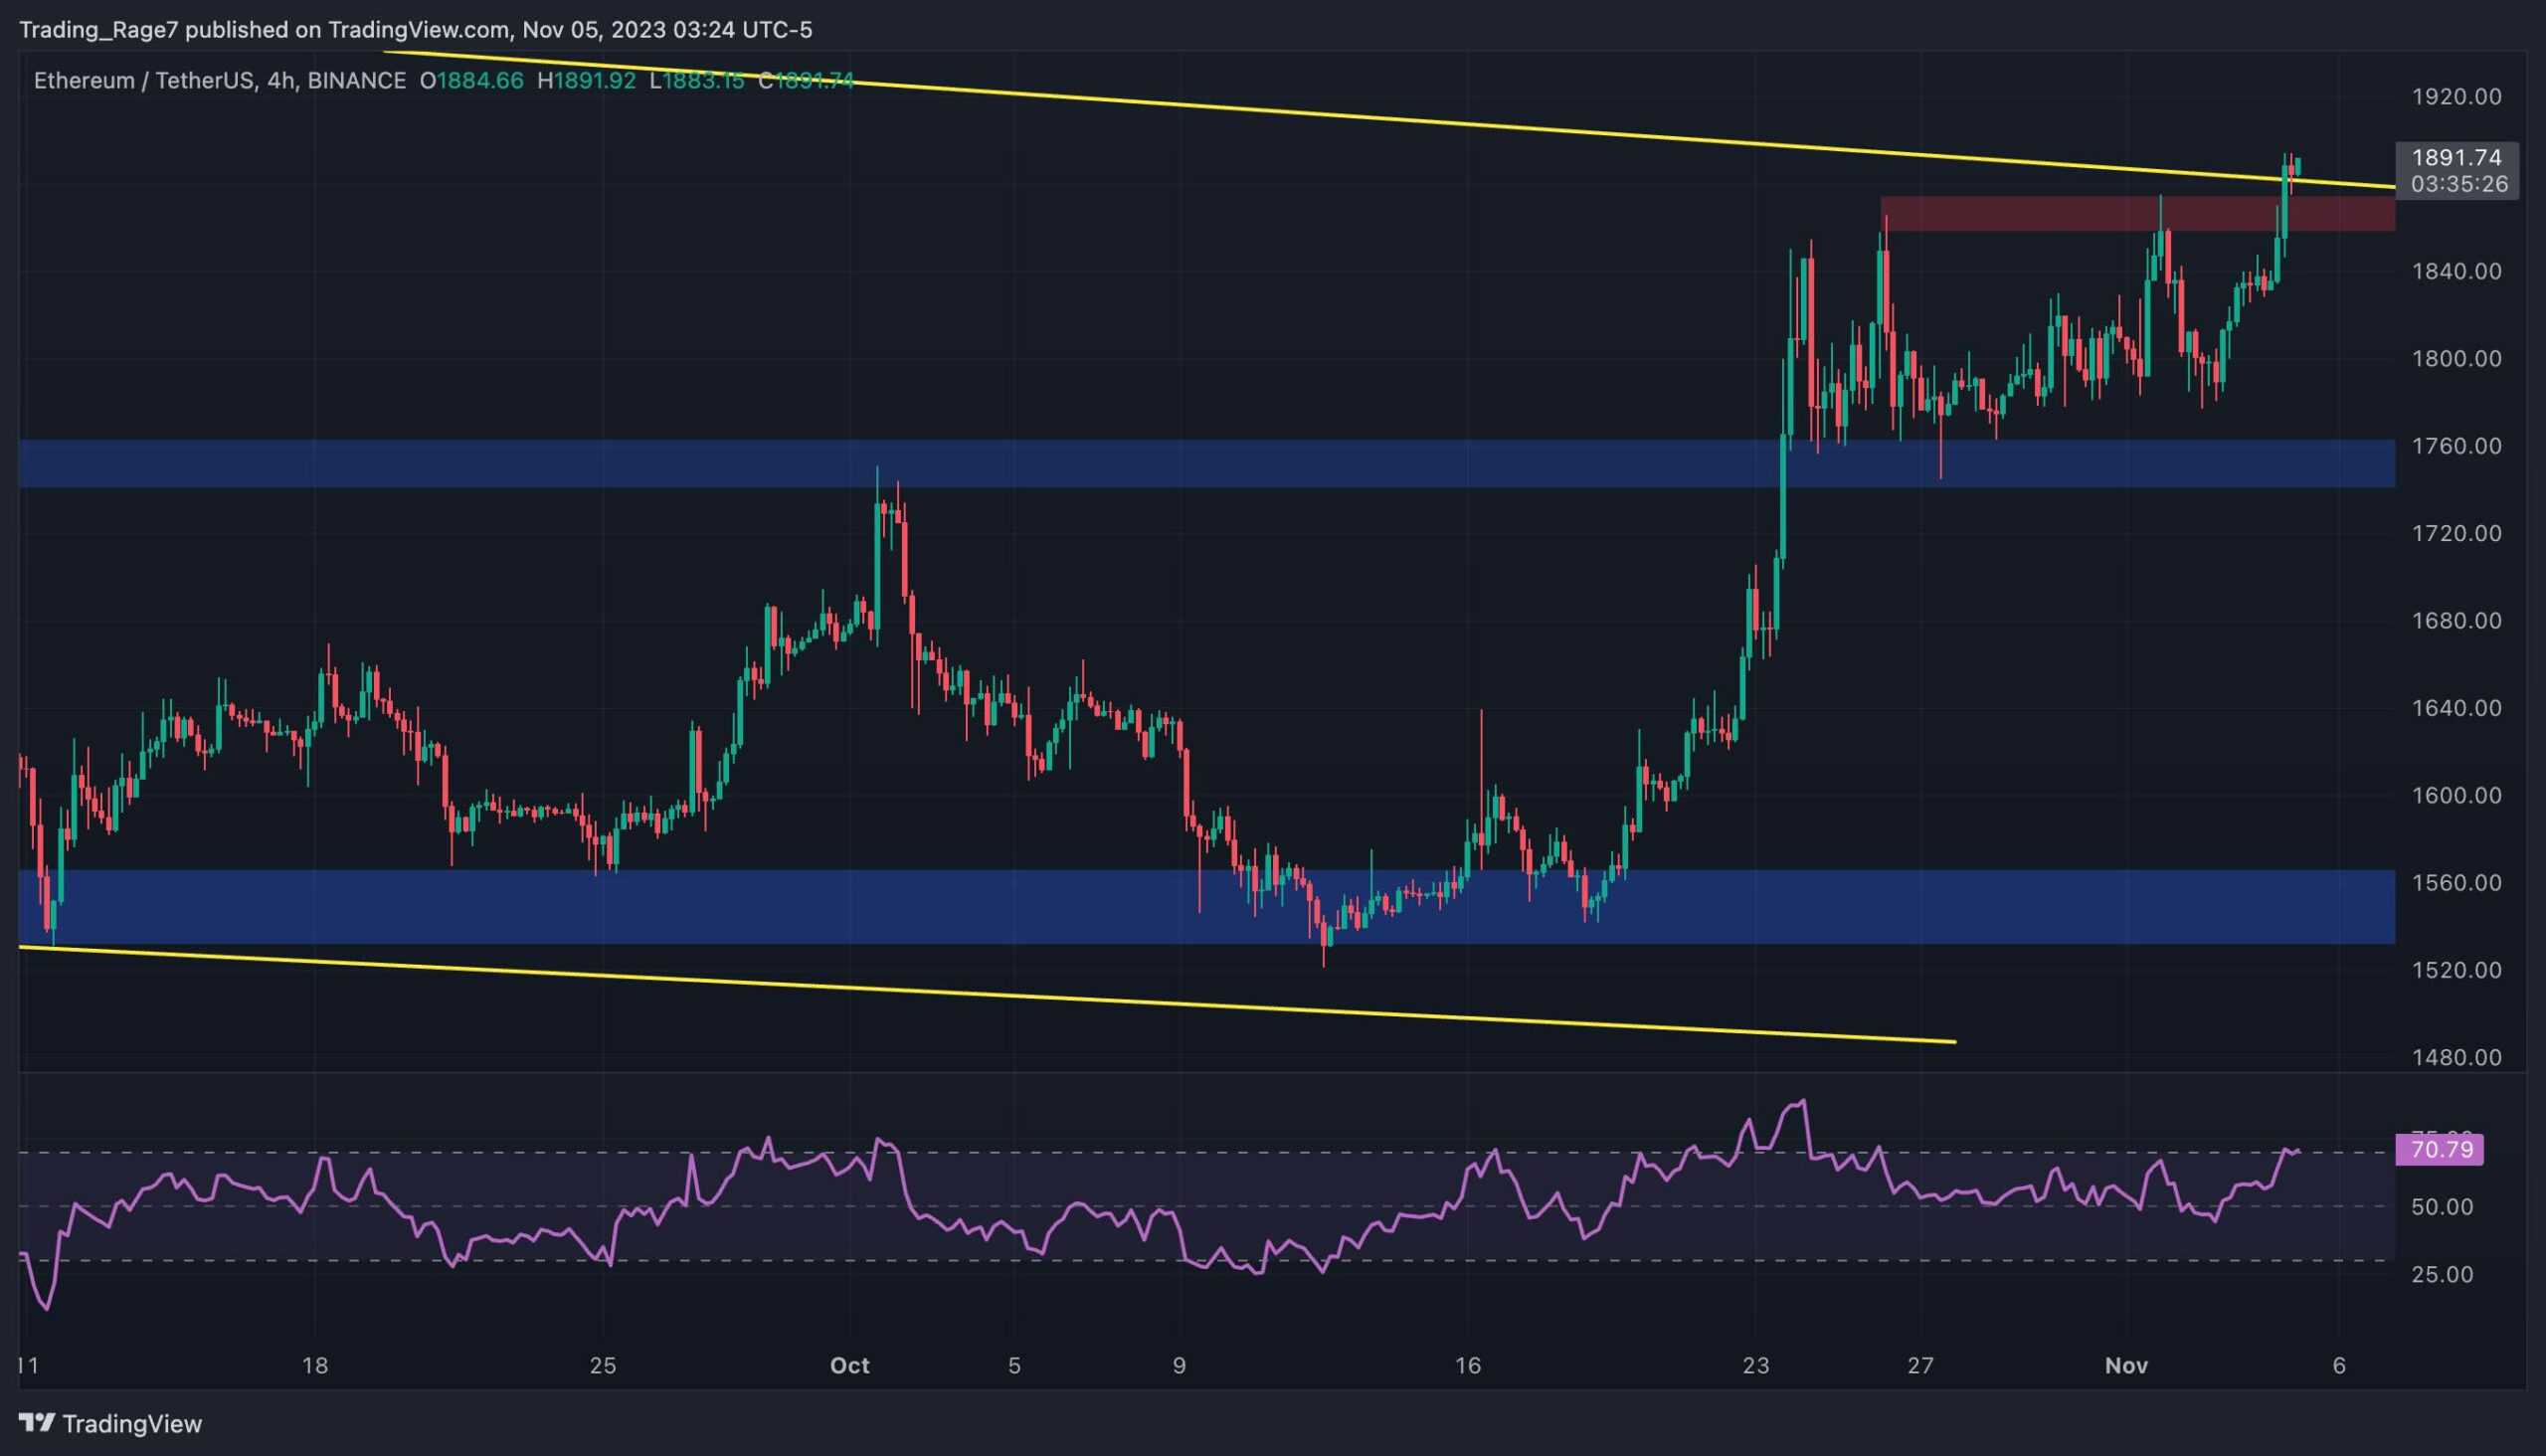
The 4-Hour Chart
The 4-hour chart seems more bullish than the daily. The price has already closed above the channel on the last couple of candles.
The $1,870 short-term resistance level is also seemingly broken, and things look set for a rally toward the $2,000 mark. The 4-hour Relative Strength Index is also yet to enter the overbought region but is on the verge of doing so. Yet, judging by the current bullish momentum, further upside is more probable than a correction in the coming days.
Sentiment Analysis
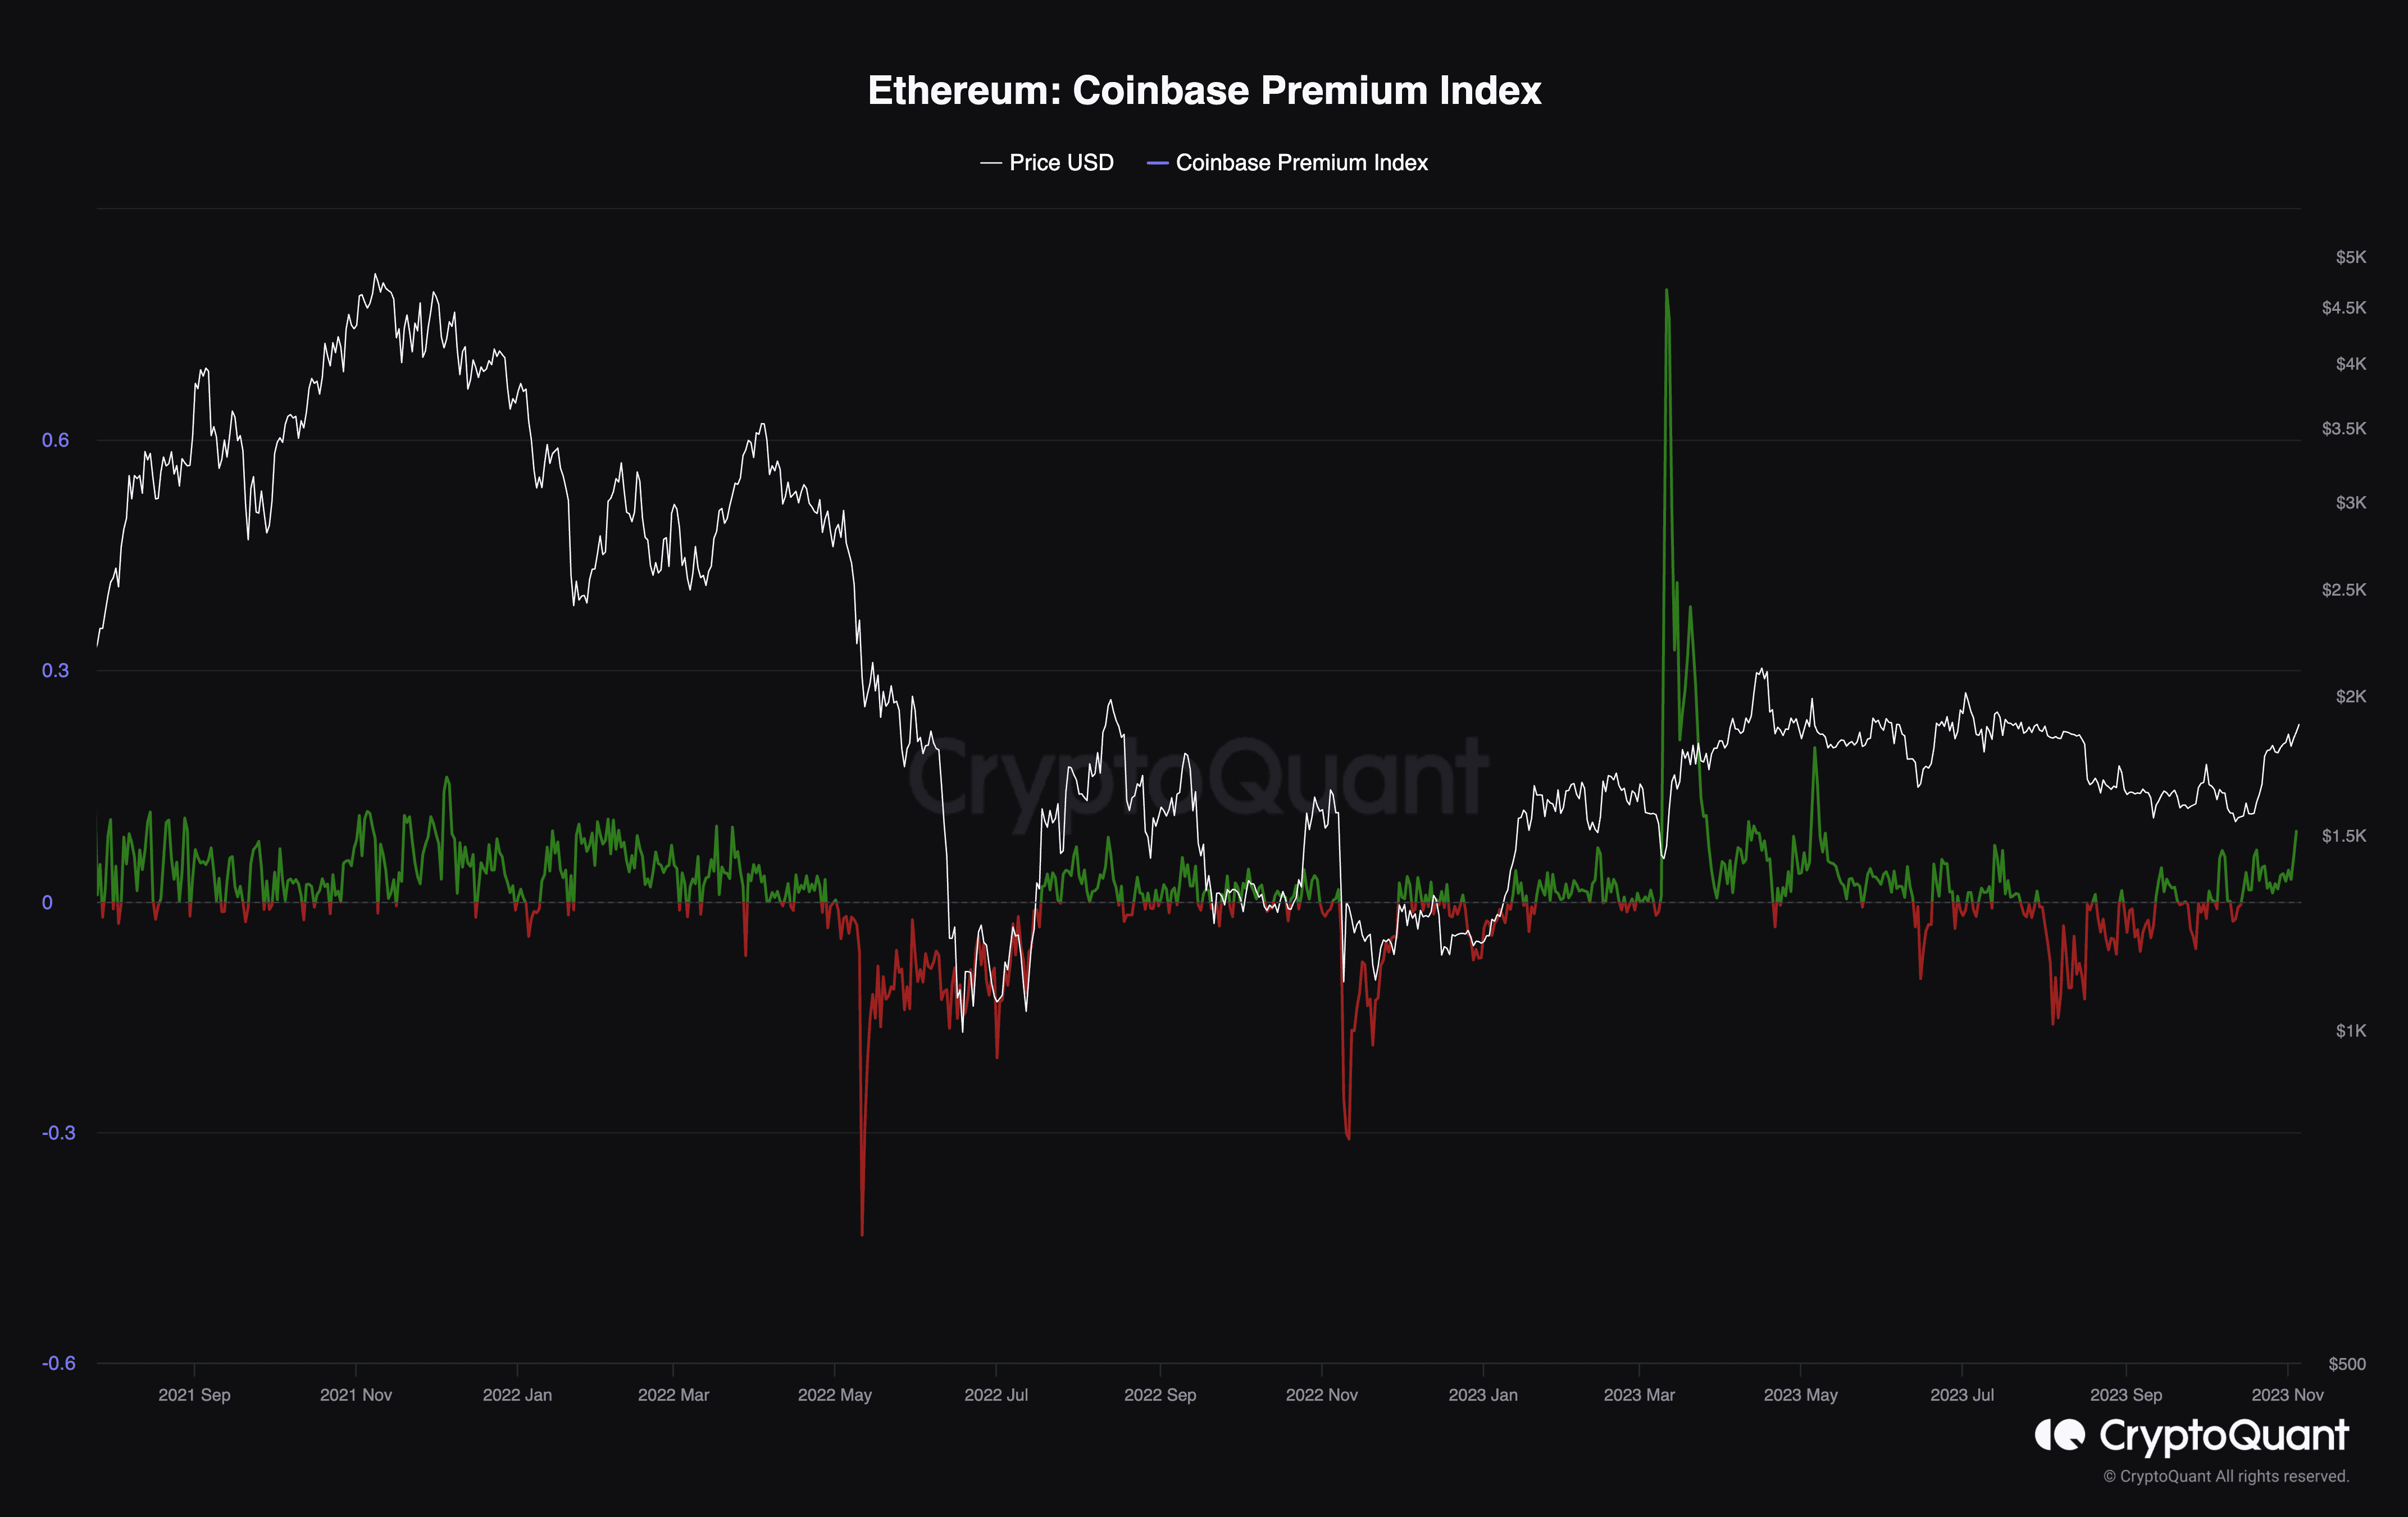
Coinbase Premium Index
Ethereum’s price is aggressively approaching the $2,000 resistance level and might even rally beyond. However, investors should analyze market sentiment for better decision-making, as the market is going through a critical, make-or-break phase.
This chart depicts the Coinbase premium index, which is a useful tool to evaluate US investors’ sentiment. Positive values indicate US market participants’ buying pressure, and negative values are associated with their selling pressure. Numerous American institutions and large investors have entered the crypto market during the recent cycle. Considering their deep pockets, their behavior could deeply affect the supply and demand dynamics in the market and, consequently, determine trend directions.
As demonstrated on the chart, this metric has recently recovered above zero and is currently rising in the positive territory. Therefore, it can be interpreted that US investors are relatively bullish on Bitcoin and expect the recent price move to continue. As a result, their demand can push the price even higher and sustain the current uptrend.
The post ETH Bulls Aimed at $2K Following 4.6% Weekly Increase: Ethereum Price Analysis appeared first on CryptoPotato.