Crypto Price Analysis & Overview: Bitcoin, Ethereum, Ripple, EOS, Chiliz
Bitcoin
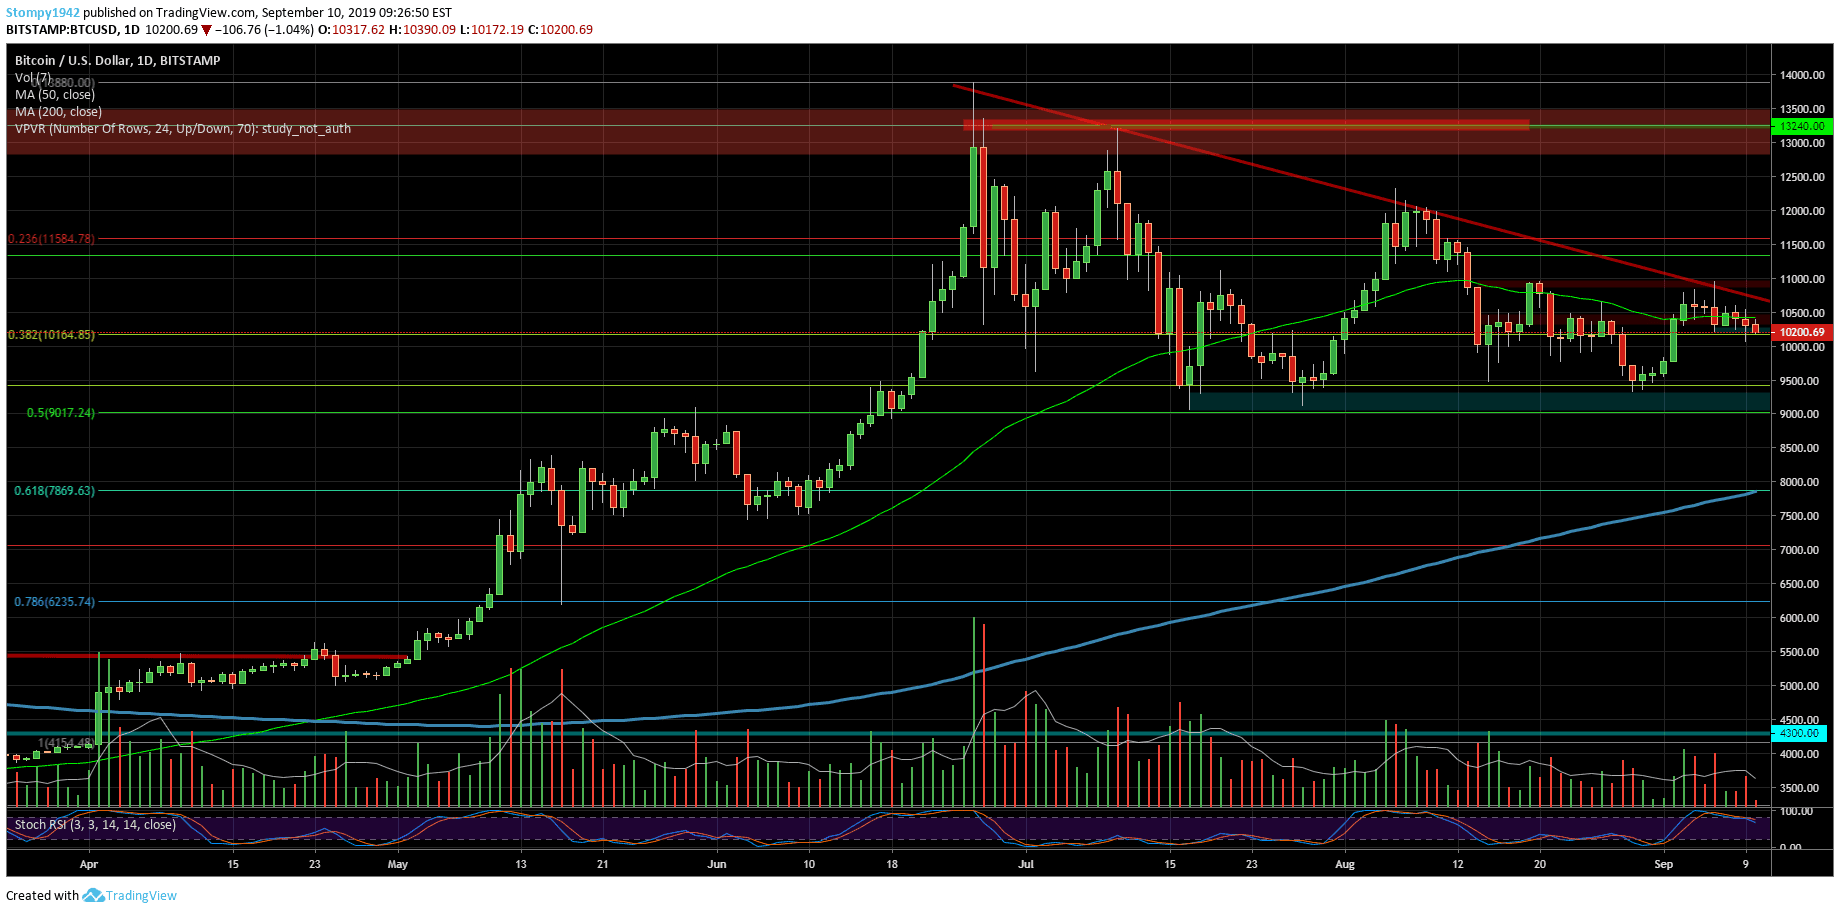
We saw an attempt to break through the $11,000 resistance but it failed and we came back to test the support at around $10,200. The entire market anticipates the convergence of the triangle and we also account for a possibility to retrace back to $9,200. Data shows that there are more sellers during this period but demand exists and it’s felt in the price. If the price remains above $10,000, this would be a positive sign going forward.
Ethereum
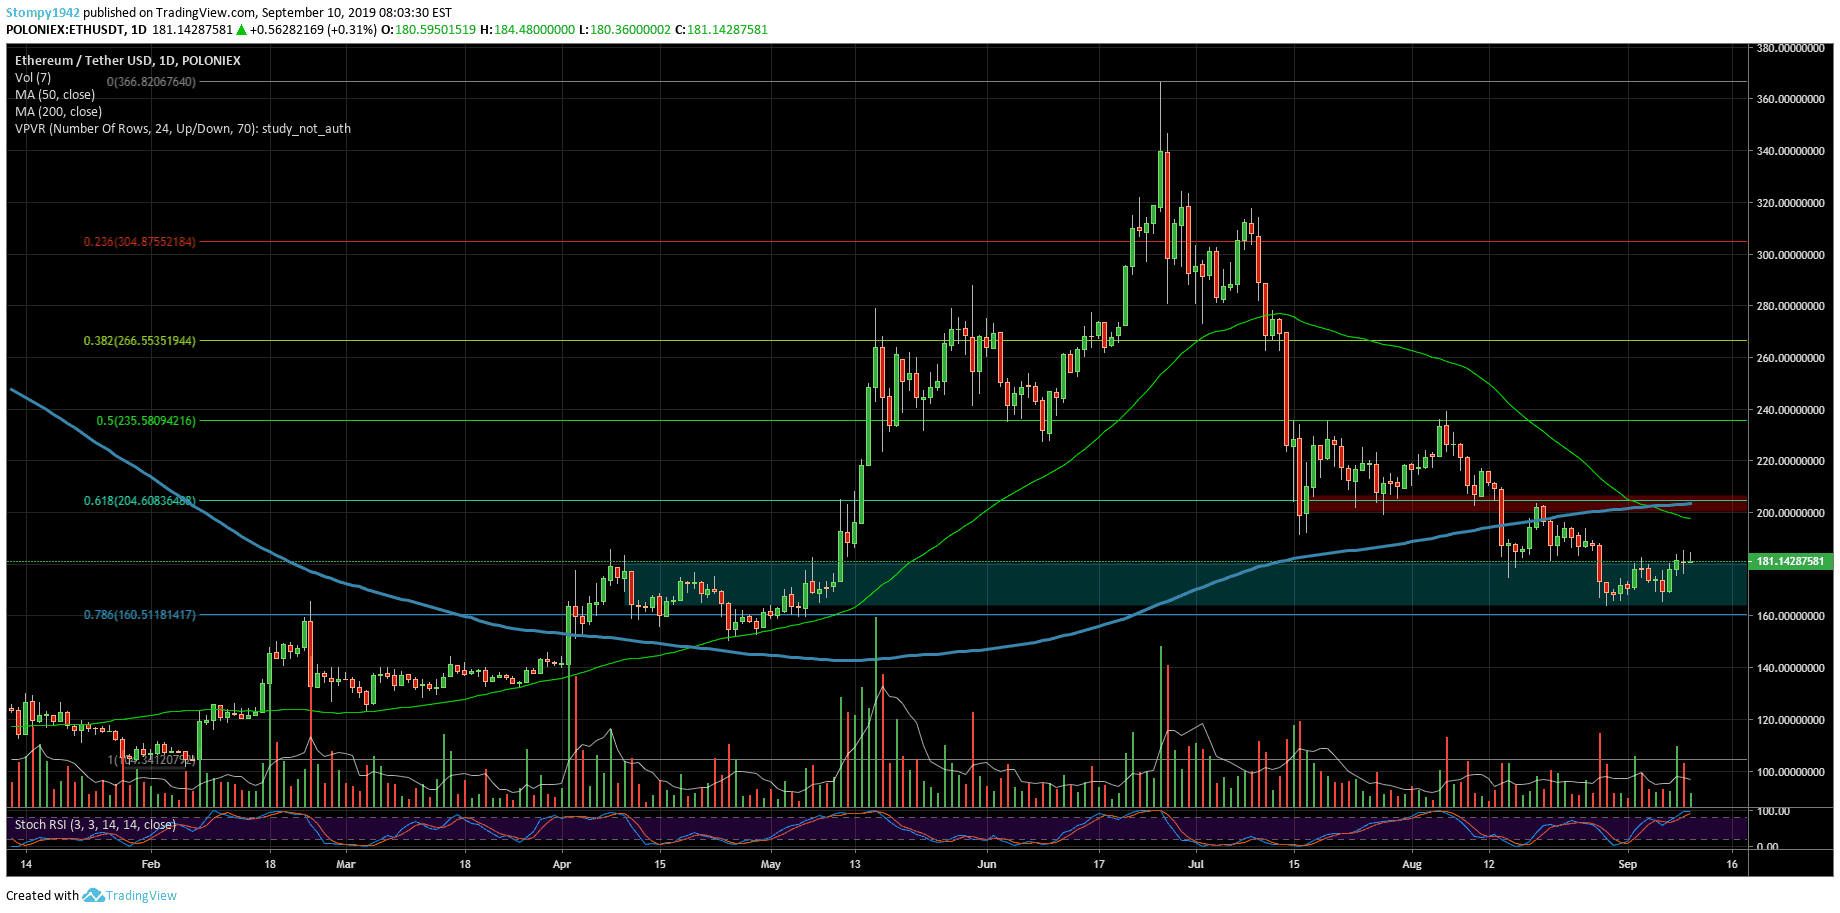
Against the USD, we saw the completion of a Fibonacci correction to the levels of 0.786. Support is around $163 and for now, it holds. The price is around $180. The resistance in this range is there too. If the trend goes up, the next resistance is at $200.
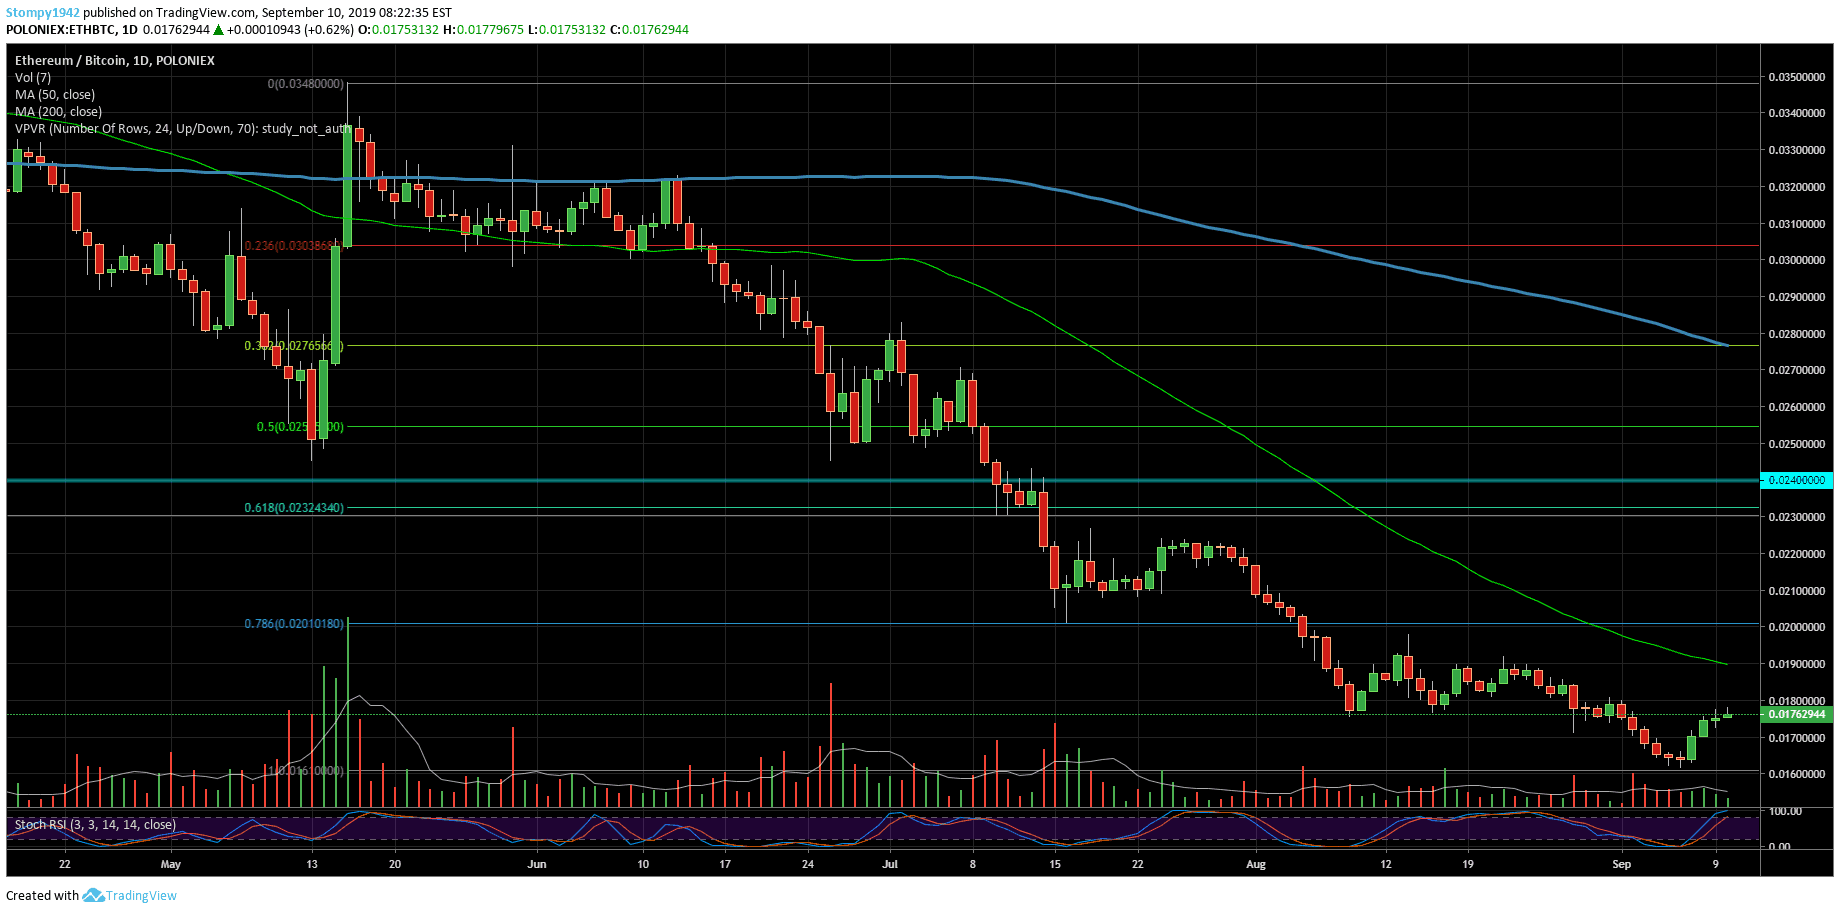
Against Bitcoin, we saw an attempt to fix a delicate upside. The market that lost more than 90% of its new, lower value, is declining and support is built around 0.017BTC. Resistance is at 0.019 BTC.
Ripple
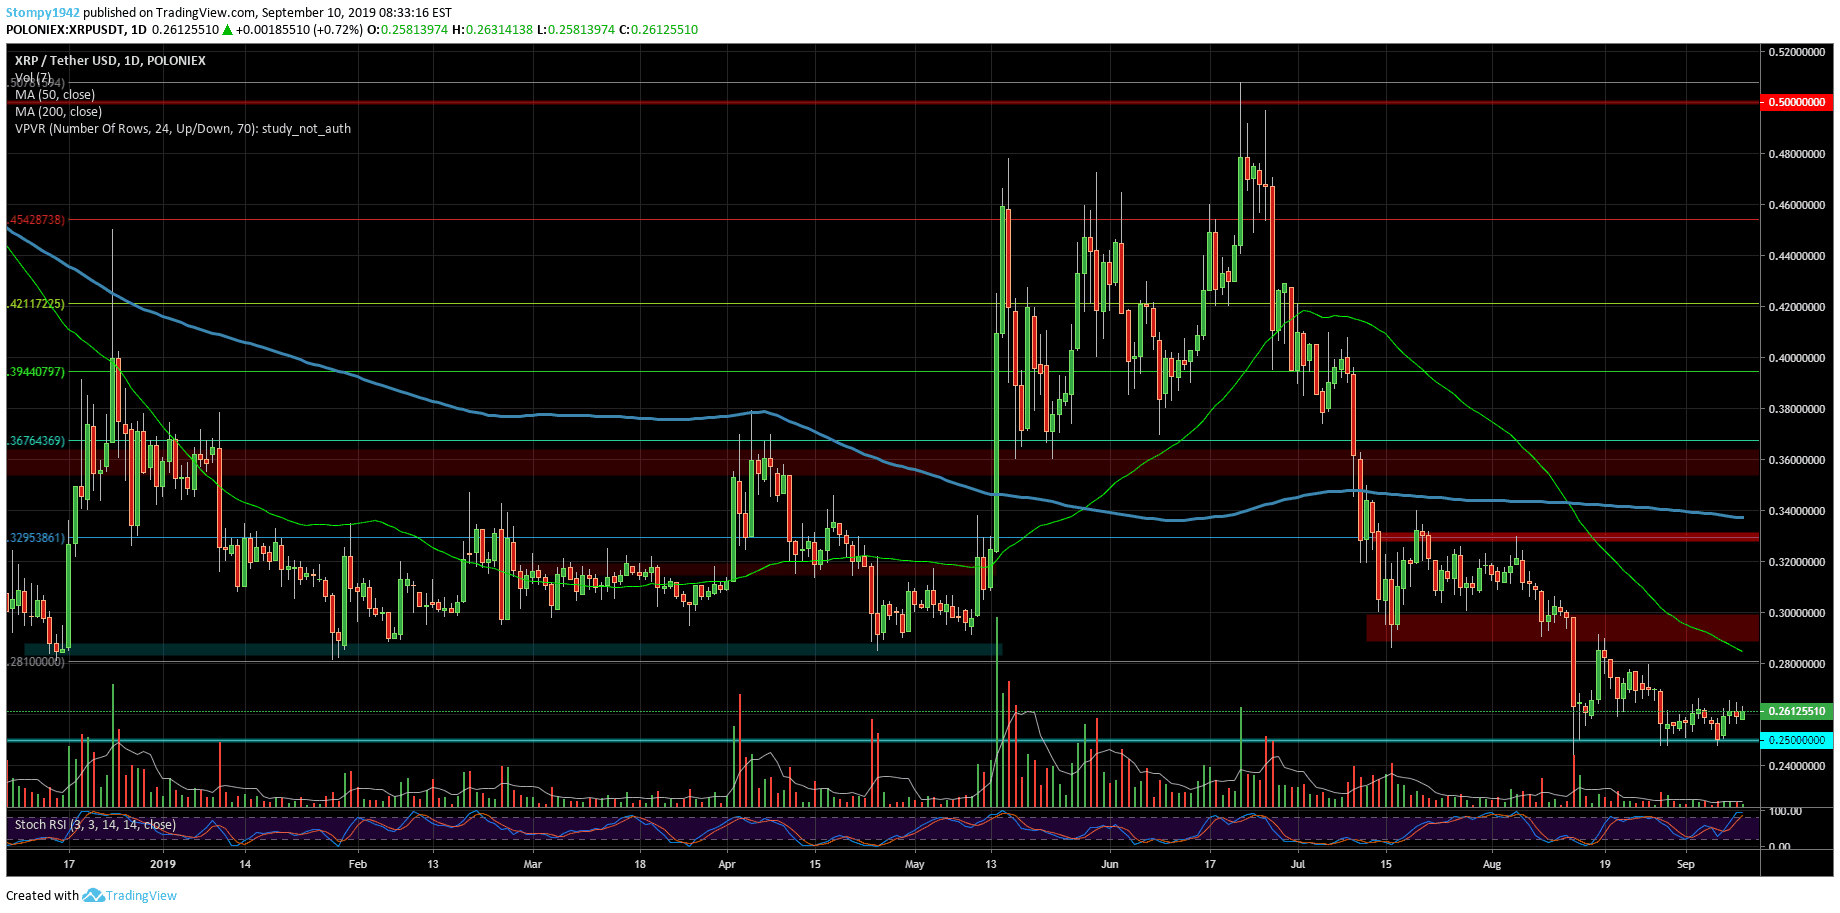
Against the USD, the support at 25 cents still holds. Resistance is at 28 cents in this range. The trading volume has plummeted and the market has calmed down after the correction which saw the lowest price in 2019.
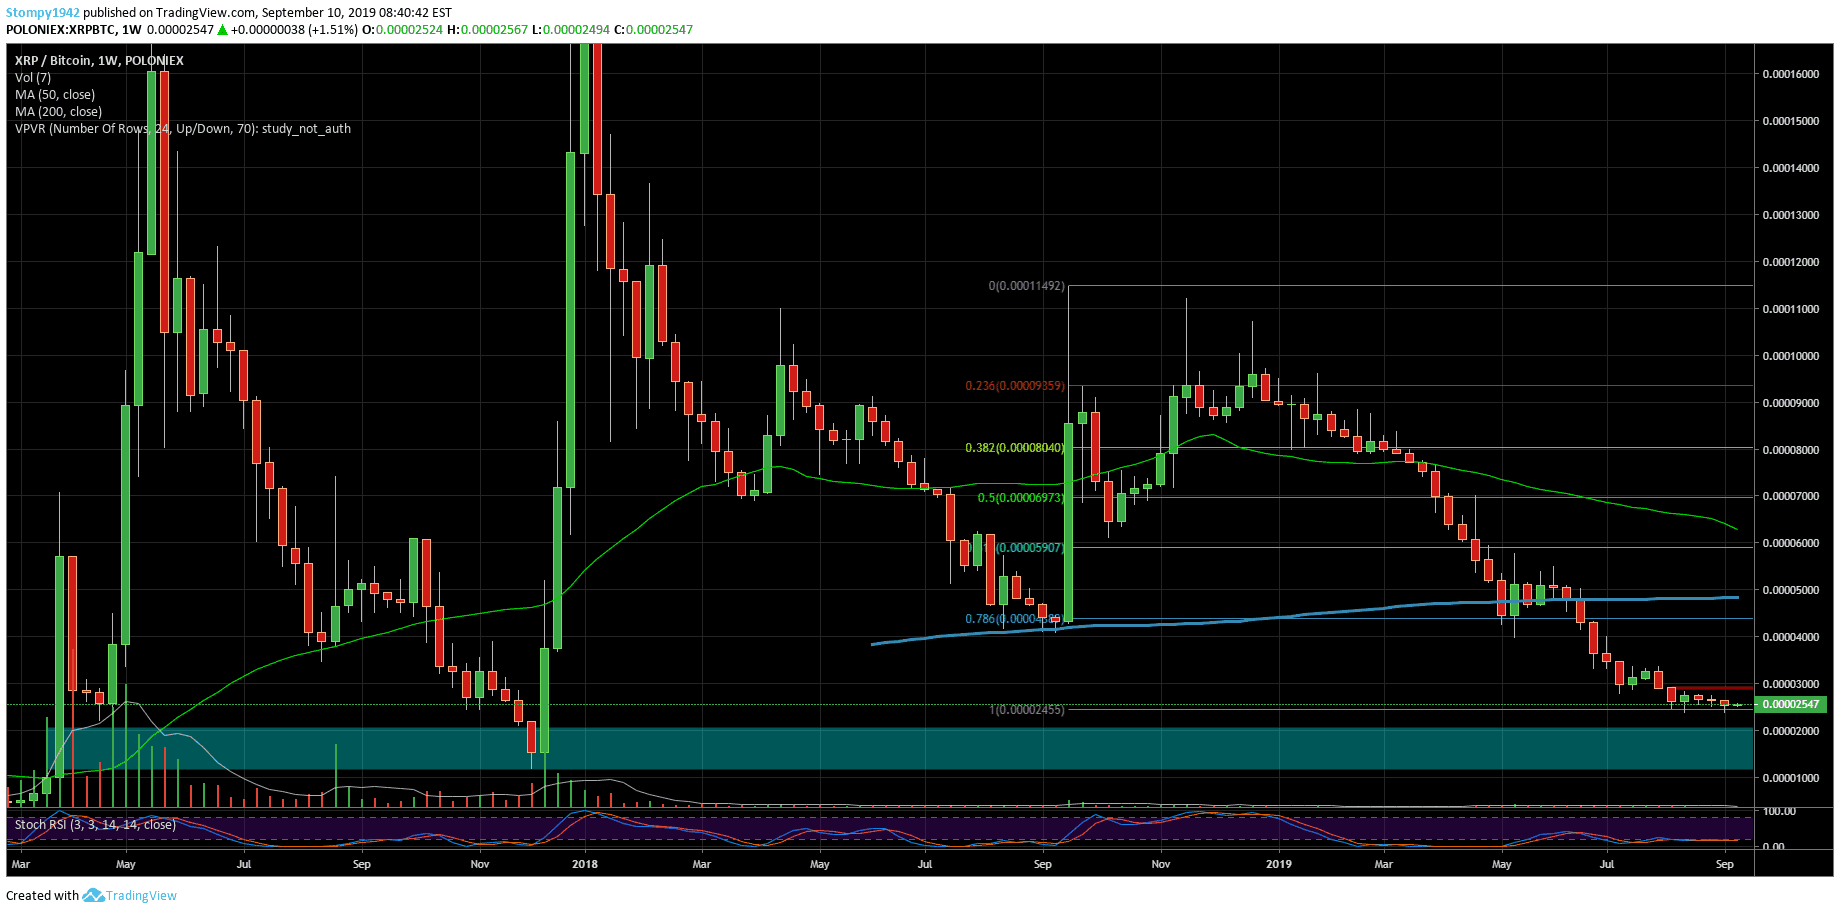
Against Bitcoin, we look at the weekly chart to see a clearer picture. The support around 2300SAT holds but if it breaks XRP can set lows not seen since 2017. On the other hand, it’s positive that the price remains relatively stable over the last 4 weeks which is not previously seen in the resistance charts in this range at around 2800 SAT and the RSI which is below.
EOS
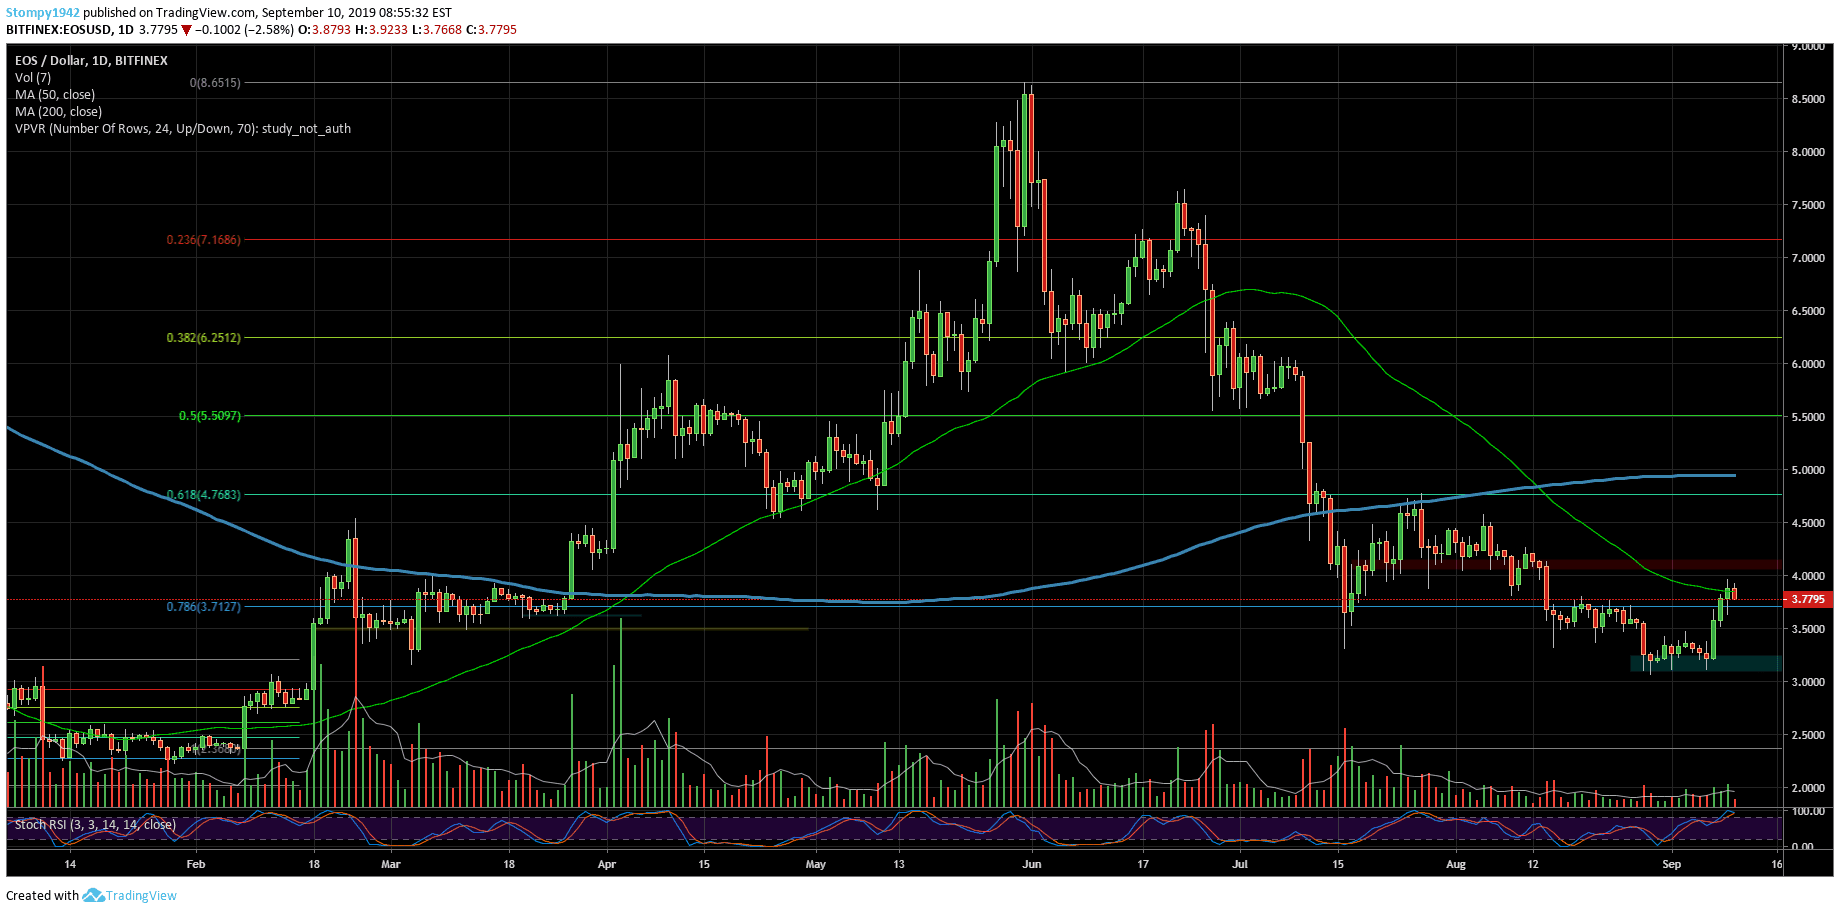
Against the USD, we saw a slight completion of the Fibonacci correction of 0.786 which failed to produce new lows. We also saw an attempt to break through the 50MA at $4, which also acts as resistance. Support in this range is at $3.7.
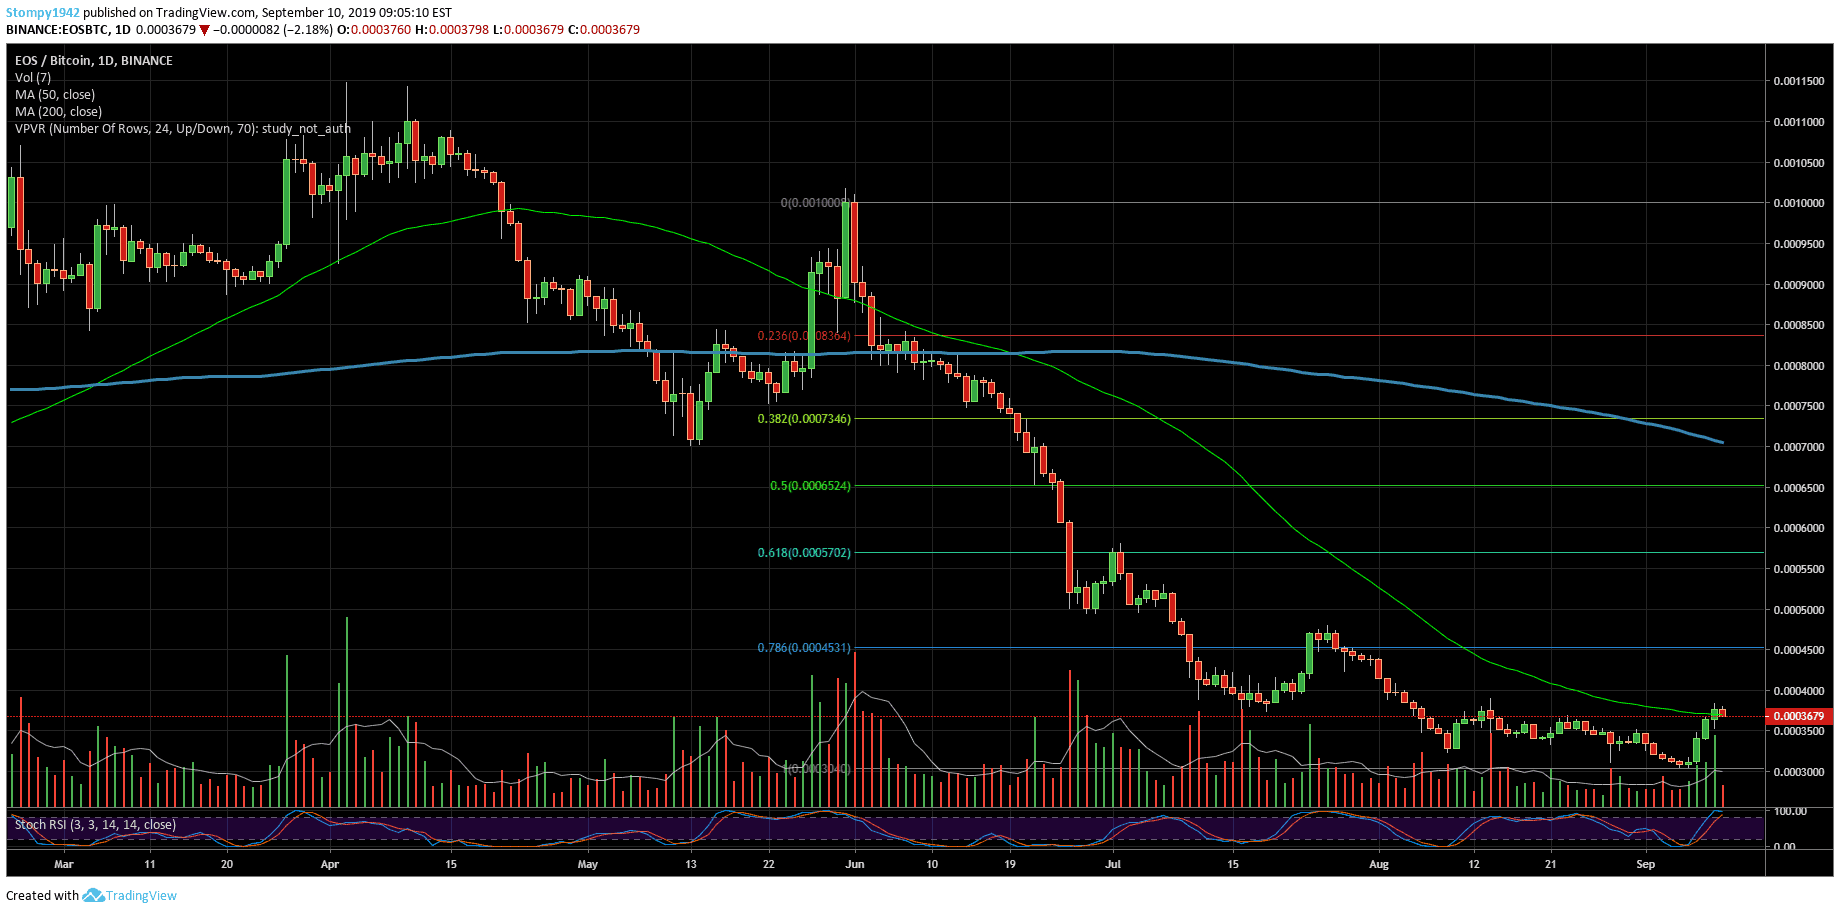
Against Bitcoin, we saw a sharp correction in May which sent the price to levels we hadn’t seen since 2017. The attempts to break up failed but the declines also slowed down. We saw another attempt to break above the 50MA. The resistance in this range is around 0.00037BTC, while the support is at 0.00035BTC.
Chiliz
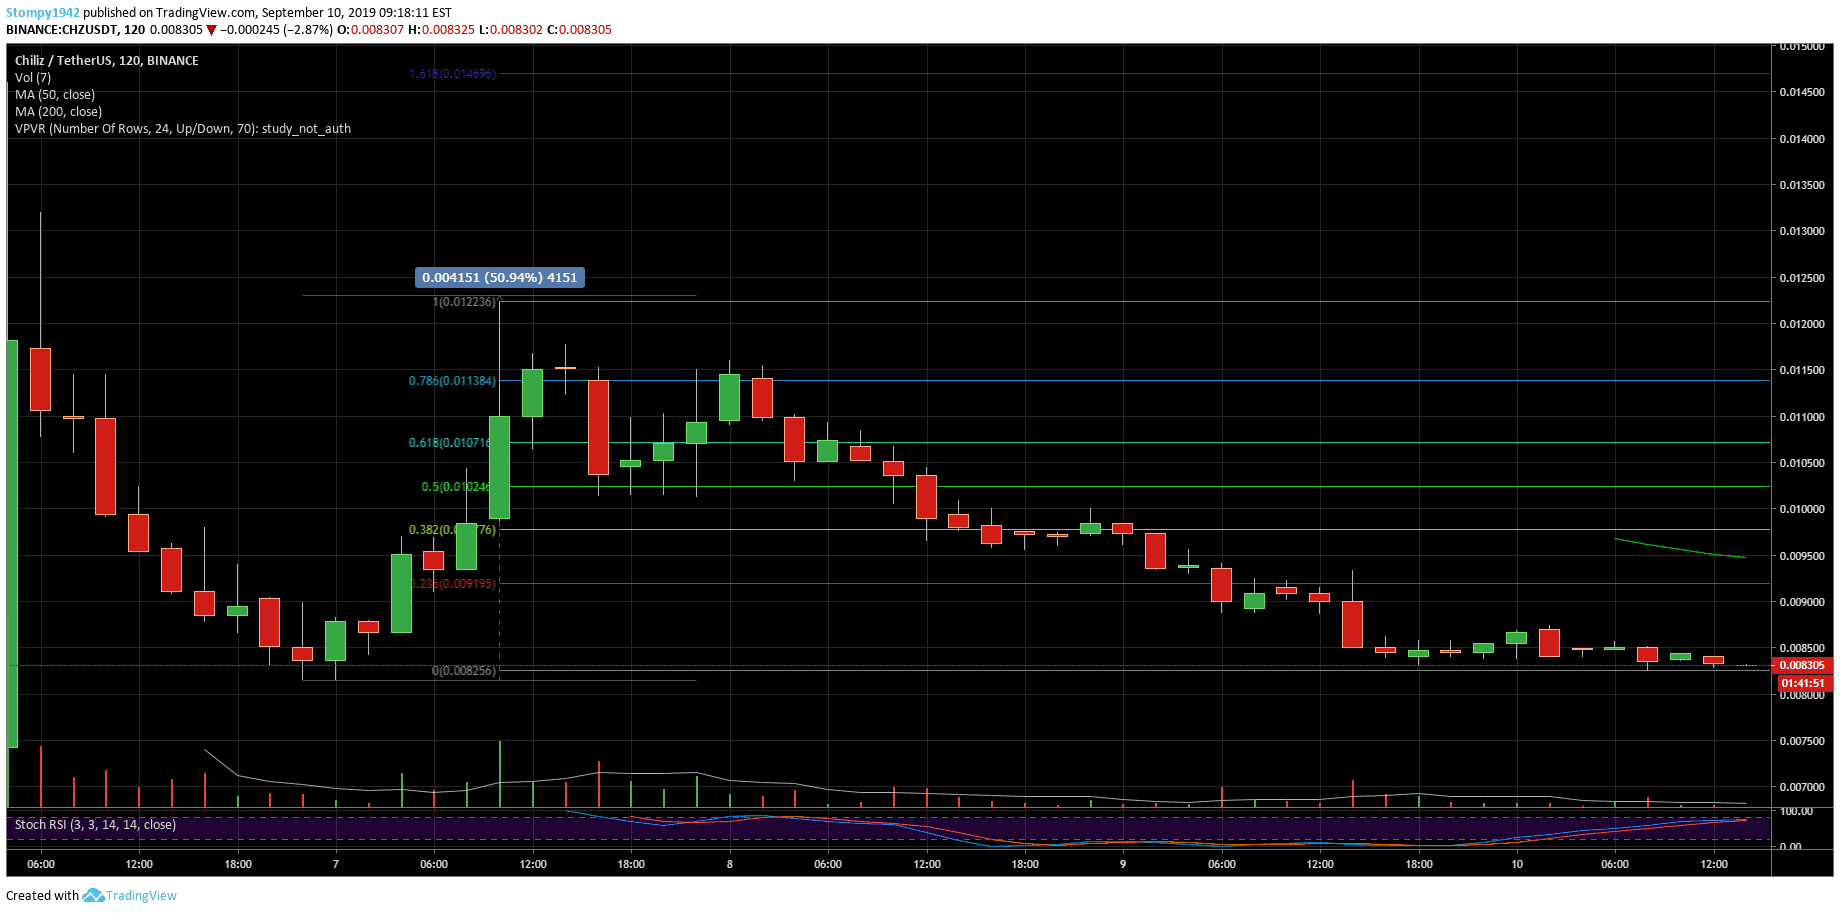
Against the USD, the cryptocurrency is just opening and there’s not enough information. That’s why we took a look at the two-hour chart. The trading started enthusiastically around $0.011 on average but since the exchange rate corrected. It looks like support is built around $0.008 while the range stands at $0.010.
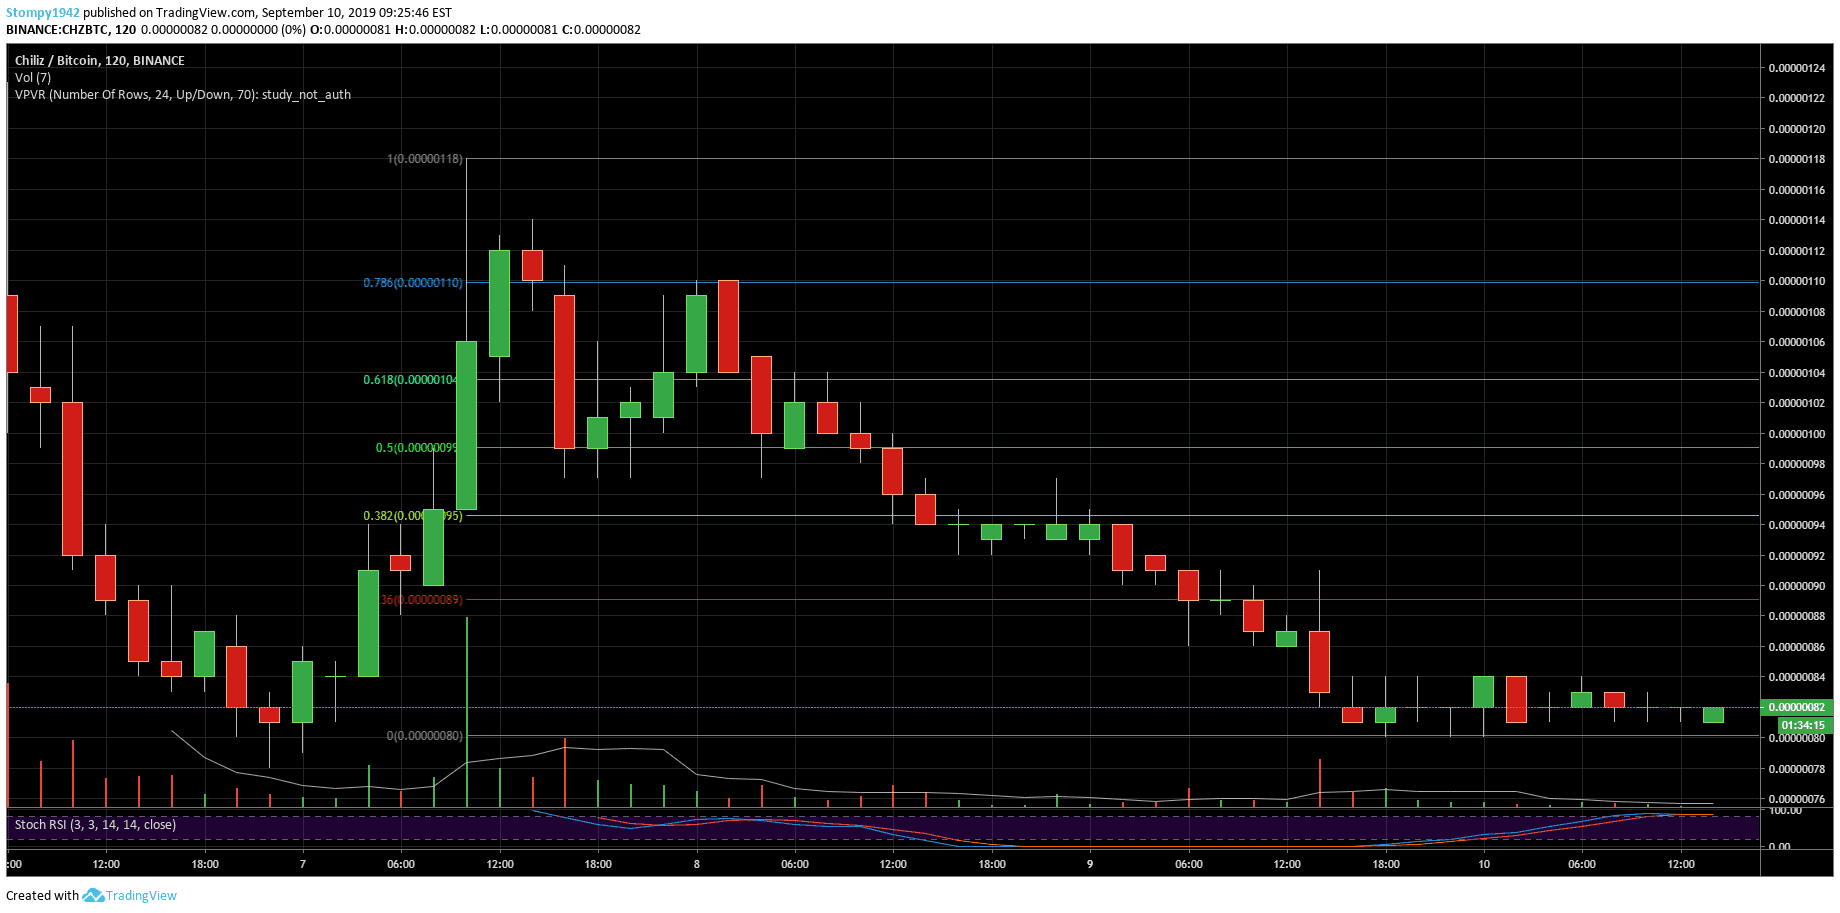
Against BTC on the two-hour chart the price started from trading around 100SAT which is also the resistance after the 80SAT corrections where the support in this range is built.
The post Crypto Price Analysis & Overview: Bitcoin, Ethereum, Ripple, EOS, Chiliz appeared first on CryptoPotato.