Cardano Skyrockets 7% Weekly, But Warning Signs Are Ahead: Three Things to Watch (ADA Price Analysis)
Cardano rallied this week and managed to book a price increase in double digits. Can it go higher still?
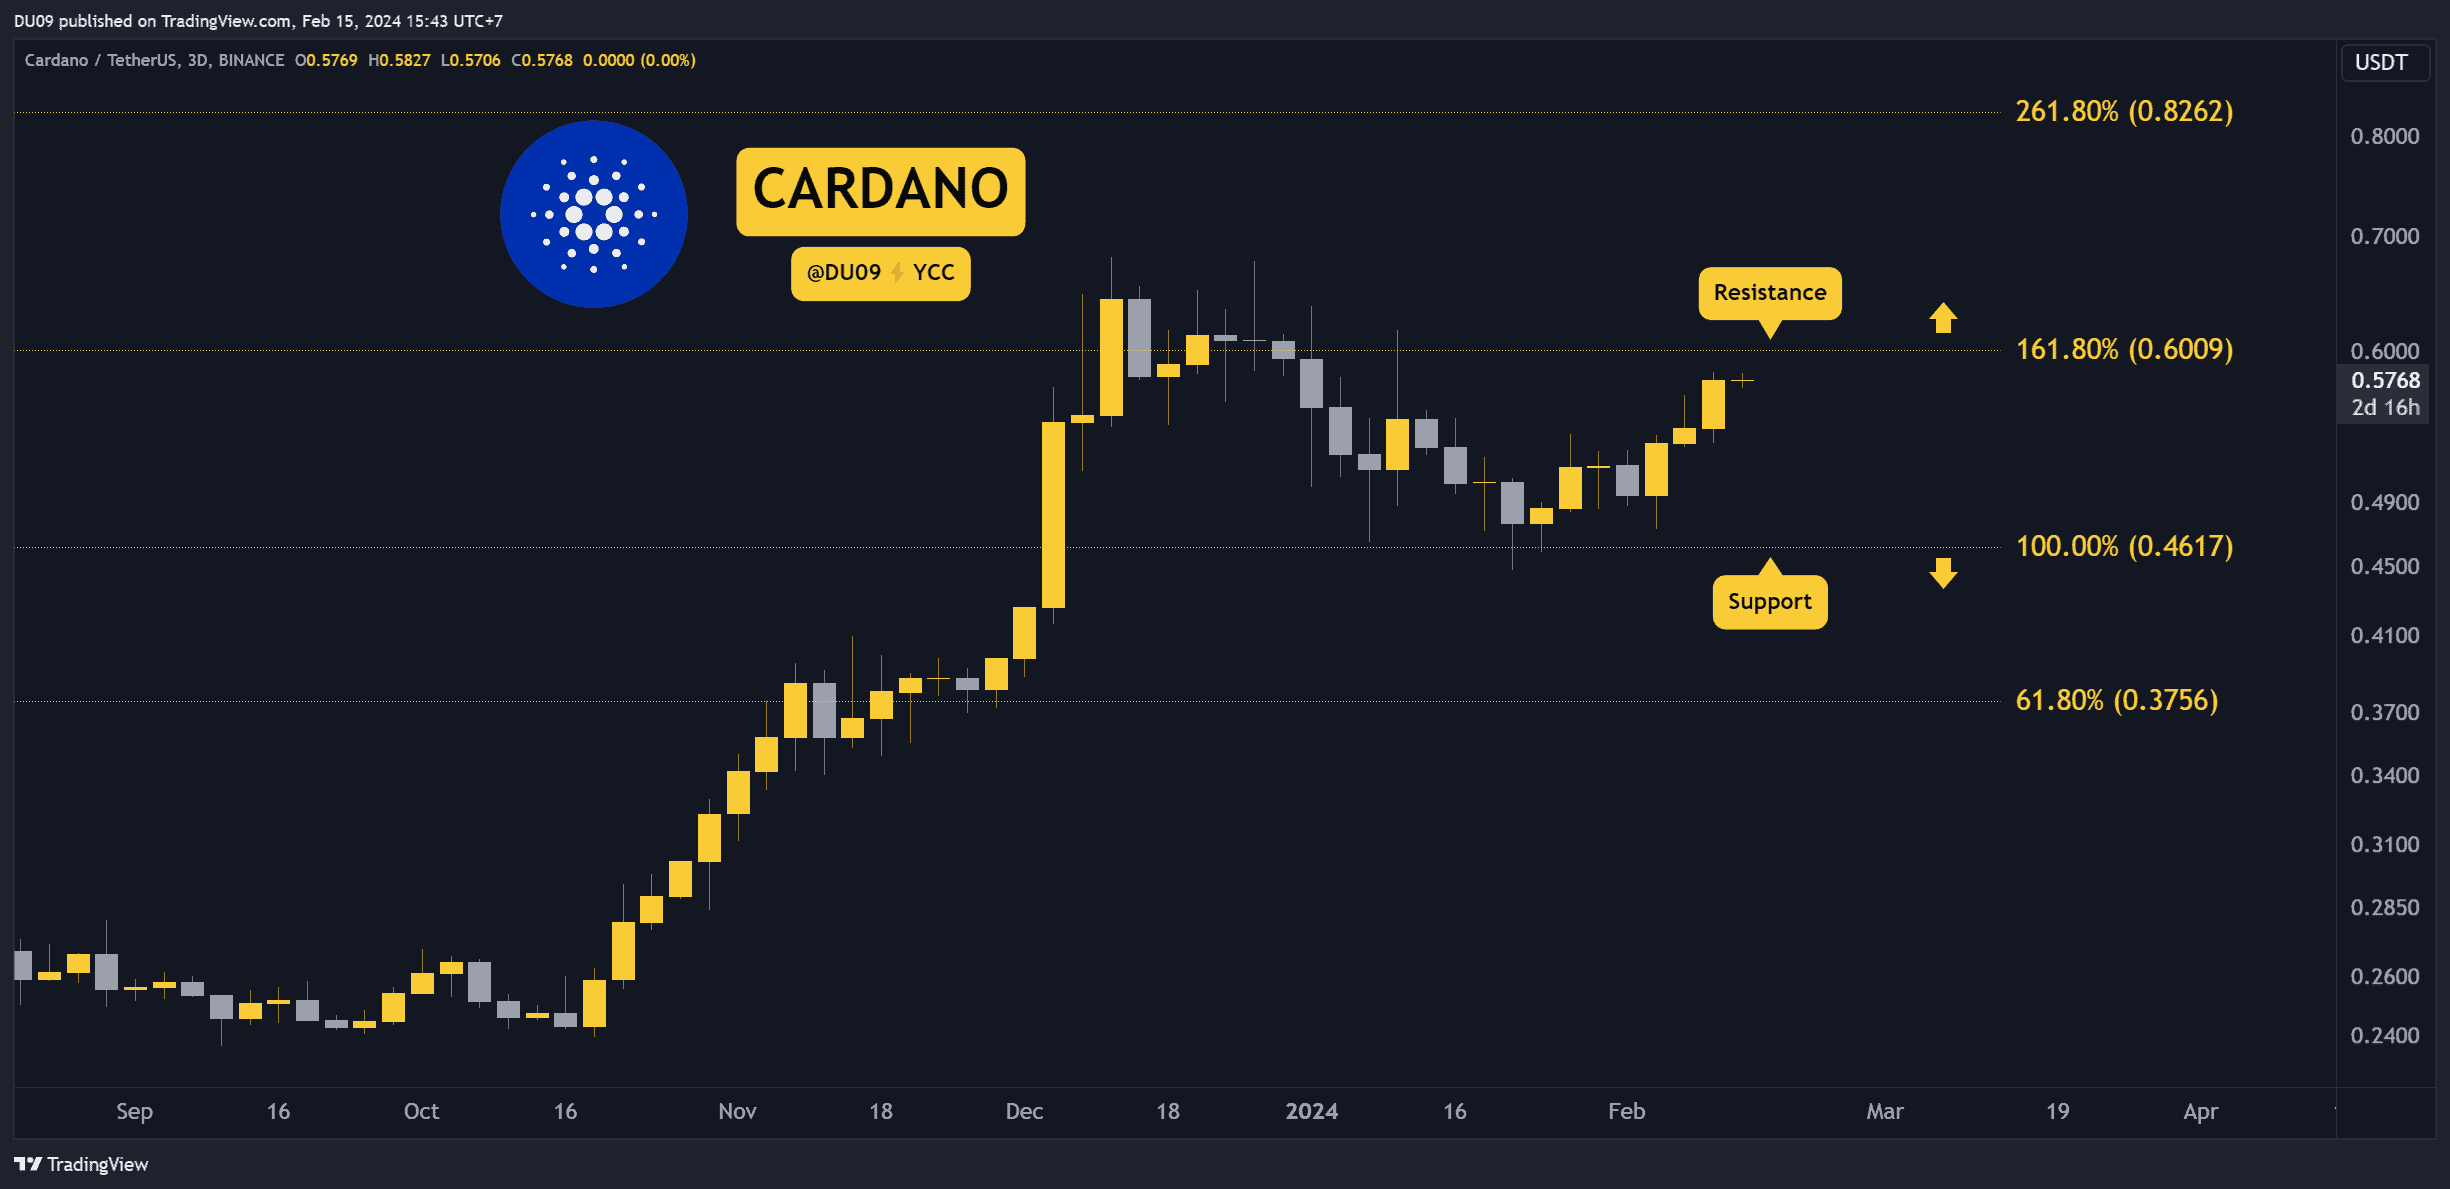
Key Support levels: $0.46
Key Resistance levels: $0.60
1. Key Resistance in Sight
ADA started a sustained rally after finding good support at 46 cents and has managed to move higher to approach the resistance at 60 cents quickly. If bulls break this level, then ADA could make a new high this year.
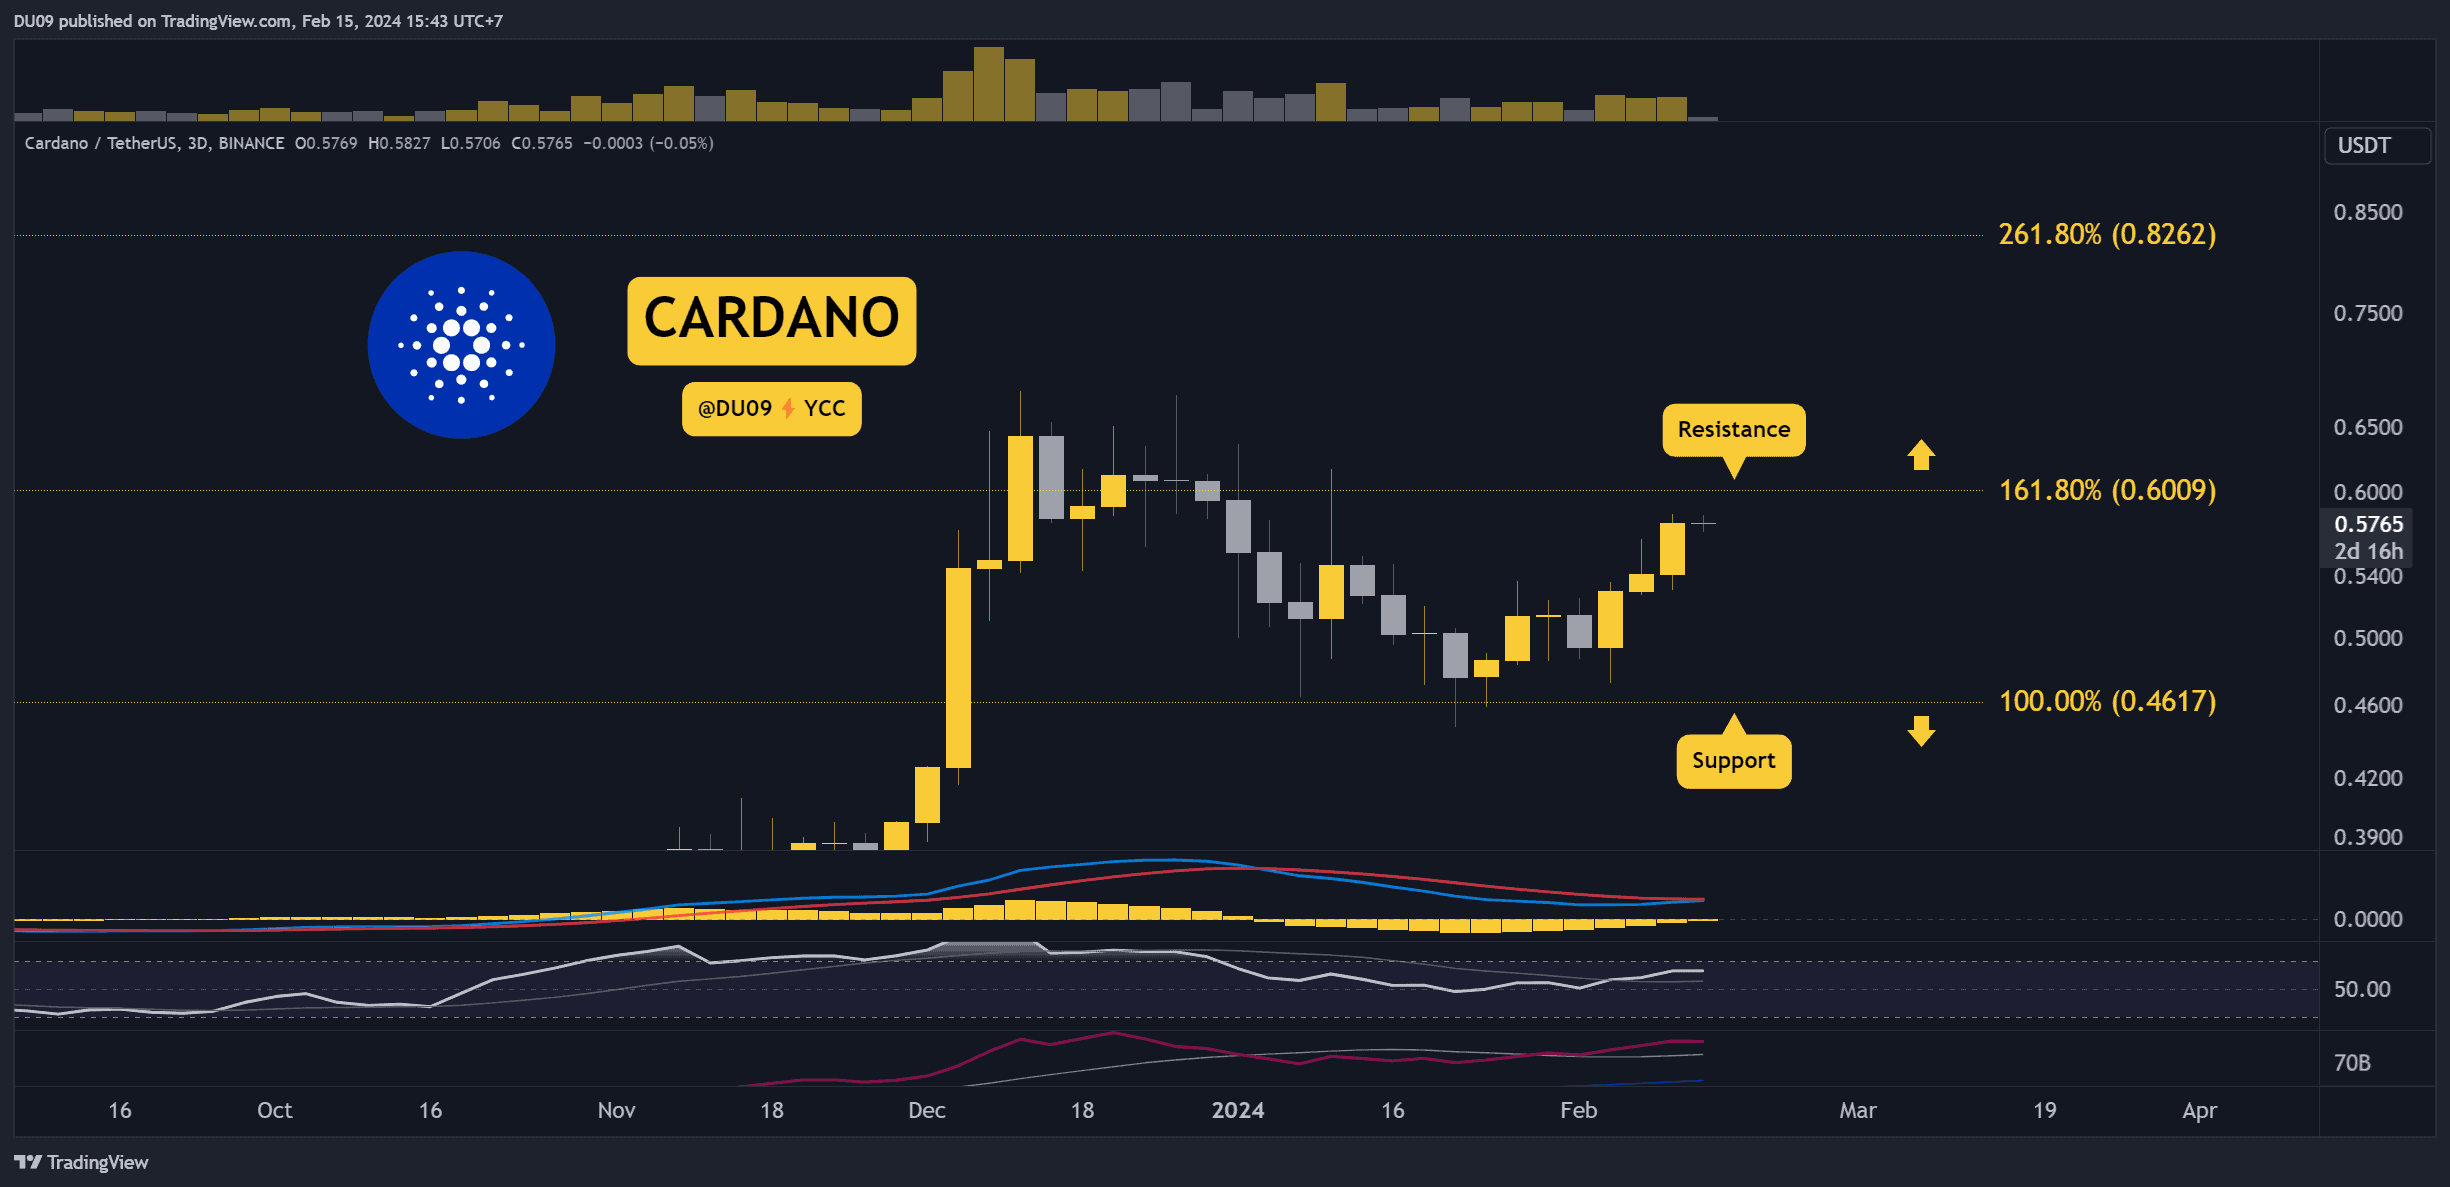
2. Bullish Momentum Intensifies
The momentum indicators are giving a bullish signal, and on the three-day timeframe, the RSI is already above 60 points. This places ADA on the bullish side, and continuation appears most likely right now.
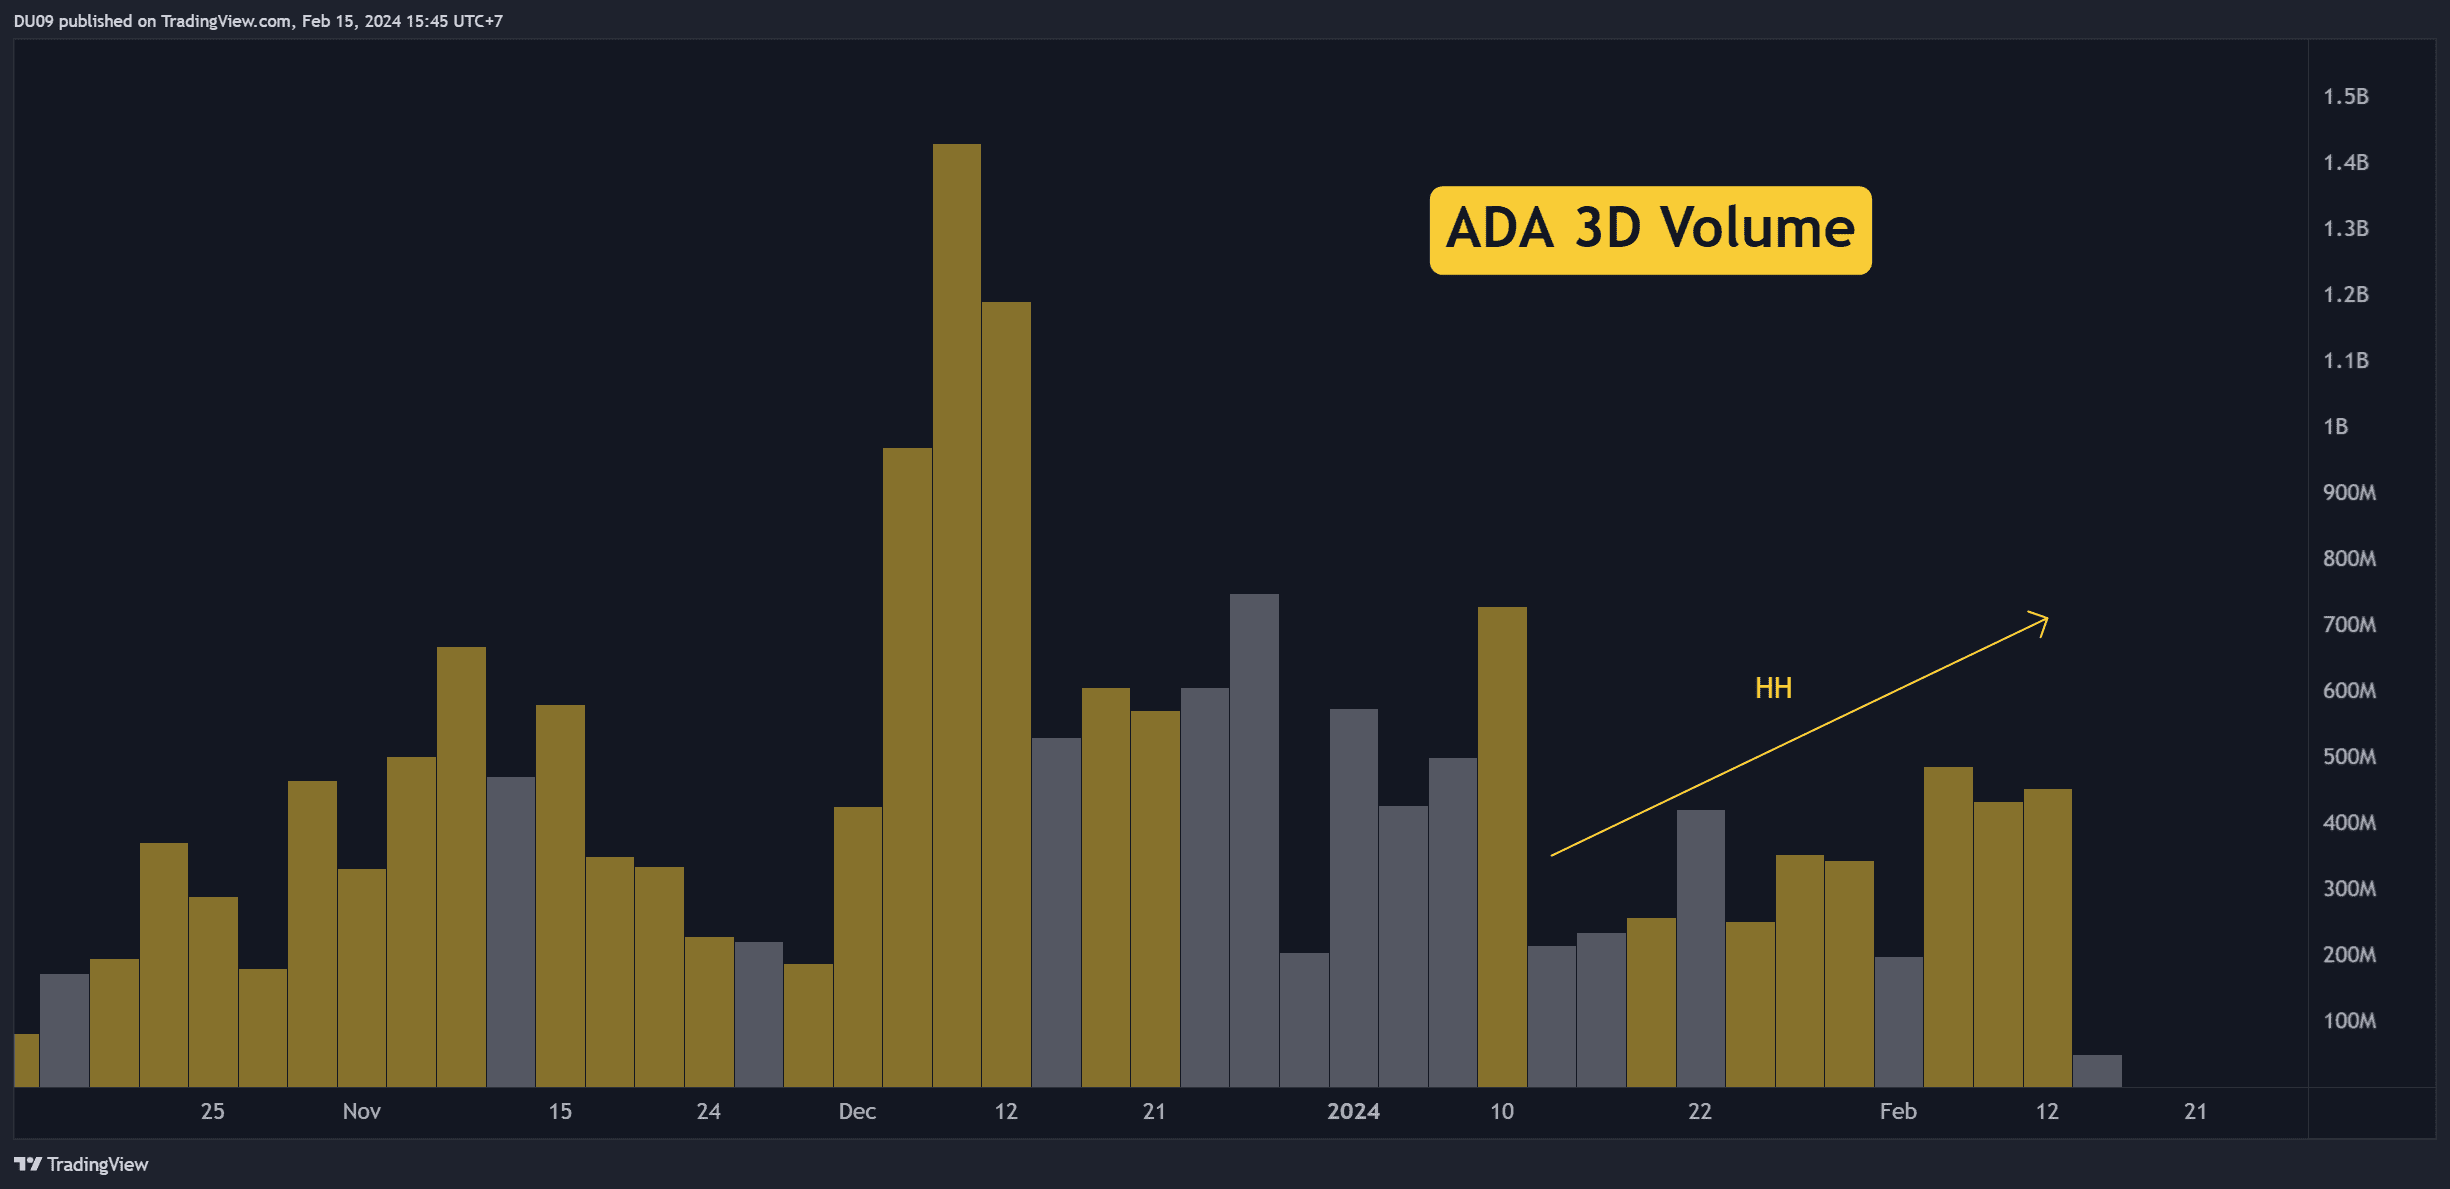
3. Buy Volume Makes Higher Highs
With bulls in control of the price action, the volume is showing clear higher highs. As long as this continues, the price will have to follow a similar trend. However, to break the 60 cent resistance, buyers will have to show more strength, like in mid-December.
Bias
The bias for ADA is bullish.
Short-Term Prediction for ADA Price
The price is on its way to the 60-cent resistance. Once there, ADA will have to make a decision if it pushes higher or enters a pullback. At the time of this post, buyers have the upper hand.
The post Cardano Skyrockets 7% Weekly, But Warning Signs Are Ahead: Three Things to Watch (ADA Price Analysis) appeared first on CryptoPotato.