Cardano Price Analysis: ADA Crashes 13% Daily as Bears Target 2018 ATH Levels Next
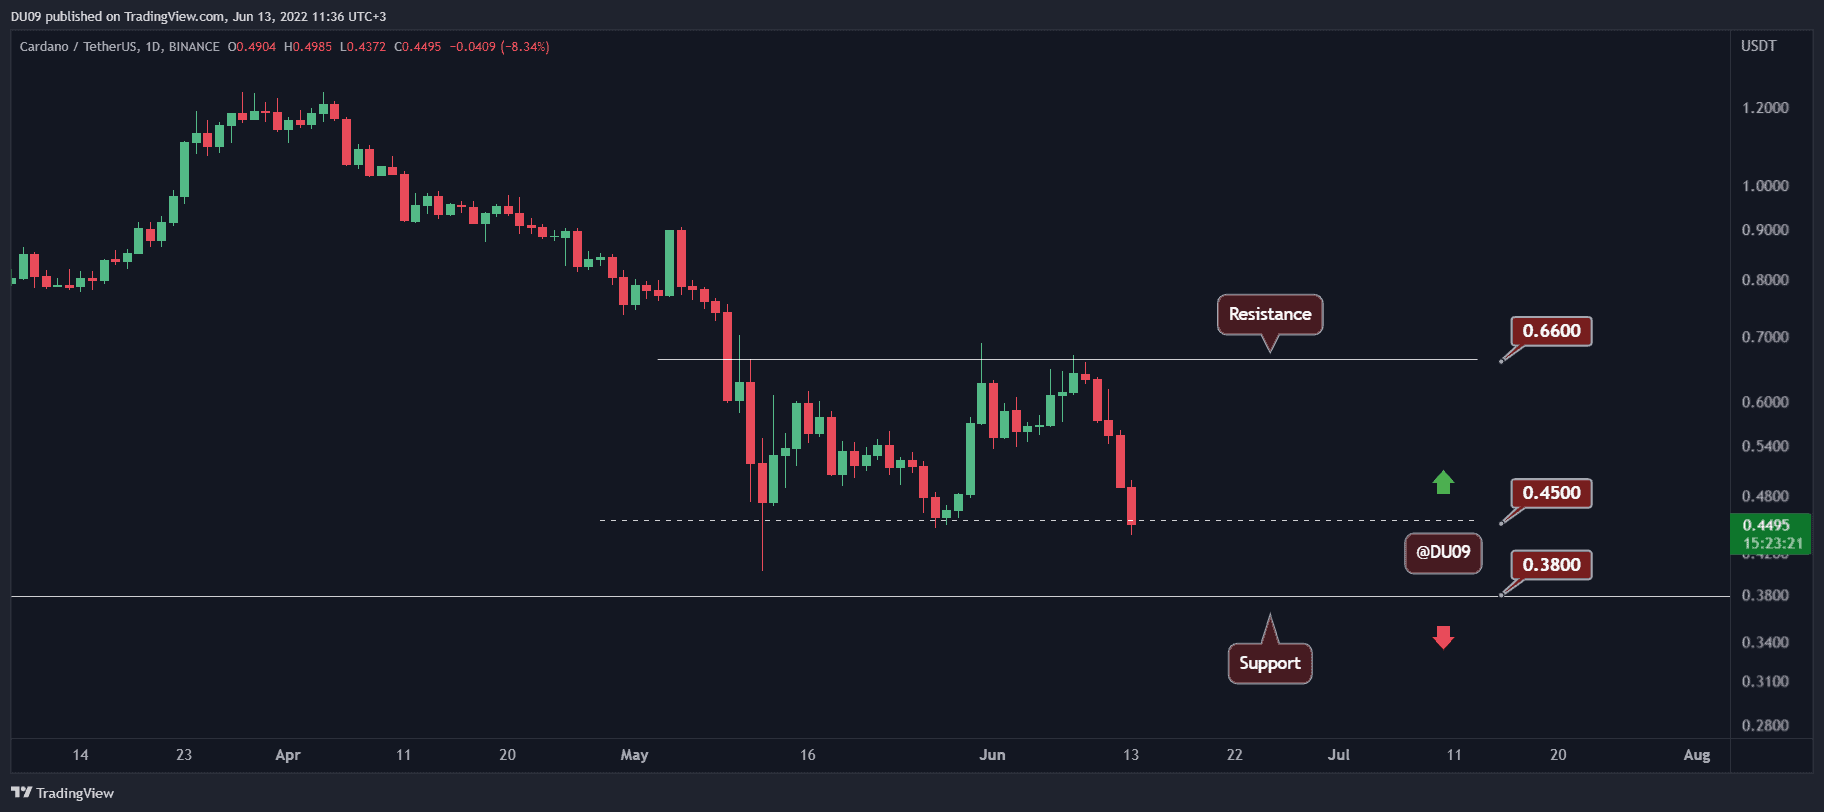
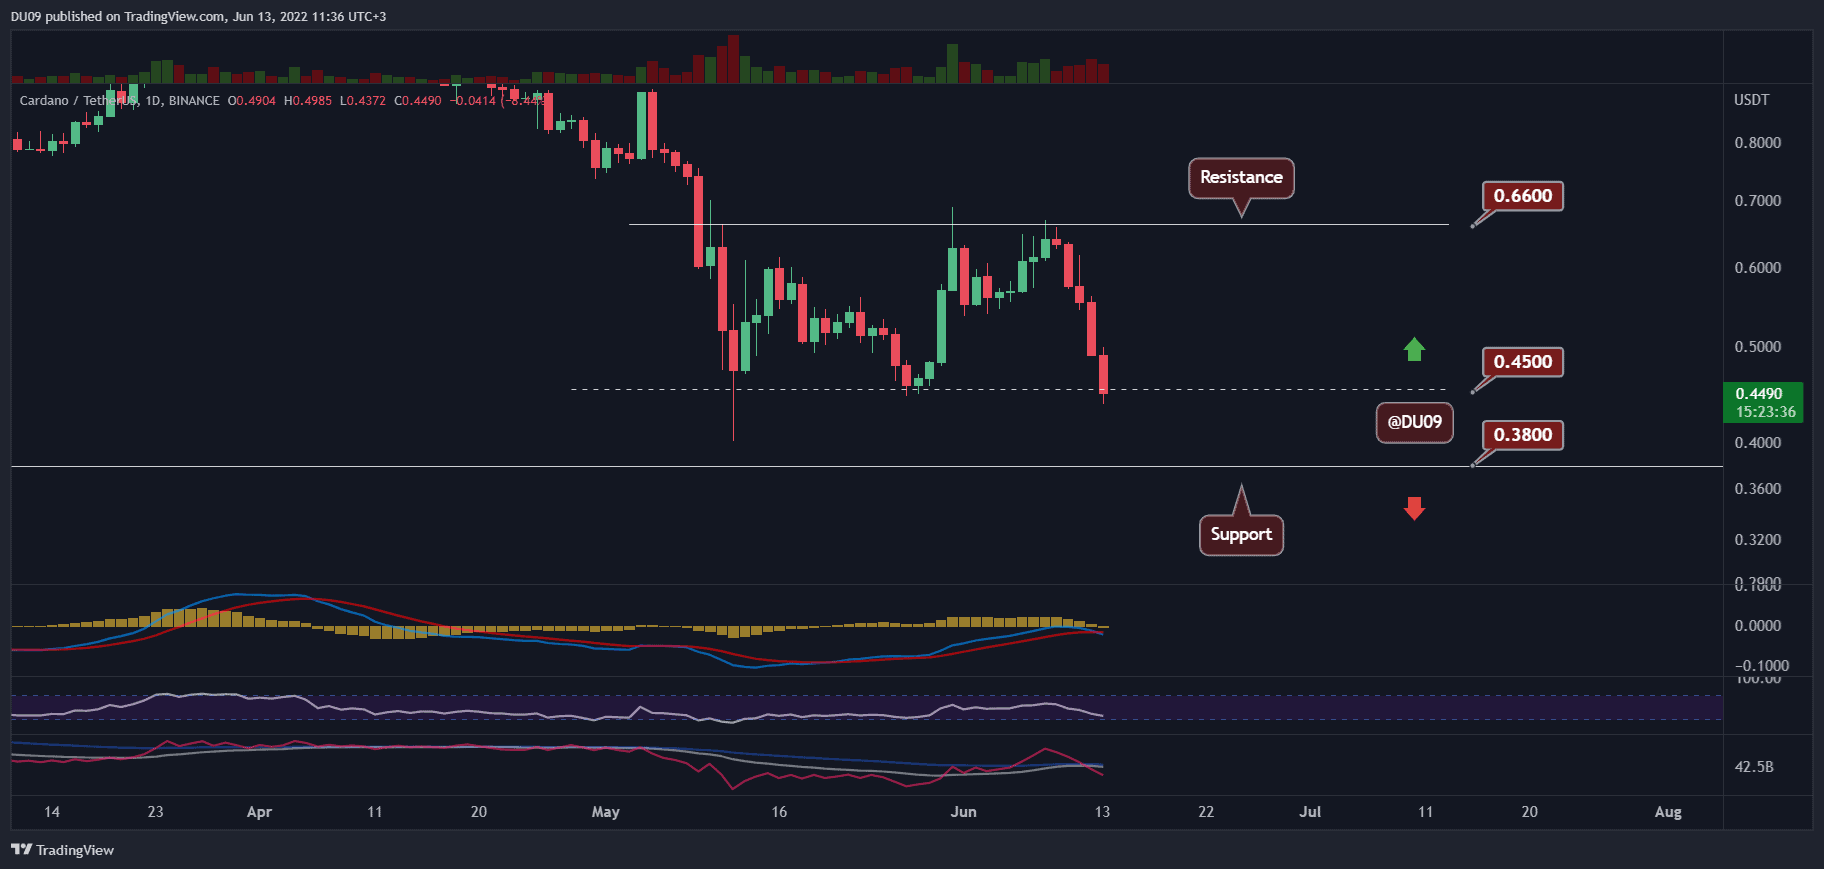
ADA could not sustain its relief rally and was quickly rejected at $0.66. Since then, the price has broken below a key support level as the market took a nosedive.
Key Support levels: $0.38, $0.34
Key Resistance levels: $0.45, $0.66
Both Bitcoin and Ethereum broke below their critical support levels this past weekend, and because of that, the whole market took a severe downturn. Cardano didn’t bode well against the selling pressure and failed to hold at $0.45, which now acts as resistance.
The next key level is found at $0.38. This is the old all-time high that ADA reached in May 2018 which should act as support.
Technical Indicators
Trading Volume: The selling volume is constant and did not spike to date. This means a bottom is likely not in yet and is still to be found.
RSI: The daily RSI is falling fast and is at 35 points now. A bounce could become likely once the RSI reaches oversold conditions (under 30 points).
MACD: The daily MACD just completed a bearish cross on the daily timeframe. This signals the downtrend will likely continue for some time.
Bias
The bias for ADA is bearish.
Short-Term Prediction for ADA Price
ADA’s price action has turned bearish, and the cryptocurrency seems more likely to continue lower in the next few days and test the key support at $0.38. Buyers have to do their best to protect this level, otherwise, ADA could fall to much lower levels.