Calm Before the Storm? ETH Flat Above $1.8K (Ethereum Price Analysis)
The price of Ethereum has been held by the 100-day moving average, which has prevented further decline for several months.
However, despite multiple attempts, the cryptocurrency has been unable to surpass the crucial resistance level at $2K, indicating a lack of demand.
Technical Analysis
By Shayan
The Daily Chart
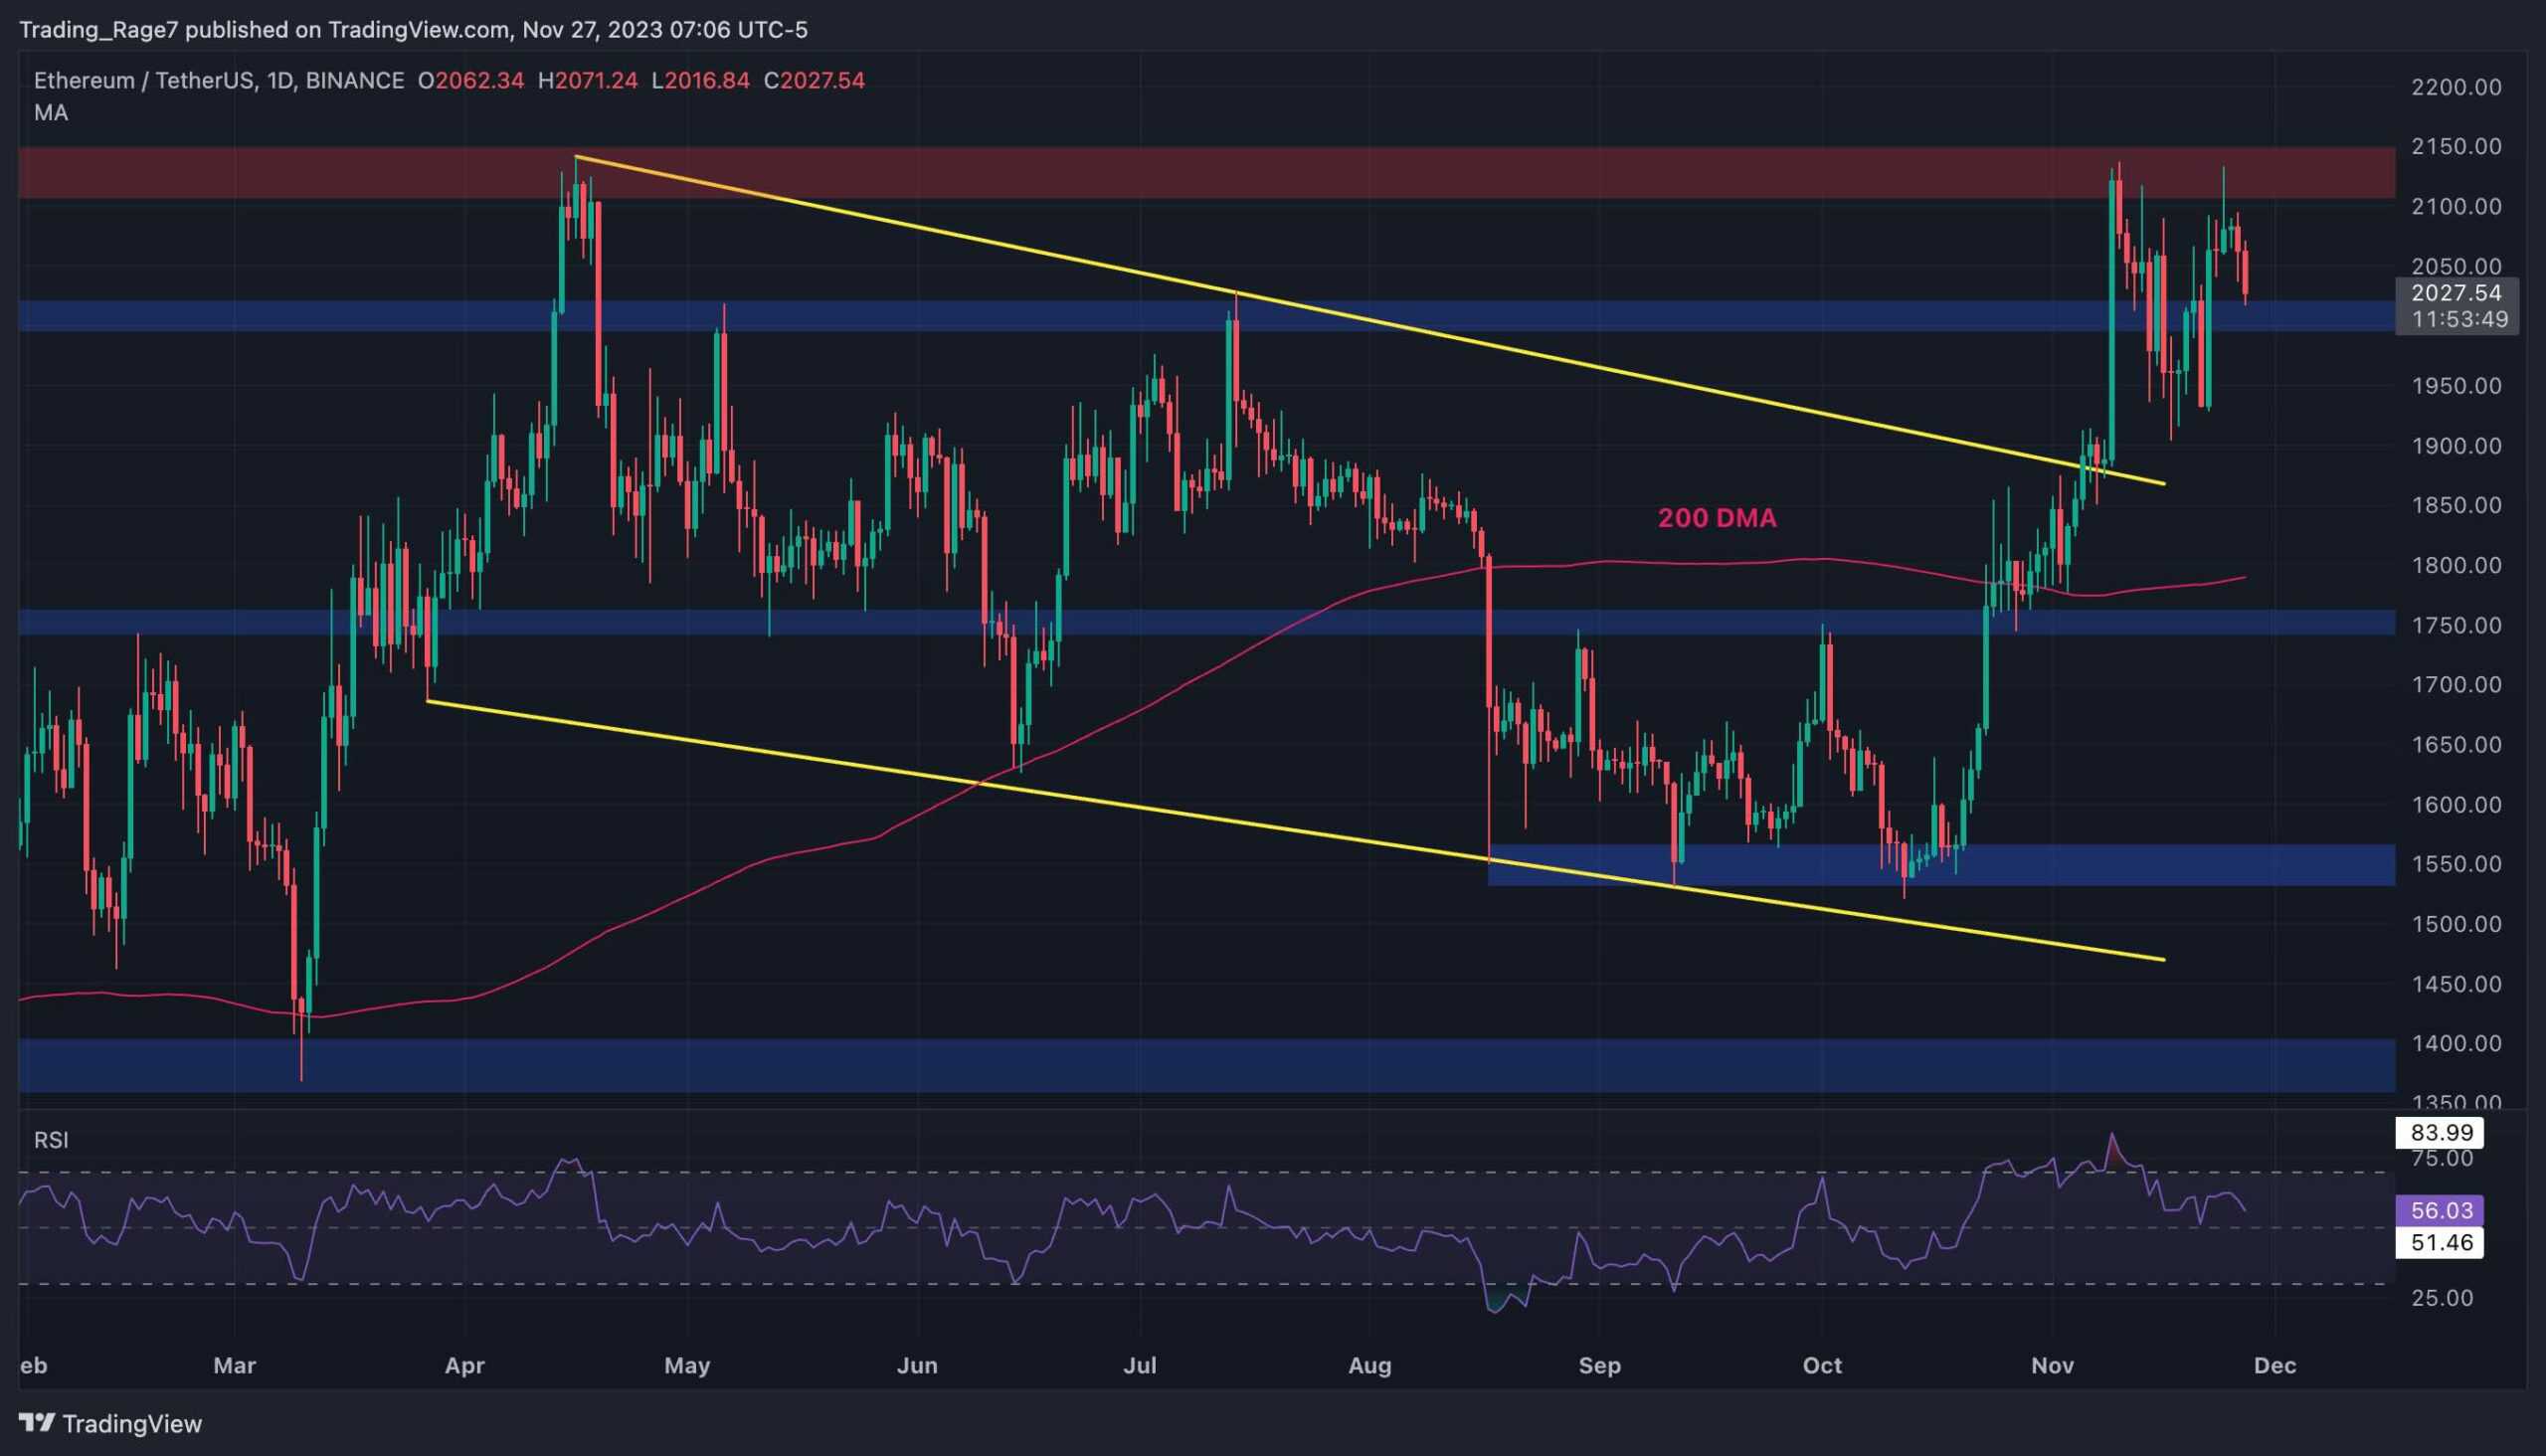
On the daily chart, the price faced rejection after the third attempt to break through the $2K resistance region within the last month. This rejection coincided with a decline in bullish momentum, attributed to increased selling pressure around that level, resulting in minor rejections and relatively stable price action.
The 100-day MA, currently at $1,854, has consistently provided support and prevented further declines over the past few weeks. Nevertheless, the breakout from the significant price range between the 100-day MA and the $2K resistance level will likely play a crucial role in determining Ethereum’s prospects in the mid-term.

The 4-Hour Chart
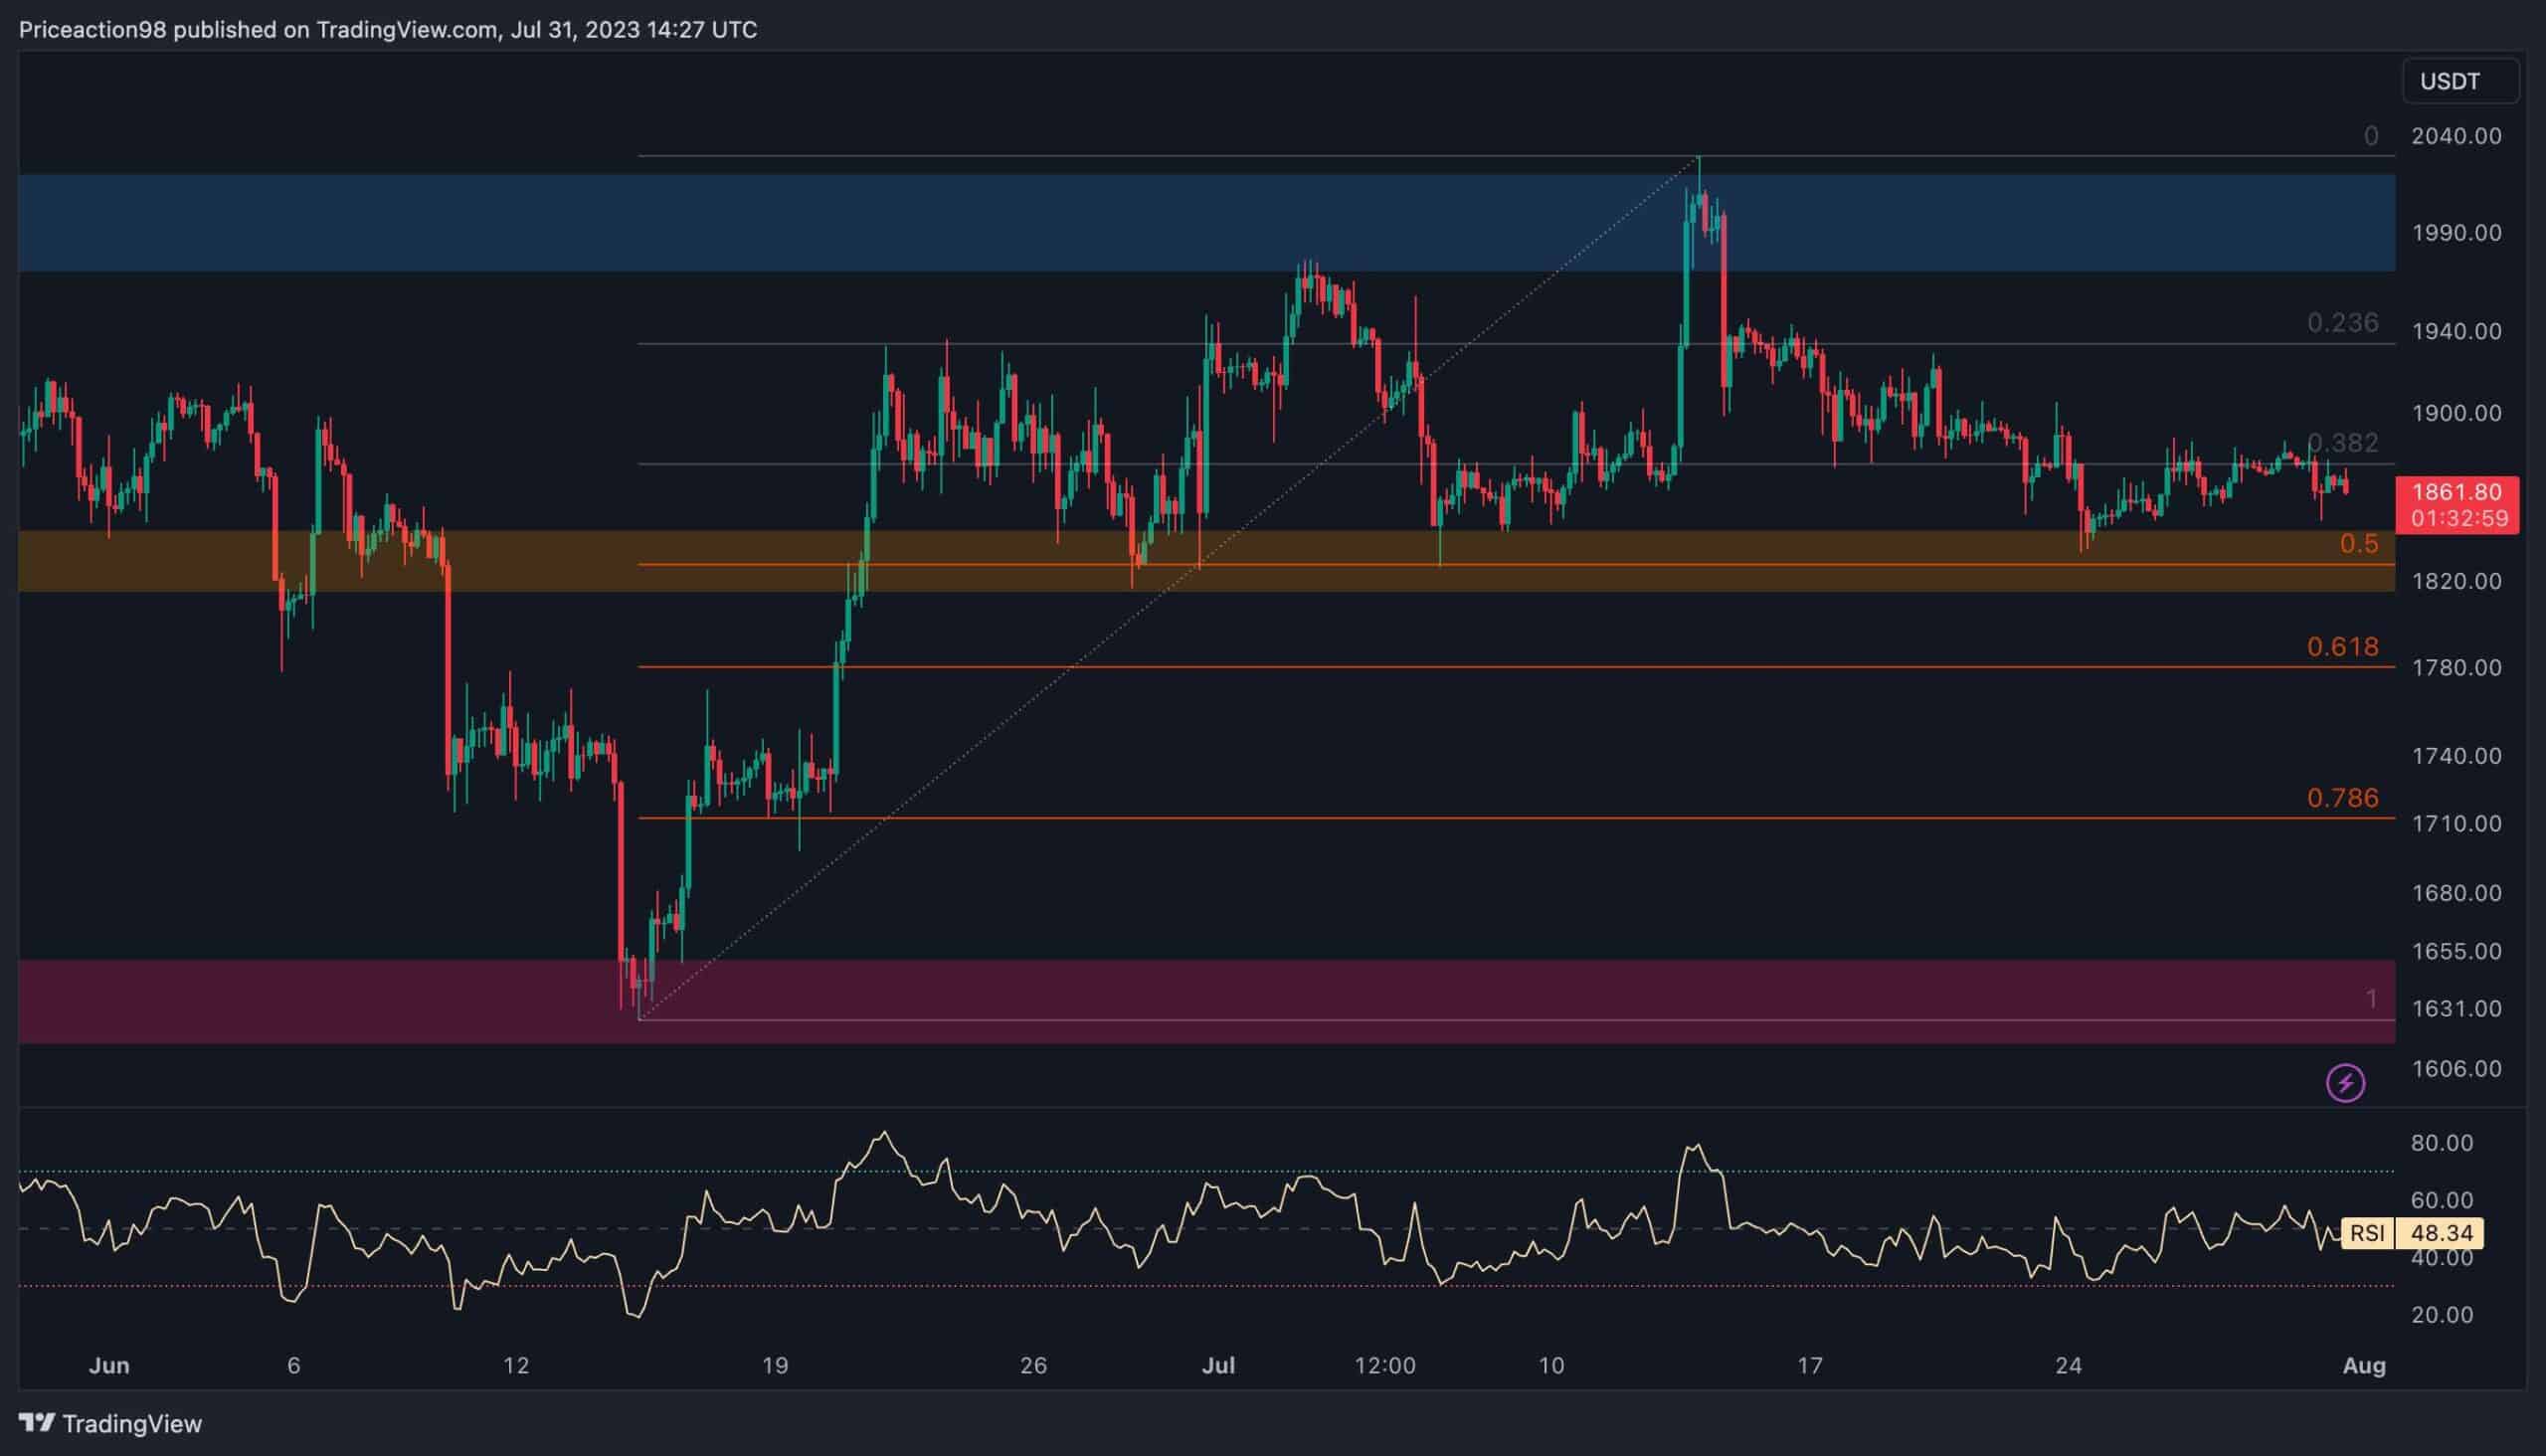
Meanwhile, on the 4-hour chart, Ethereum experienced a bullish rally in mid-June, leading to a test of the major resistance at $2K in mid-July. However, it is now facing the 0.5 Fibonacci retracement level at $1827, which serves as significant support for the price.
However, ETH remains trapped between two critical price levels: the static resistance at $2K and the critical support at $1,850. This suggests the possibility of a range-bound market characterized by consolidation candles.
Nonetheless, the price seems more likely to continue trading within this range until a breakout occurs, providing insight into Ethereum’s upcoming direction. In the event of a break below the 50% Fibonacci level, the next potential stop for Ethereum could be the 61.8% level at $1780.
The post Calm Before the Storm? ETH Flat Above $1.8K (Ethereum Price Analysis) appeared first on CryptoPotato.