BTC Pumps Toward $31K But is a Correction Imminent? (Bitcoin Price Analysis)
After an extended period of consolidation, Bitcoin’s price has successfully surpassed the critical $30K resistance level. However, it is important to exercise caution within the market, particularly in the short term.
Technical Analysis
By: Edris
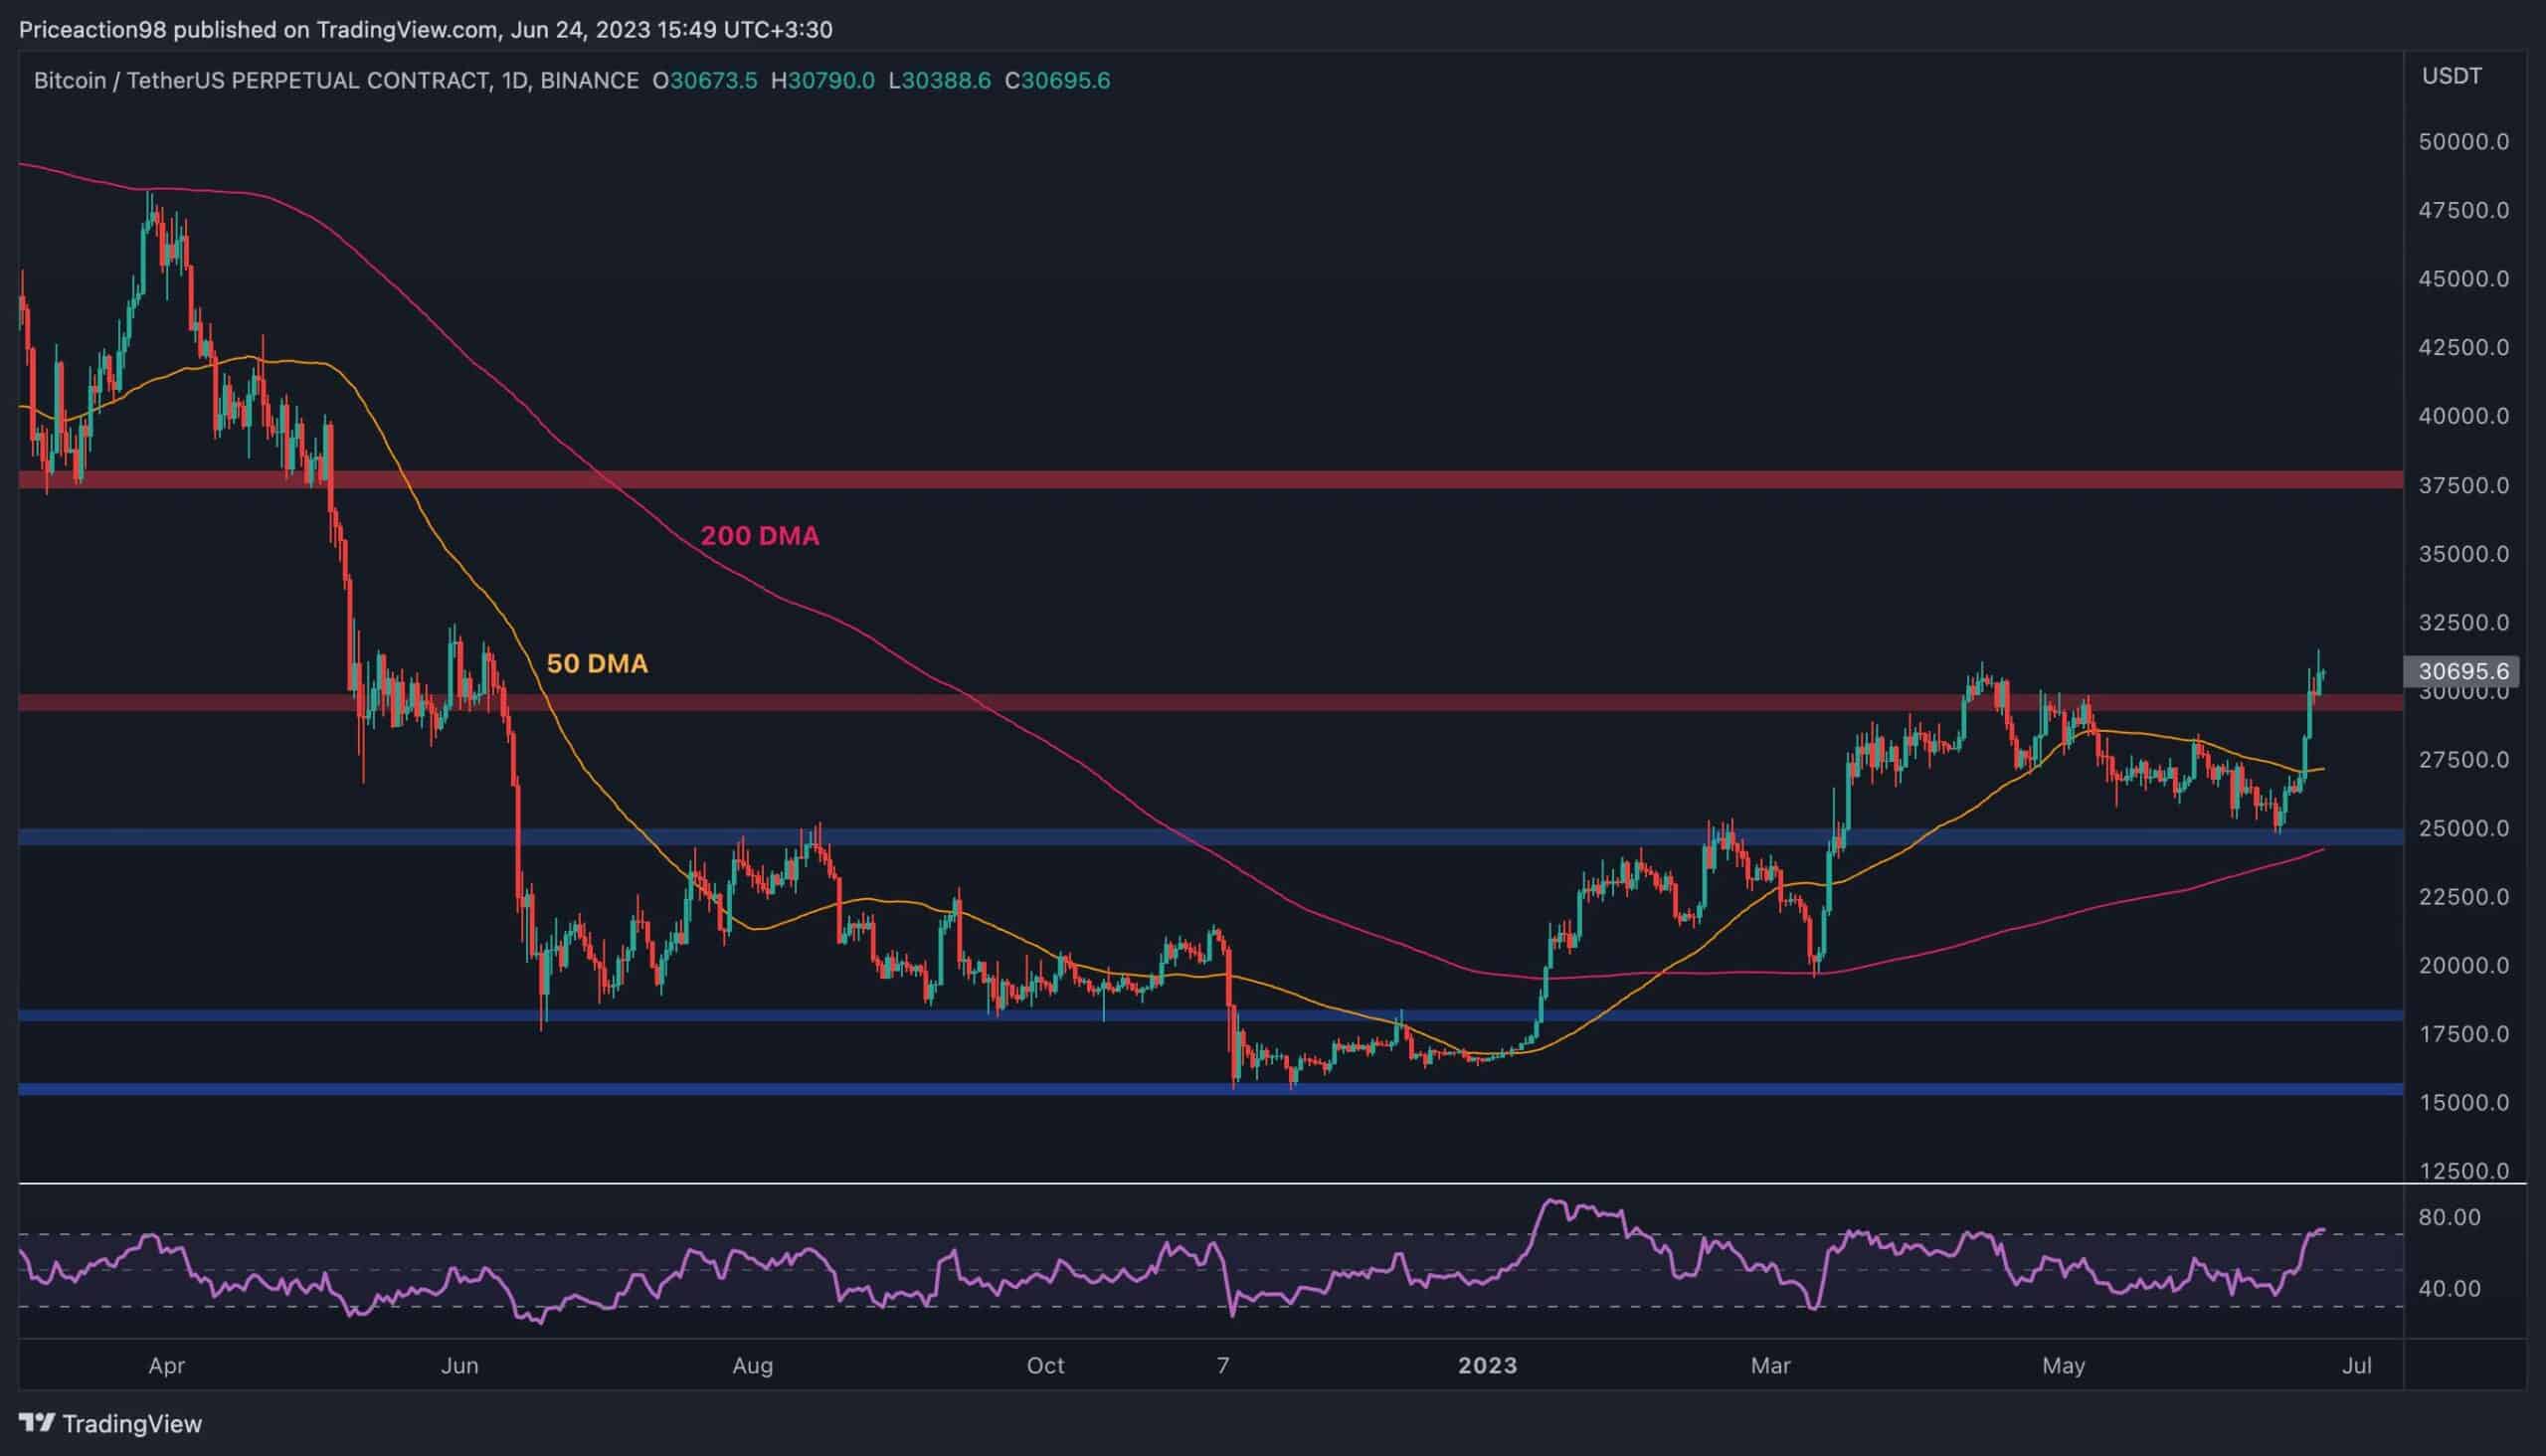
The Daily Chart
On the daily timeframe, Bitcoin’s price has experienced a rapid upward movement in the past week, following a strong bounce from the $25K support level. The resistance at $30K has been exceeded, and the price is attempting to maintain its position above it.
However, the RSI indicator currently signals an overbought condition, suggesting a probable correction. If it occurs, the 50-day moving average might act as a support level around $27,500, followed by the 200-day moving average near the $25K region.
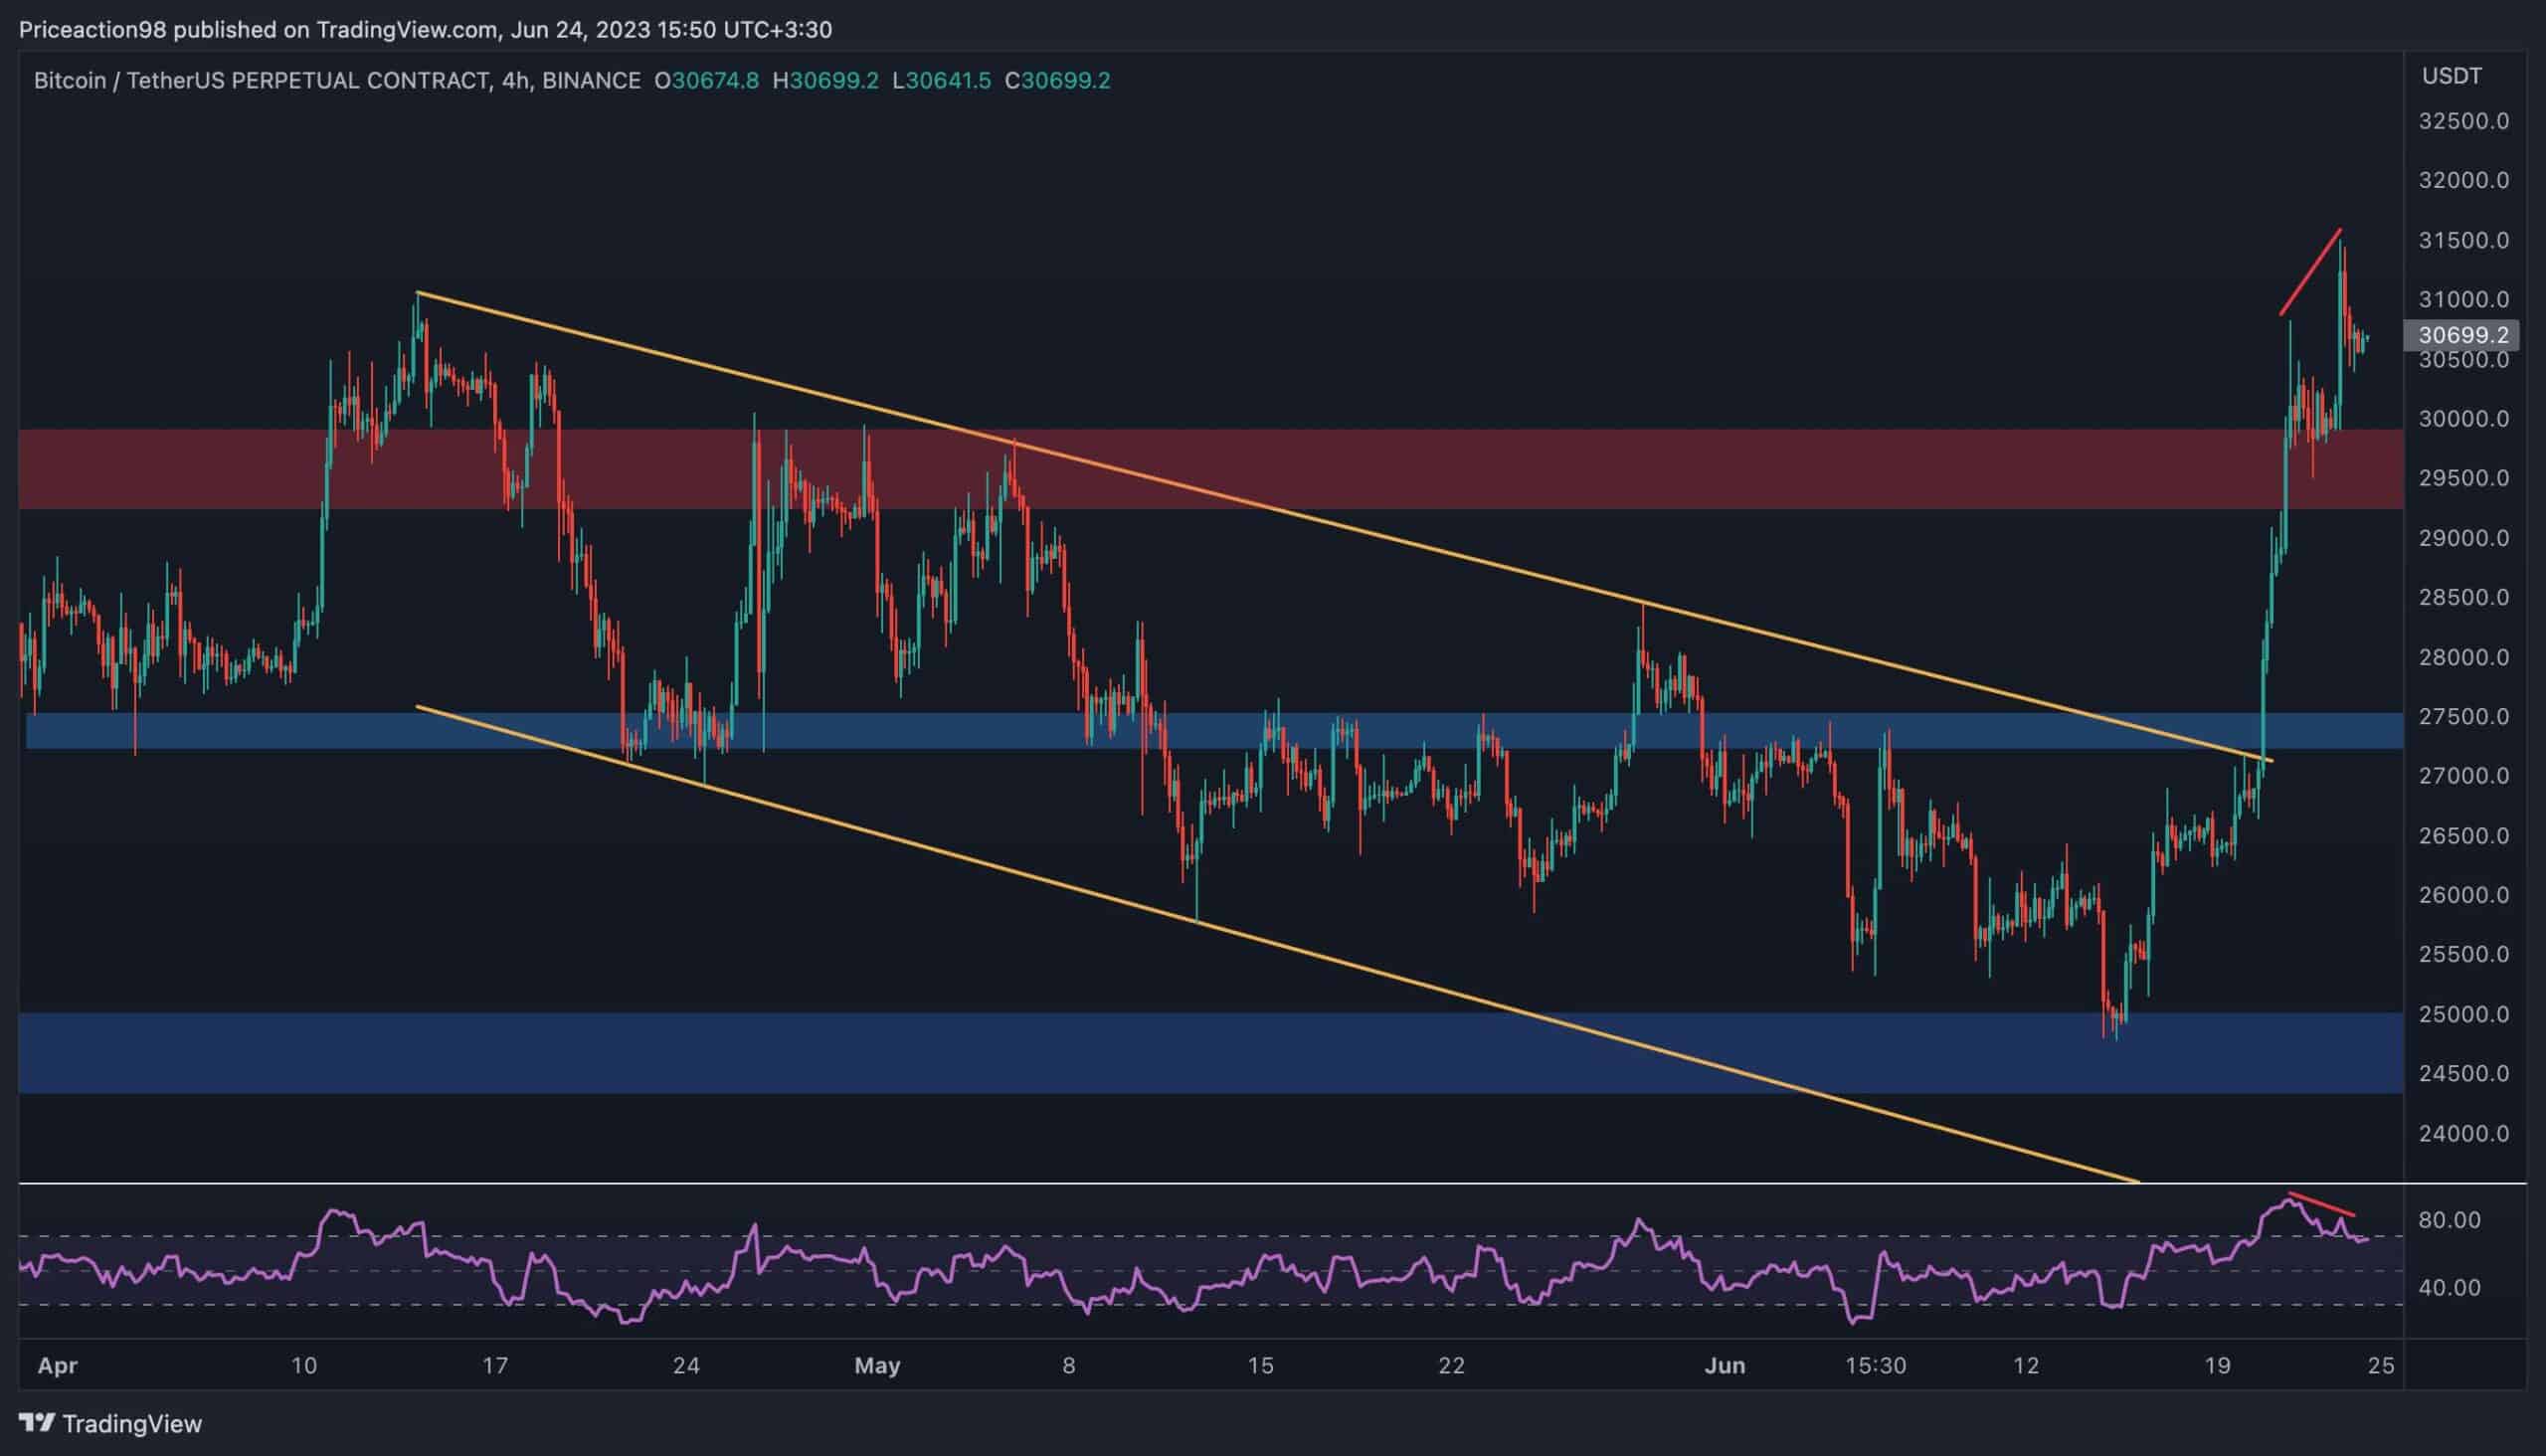
The 4-Hour Chart
The 4-hour timeframe reflects a similar scenario to the daily chart, with a strong upward movement and breakthrough of resistance levels. The recent rally commenced following the breakout from the descending channel, propelling the price to higher highs above $30K.
Nevertheless, it is important to exercise caution due to a clear bearish divergence observed on the RSI indicator. This suggests the possibility of consolidation or correction shortly, prompting investors to remain vigilant.
On-chain Analysis
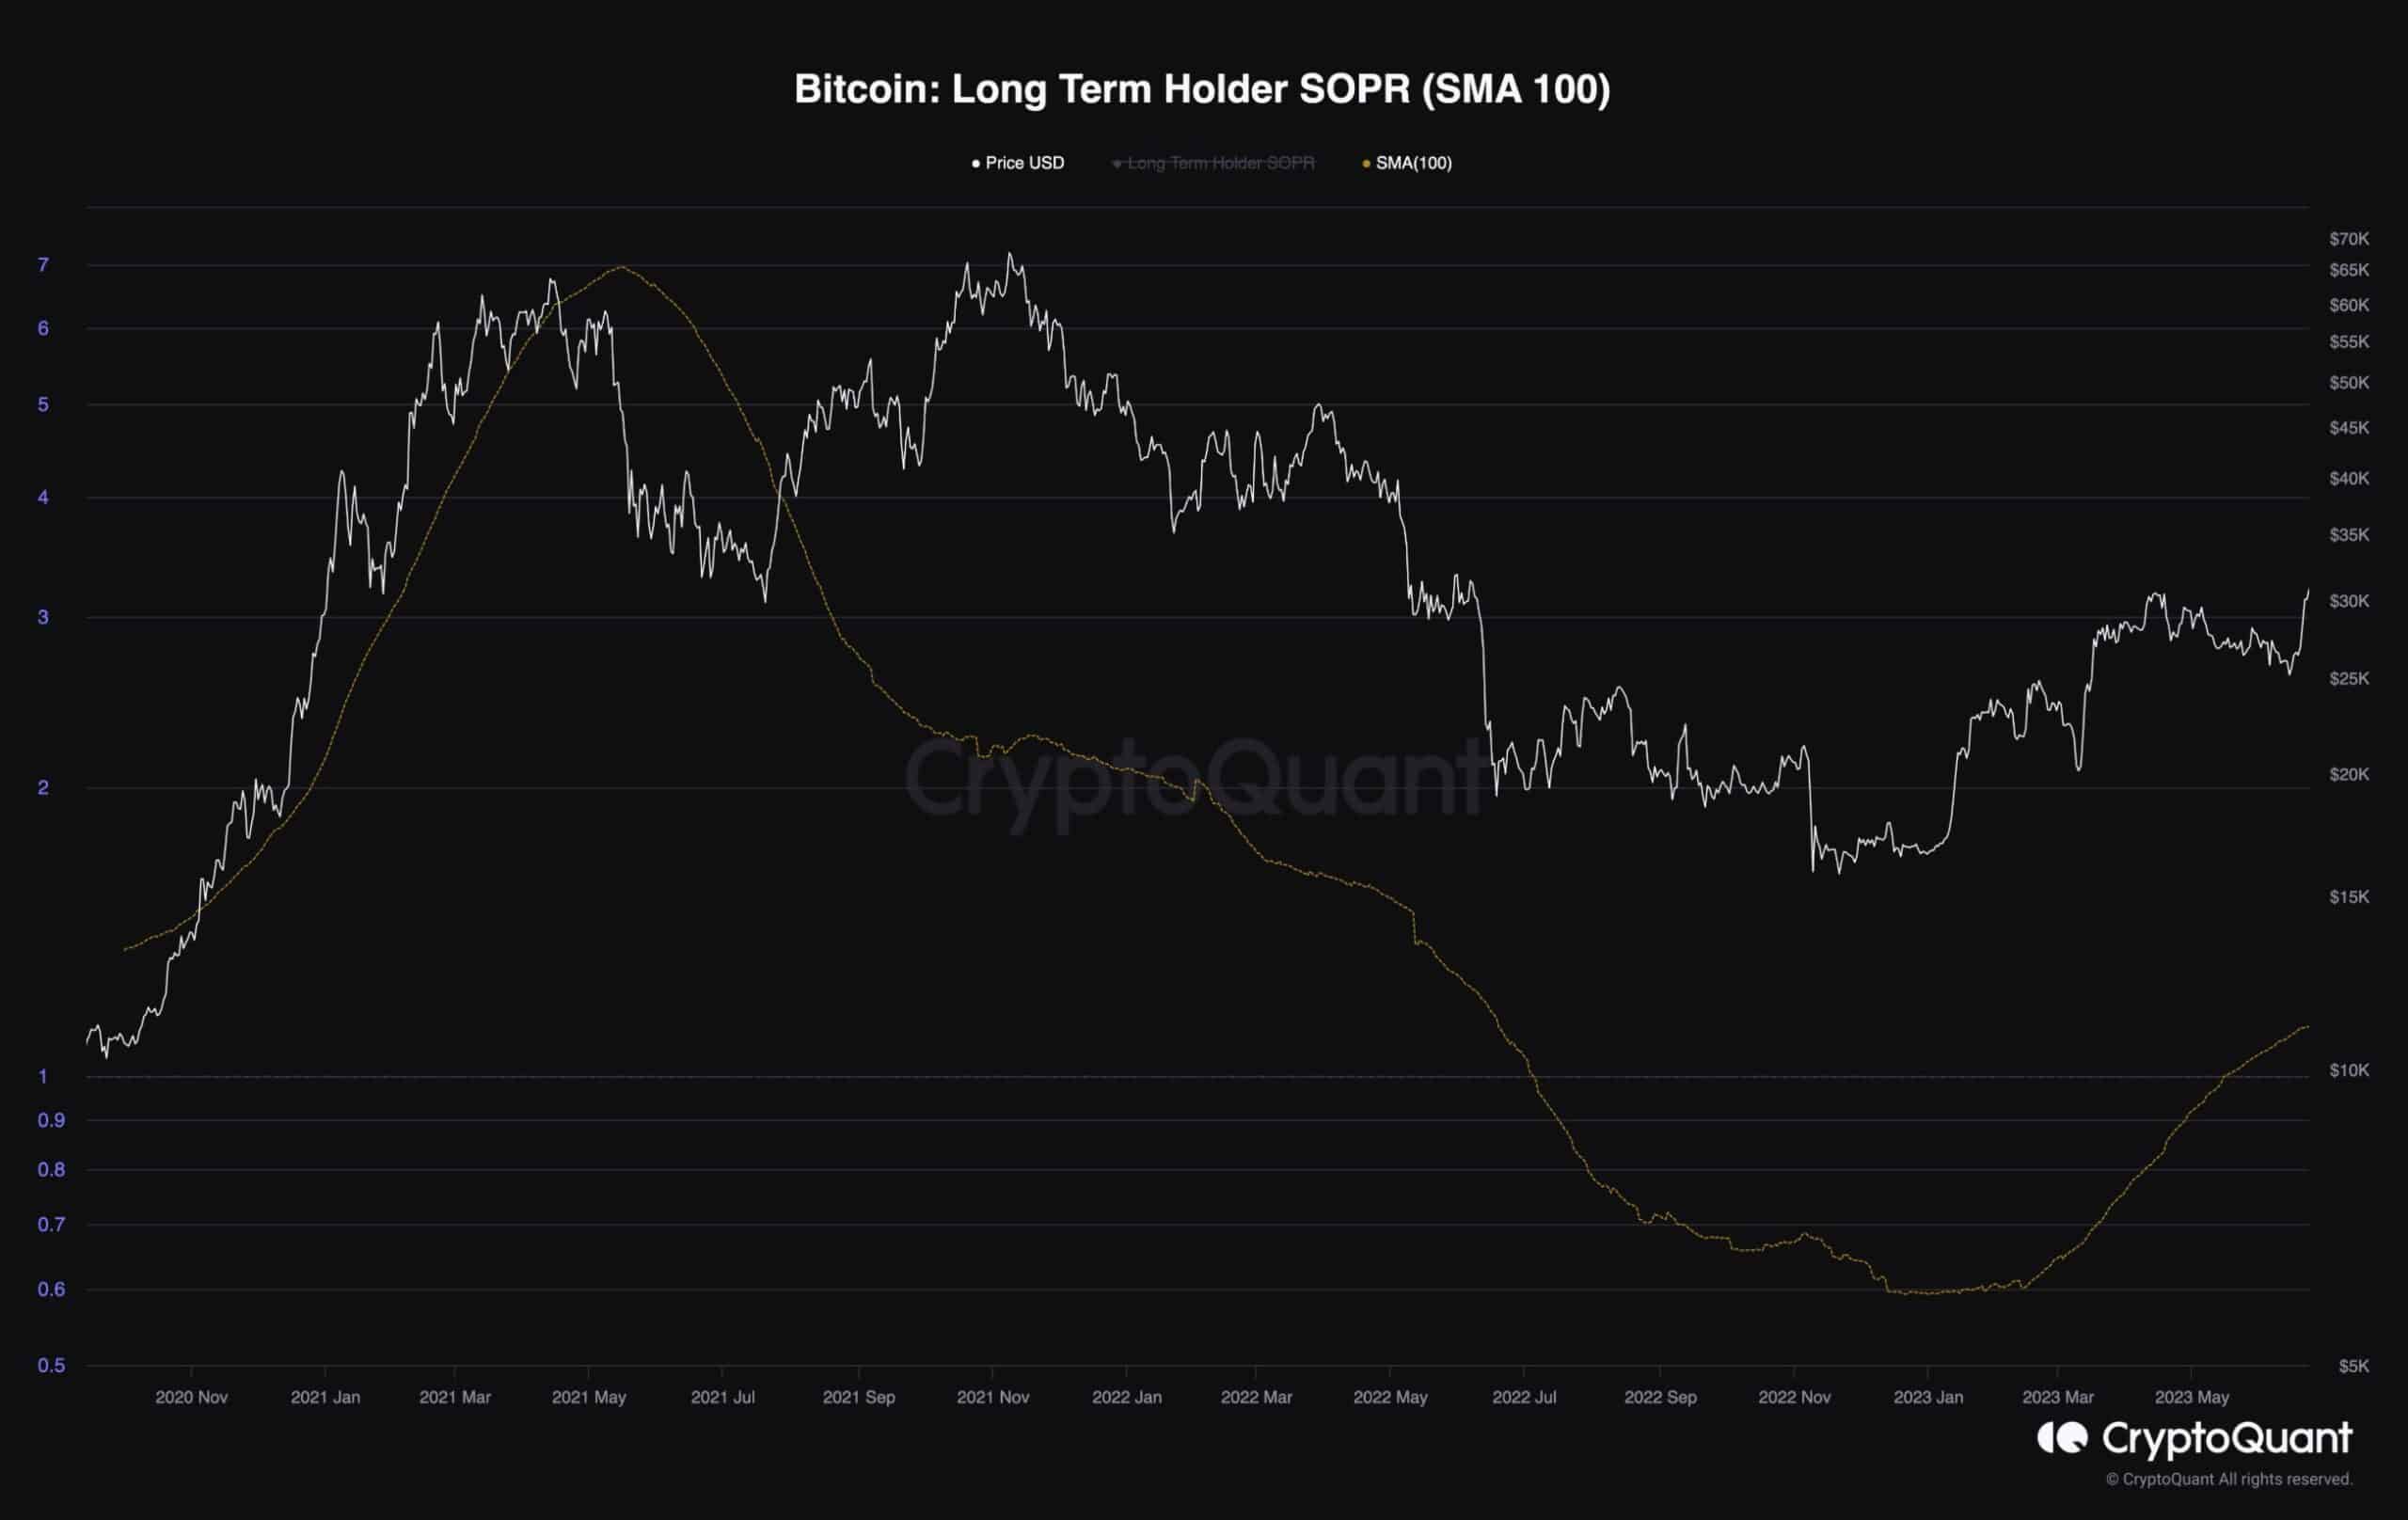
Bitcoin Long-term holder SOPR
After Bitcoin’s recent rally, many holders who had been experiencing losses for several months are now able to sell and realize profits.
The Long-term holder SOPR metric, depicted in the chart along with a 100-day moving average, indicates the ratio of profits or losses realized by long-term holders. Values above 1 indicate profit-taking, while values below 1 signify losses.
The chart clearly shows that long-term holders, who had been experiencing losses for nearly a year, have now begun to sell at a profit due to the recent price surge. While this situation is not necessarily harmful, it could increase the supply of Bitcoin, and without sufficient demand, it could potentially lead to a subsequent decline in price.
The post BTC Pumps Toward $31K But is a Correction Imminent? (Bitcoin Price Analysis) appeared first on CryptoPotato.