BTC Price Analysis: September Monthly Candle Likely Close In Red, How Bad Is It For Bitcoin?
September has never been a particularly great month for Bitcoin’s price historically, and this year has cemented that fact.
Assuming prices will remain where they are at the close, Bitcoin prices will be down 7.5% from the monthly open. Last year during September, the asset fell 13.5% and the year before that it was down 5.96%.
In spite of this, however, the leading crypto could possibly end the quarter with the second-highest close ever if it can stay above $10,590 – according to data from Skew.
While it’s highly unlikely we’ll see it break the current all-time high from Q4 of 2017 at $13,660 this time around, we are about to enter into one of Bitcoin’s better-performing months which might just give us that new yearly high we’ve all been hoping for.
Bitstamp BTC/USD 4-Hour Chart
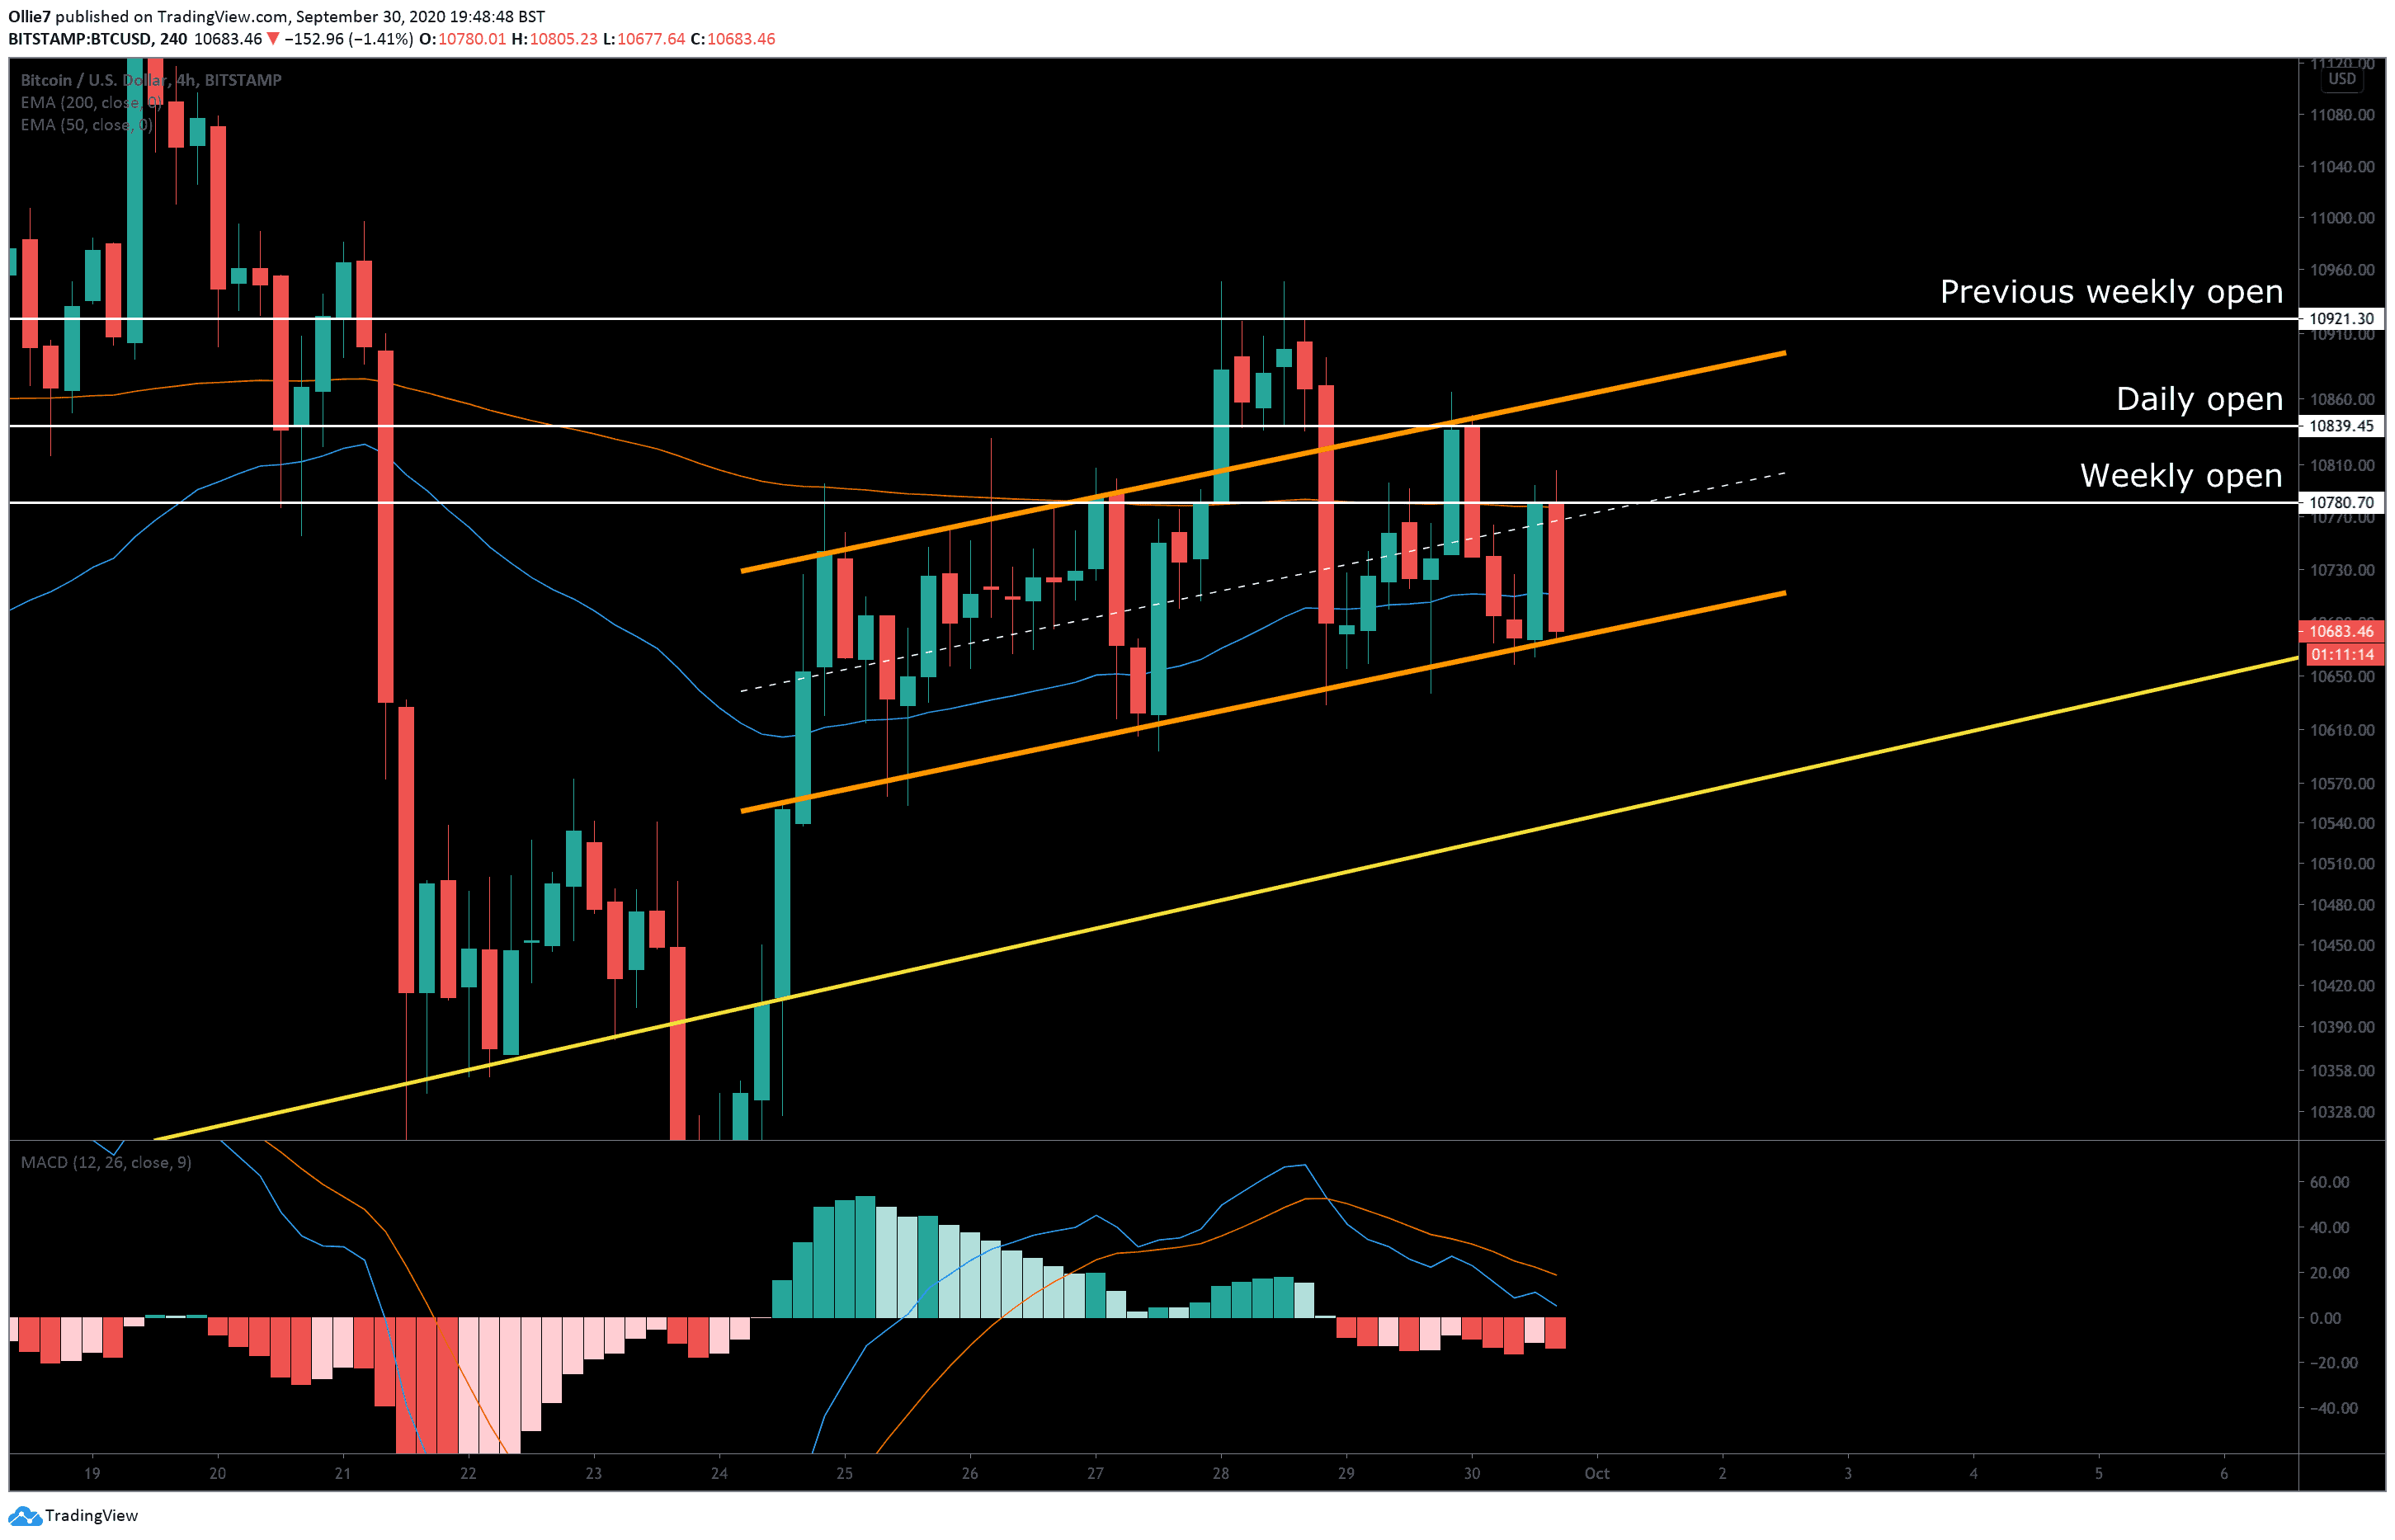
BTC Price Levels to Watch in the Short-term
On the 4-hour BTC/USD chart, we can see that Bitcoin’s price still remains inside the rising channel (orange) and has recently returned to the lower channel support at $10,680 following a sharp rejection at the weekly open resistance ($10,780).
This particular price point is also being reinforced by the 200-EMA, which will make this level even more difficult to break in the short-term.
The median line of the channel (dashed white line) will now likely act as a temporary resistance as bullish traders attempt to recover from the dip.
Looking further down, if selling momentum continues to rise over the next few candles we could see BTC get kicked out of the channel. In that event, the $10,570 level may create a reaction as it has acted as both a support and resistance in the last 9 days. Right under that, we also have the much-larger channel support (yellow) which should halt any further decline (for now).
Over the short-term, we should wait until BTC prints a new higher high above $10,780 and the daily open at $10,839 before assuming the intra-week trend has turned bullish.
Total market capital: $348 billion
Bitcoin market capital: $198 billion
Bitcoin dominance: 57.0%
*Data by Coingecko.
The post BTC Price Analysis: September Monthly Candle Likely Close In Red, How Bad Is It For Bitcoin? appeared first on CryptoPotato.