BTC Must Hold this Level, Otherwise $25K Breakdown is Likely (Bitcoin Price Analysis)
Bitcoin’s price shows a very low intent to recover following the recent drop last week. Things are not looking positive in the short term.
Technical Analysis
By Edris
The Daily Chart
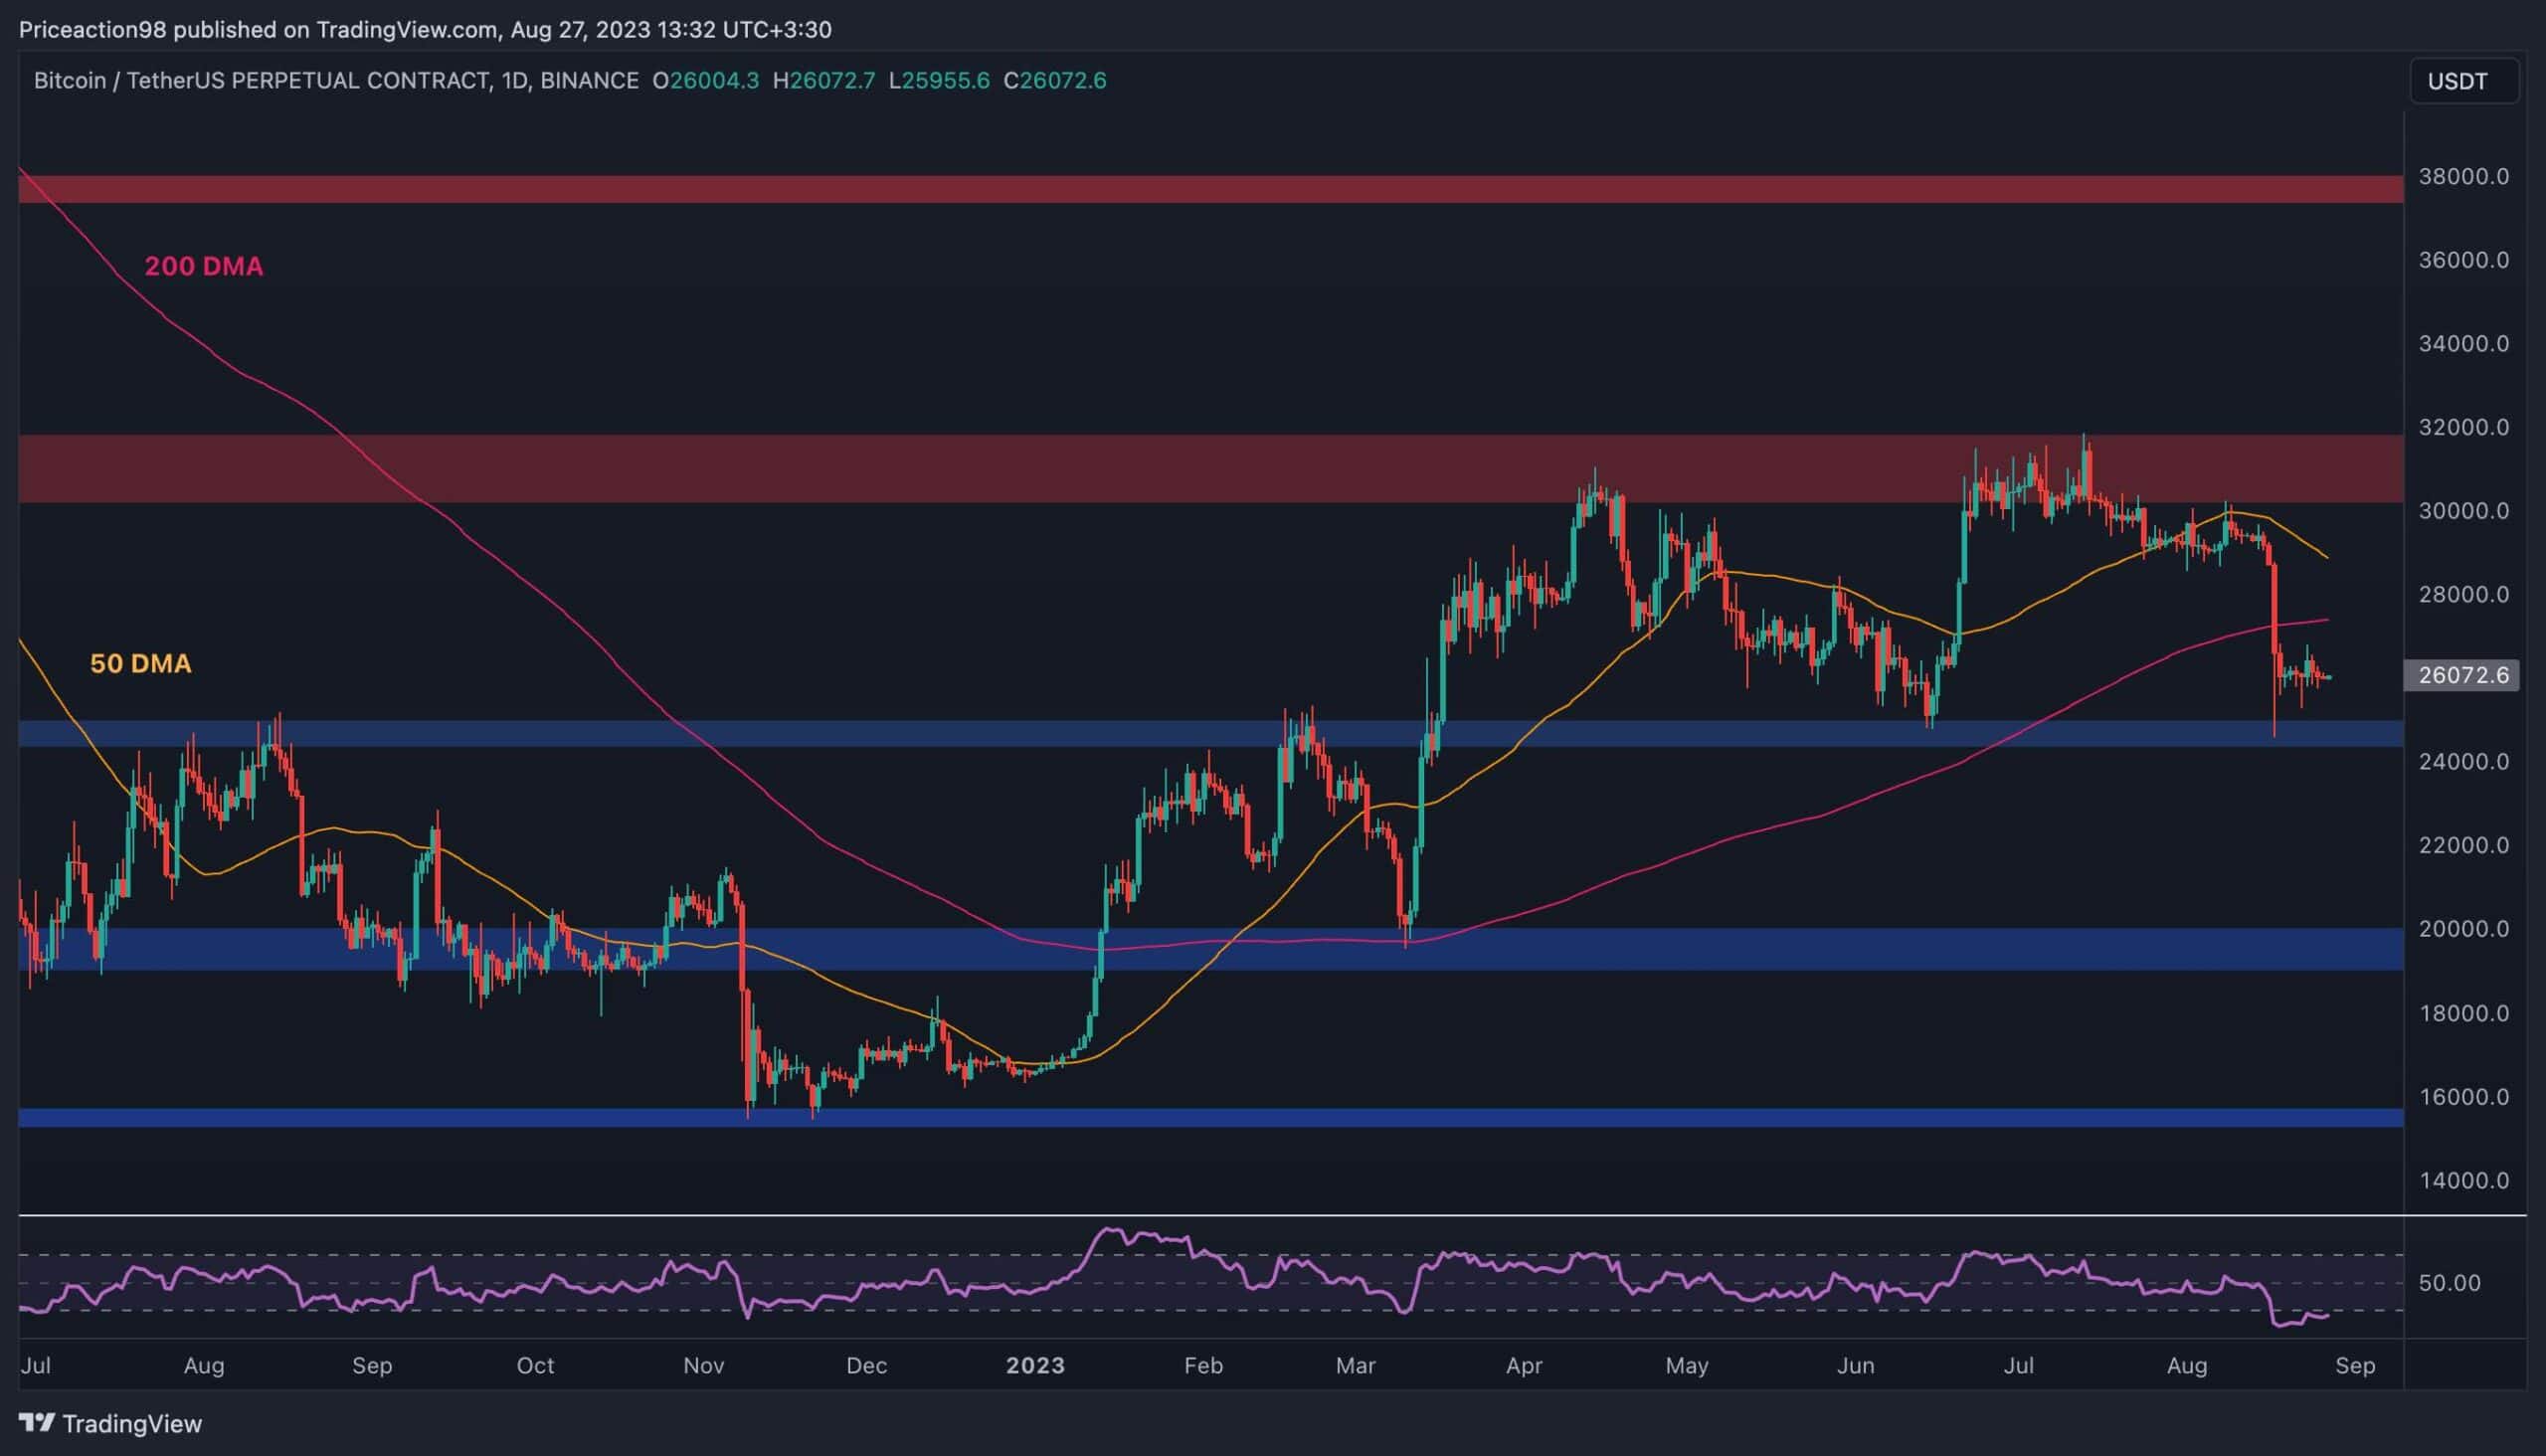
On the daily chart, the price has been consolidating inside a tight range over the last few days, following a massive drop from the $30K critical resistance zone. The 200-day moving average has also been broken to the downside, which is a clear bearish trend signal.
Yet, considering the oversold signal demonstrated by the RSI, the price will probably retrace higher in the short term. A retest of the 200-day moving average is highly likely, and if the price fails to climb above it, a deeper decline could be expected in the coming weeks with a potential drop back towards the key $20K support level.
The 4-Hour Chart
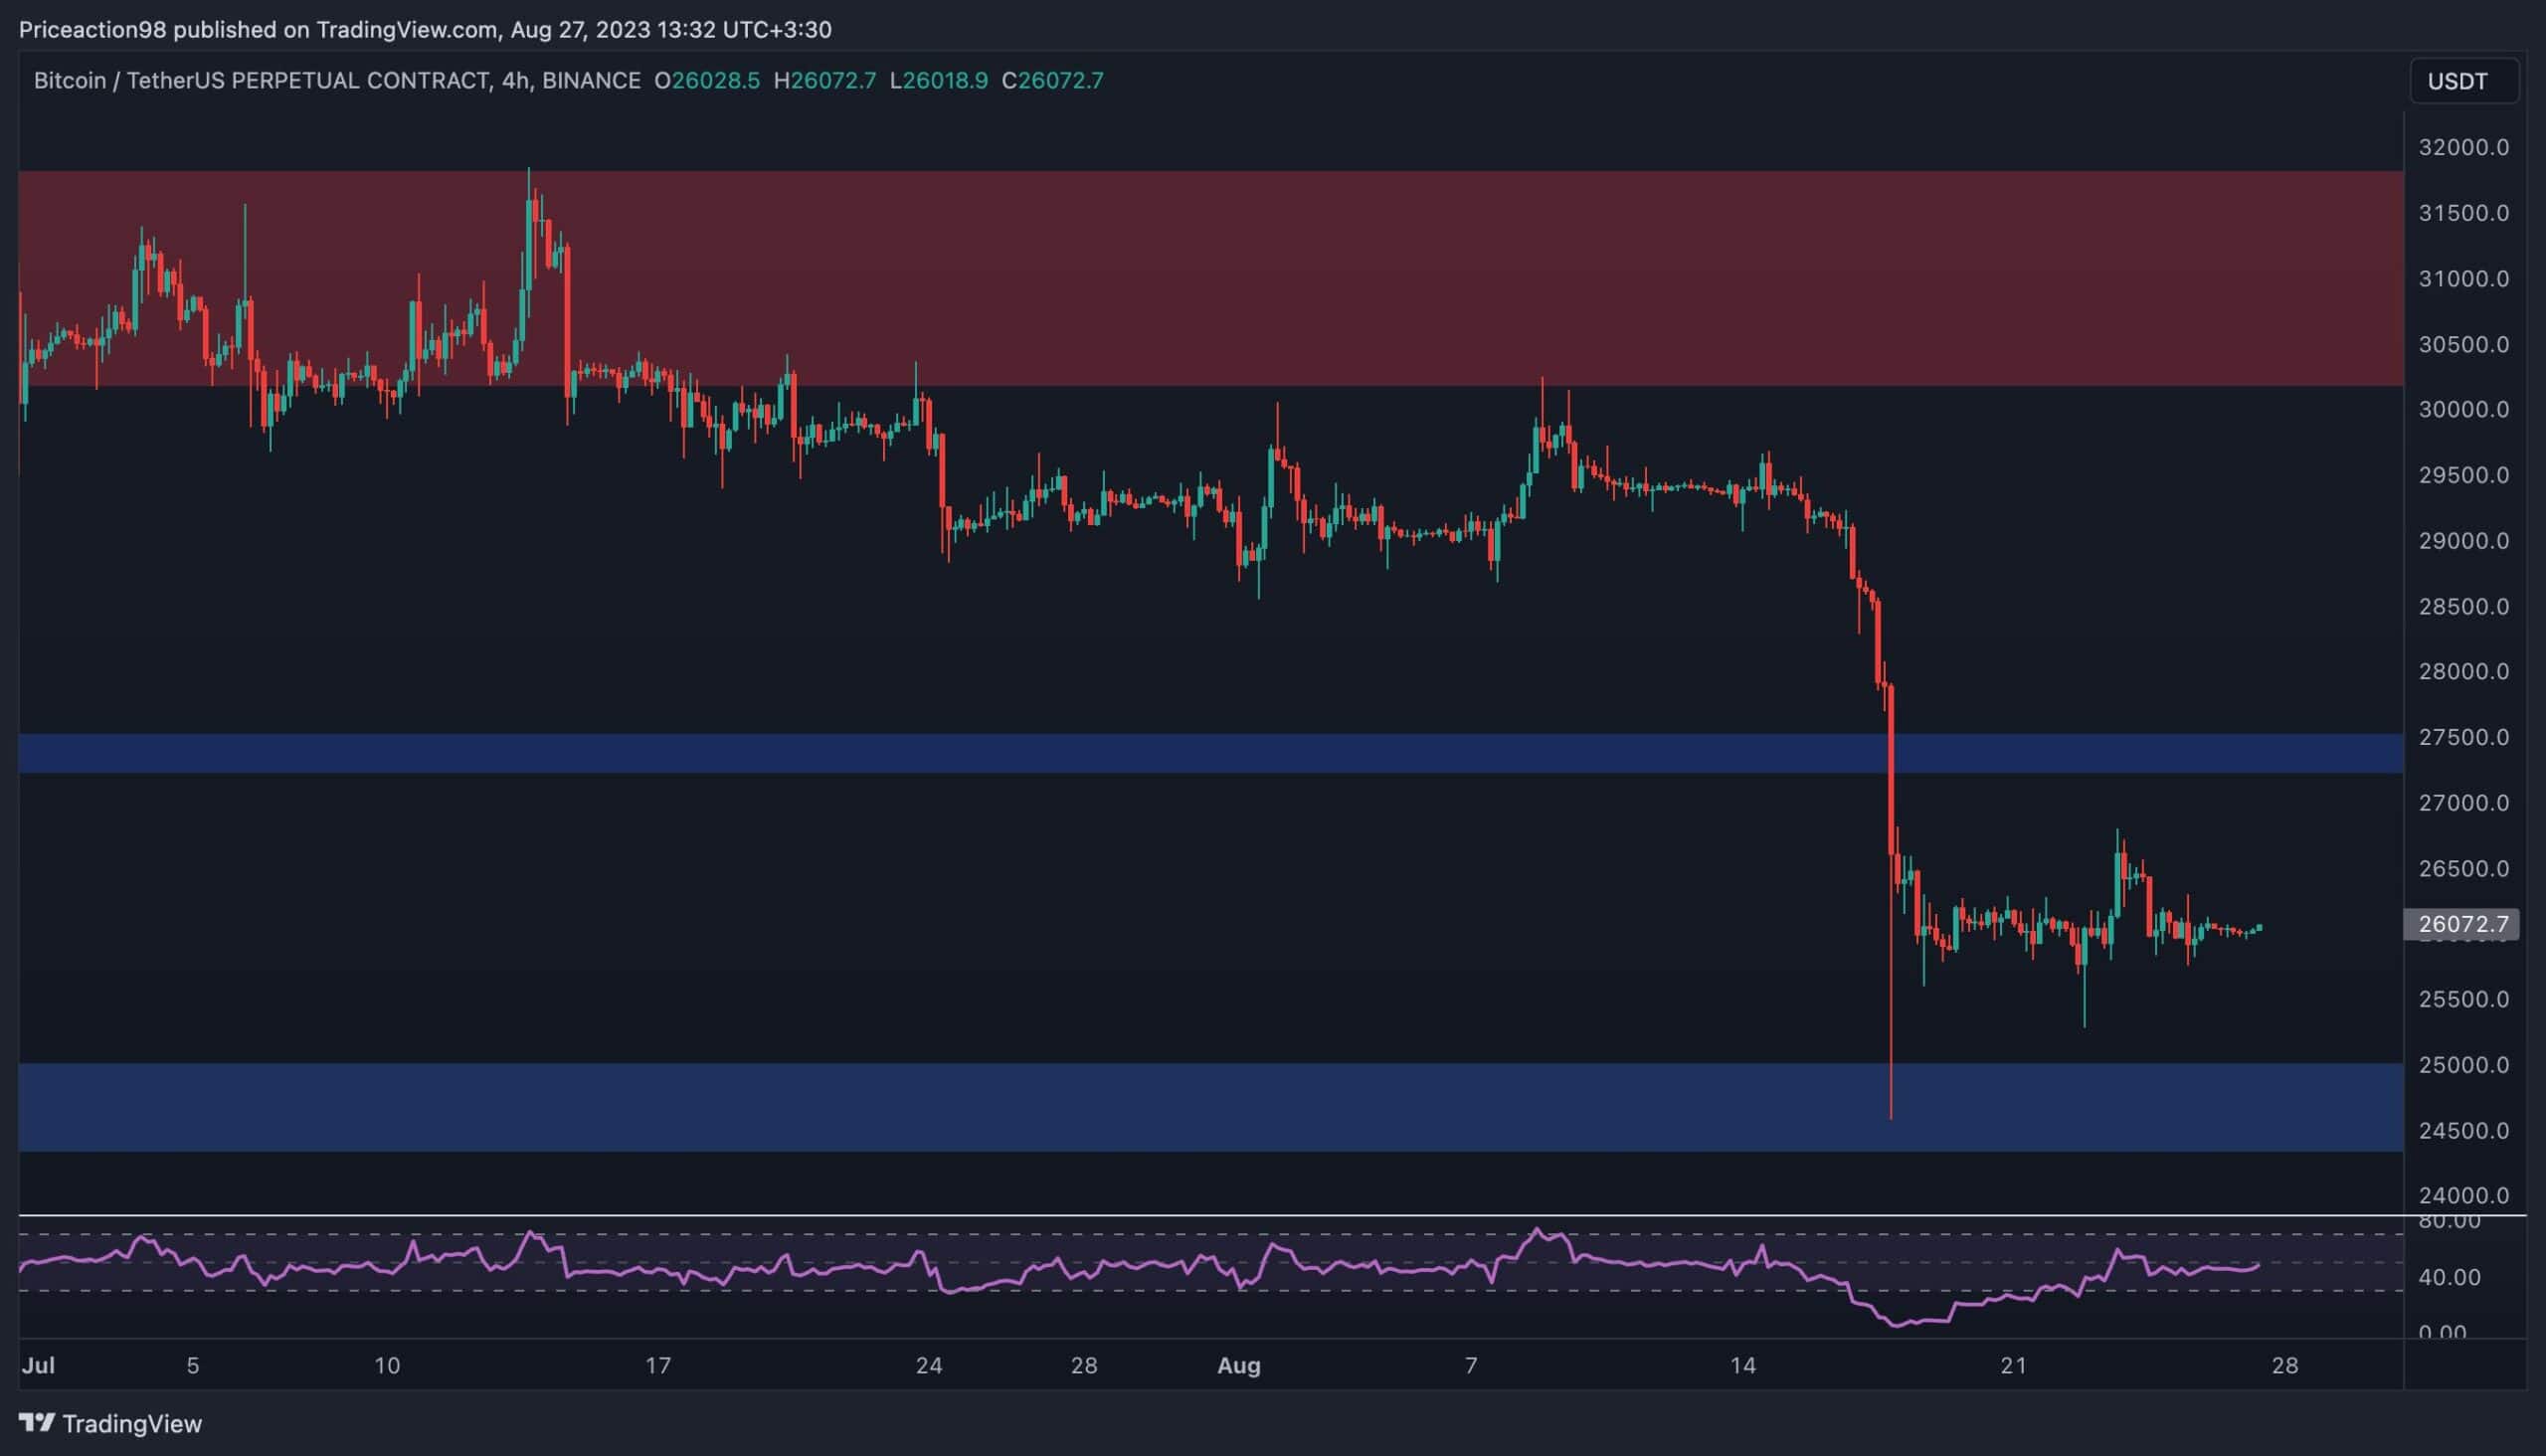
Looking at the 4-hour timeframe, it is evident that the price has been ranging between the $27,500 and the $25,000 levels over the last few days. If the market climbs above the $27,500 resistance level in the next few weeks, the significant $30K zone will likely be tested again.
However, judging by the overall market structure, a further bearish continuation would be highly probable if the $25K level fails to hold.
On-Chain Analysis
By: Edris
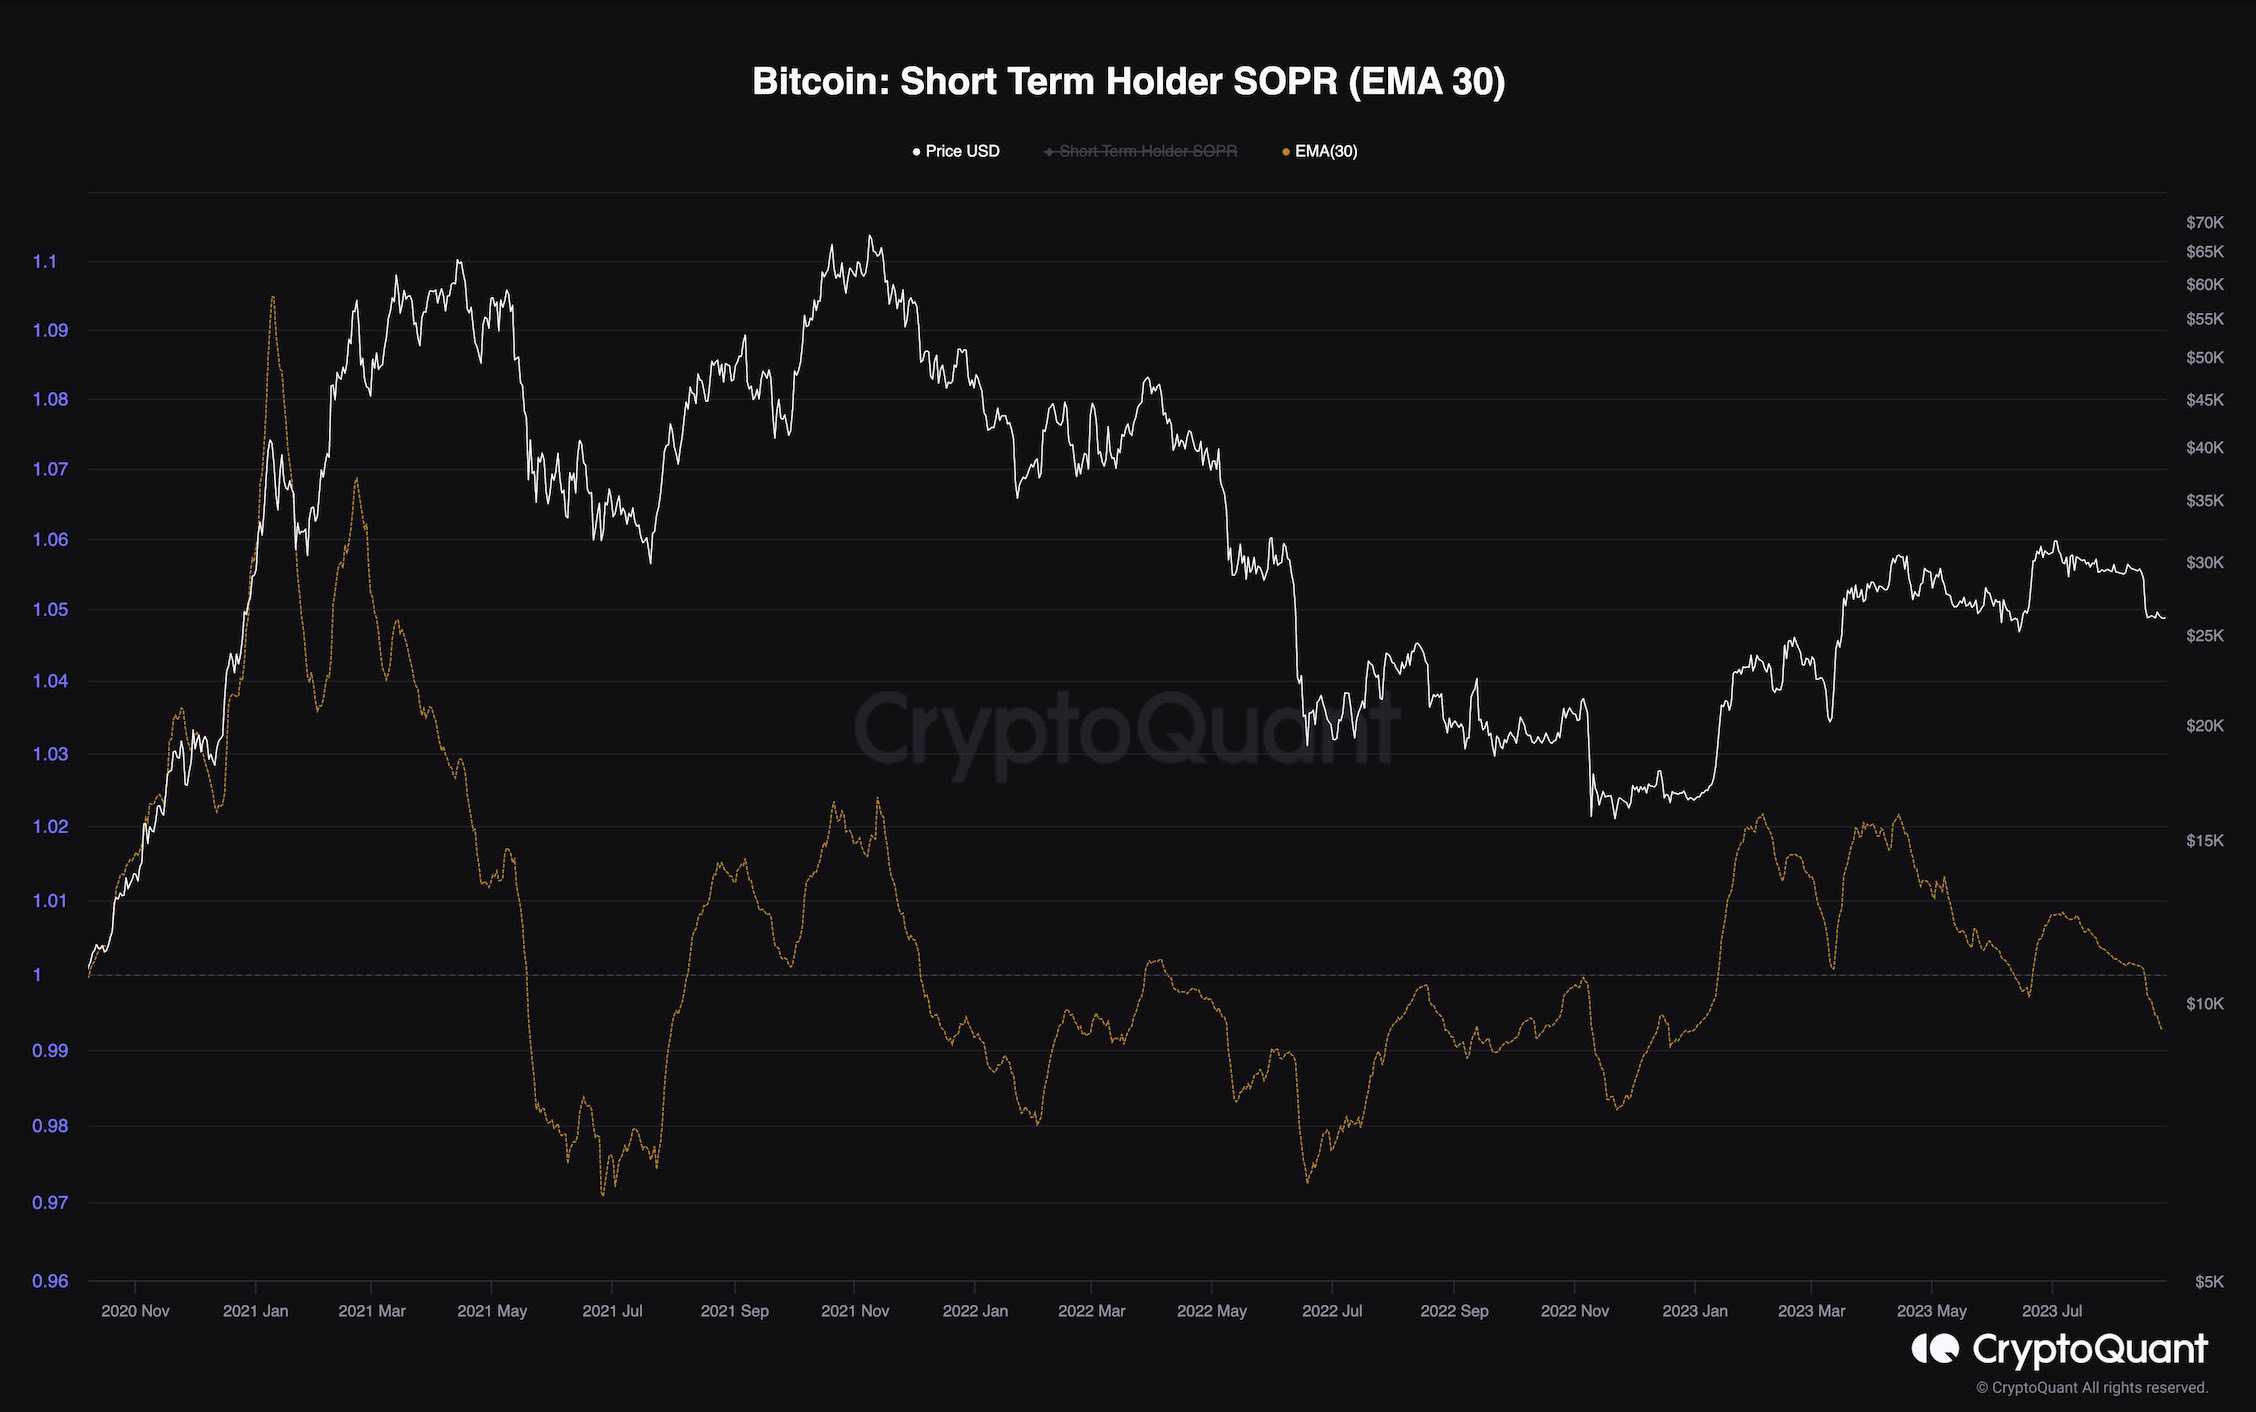
Bitcoin Short-Term Holder SOPR
Bitcoin’s price recently experienced a crash after failing to break above the key $30K area. There is a fear that the bear market is far from its end.
The following chart represents the short-term holder spent output profit ratio (SOPR) metric with a 40-day exponential moving average applied. It indicates the ratio of profitability of short-term spent outputs (coins that lived less than 155 days). Values above 1 indicate that the short-term investors are selling at a profit, while values below 1 demonstrate losses being realized by them.
As the chart illustrates, this metric has dropped back below 1 after more than six months. This signal indicates that the short-term holders are selling their coins at a loss, which is a behavior usually witnessed in bear markets. However, things might change if the metric quickly recovers above one, making the recent drop a bear trap.
The post BTC Must Hold this Level, Otherwise $25K Breakdown is Likely (Bitcoin Price Analysis) appeared first on CryptoPotato.