Bitcoin’s ‘Triangular Consolidation’ Is Bullish: Technical Analysis
/arc-photo-coindesk/arc2-prod/public/LXF2COBSKBCNHNRE3WTK2BZ7GE.png)
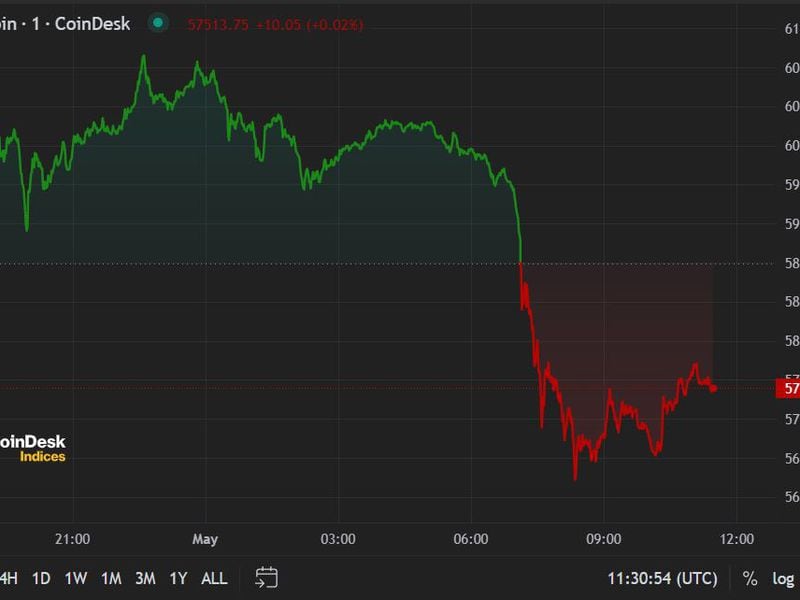
Bitcoin (BTC) appears to be consolidating into a triangular pattern, offering a positive outlook for the weeks ahead.
The leading cryptocurrency by market value has carved out higher lows and lower highs between $33,000 and $35,0000 in the past seven days, forming a triangle on the bitcoin price chart.
Analysts and traders study price patterns to gauge momentum strength and forecast changes in market trends. Triangles tend to be continuation patterns, representing a pause that refreshes the preceding trend, which is bullish in BTC’s case. The leading cryptocurrency rallied from $26,500 to $35,000 before starting its triangular behavior.
“Bitcoin is forming a triangle on the daily chart. It is generally believed that such consolidation formations end with an upward breakout,” Alex Kuptsikevich, a senior market analyst at FxPro, said in an email.
According to Kuptsikevich, a move above $35,000 would confirm a bullish triangle breakout, signaling a continuation of the rally from $26,500.
Note that while triangles usually resolve in the direction of the preceding trend, they can sometimes end with a downside breakout, indicating a bearish trend reversal. Hence, it’s imperative traders closely follow the price action over the next few days.
Edited by Sheldon Reback.