Bitcoin’s Consolidation Likely to End by Huge Move Following FOMC Meeting: BTC Price Analysis
Since early 2022, the bitcoin price has been trading inside a range, forming two critical supply and demand levels. The following analysis aims to identify those supply and demand zones that form this range, and also justify the 2021-2022 market behavior based on the Long-Time Holders’ profitability or LTH-SOPR metric.
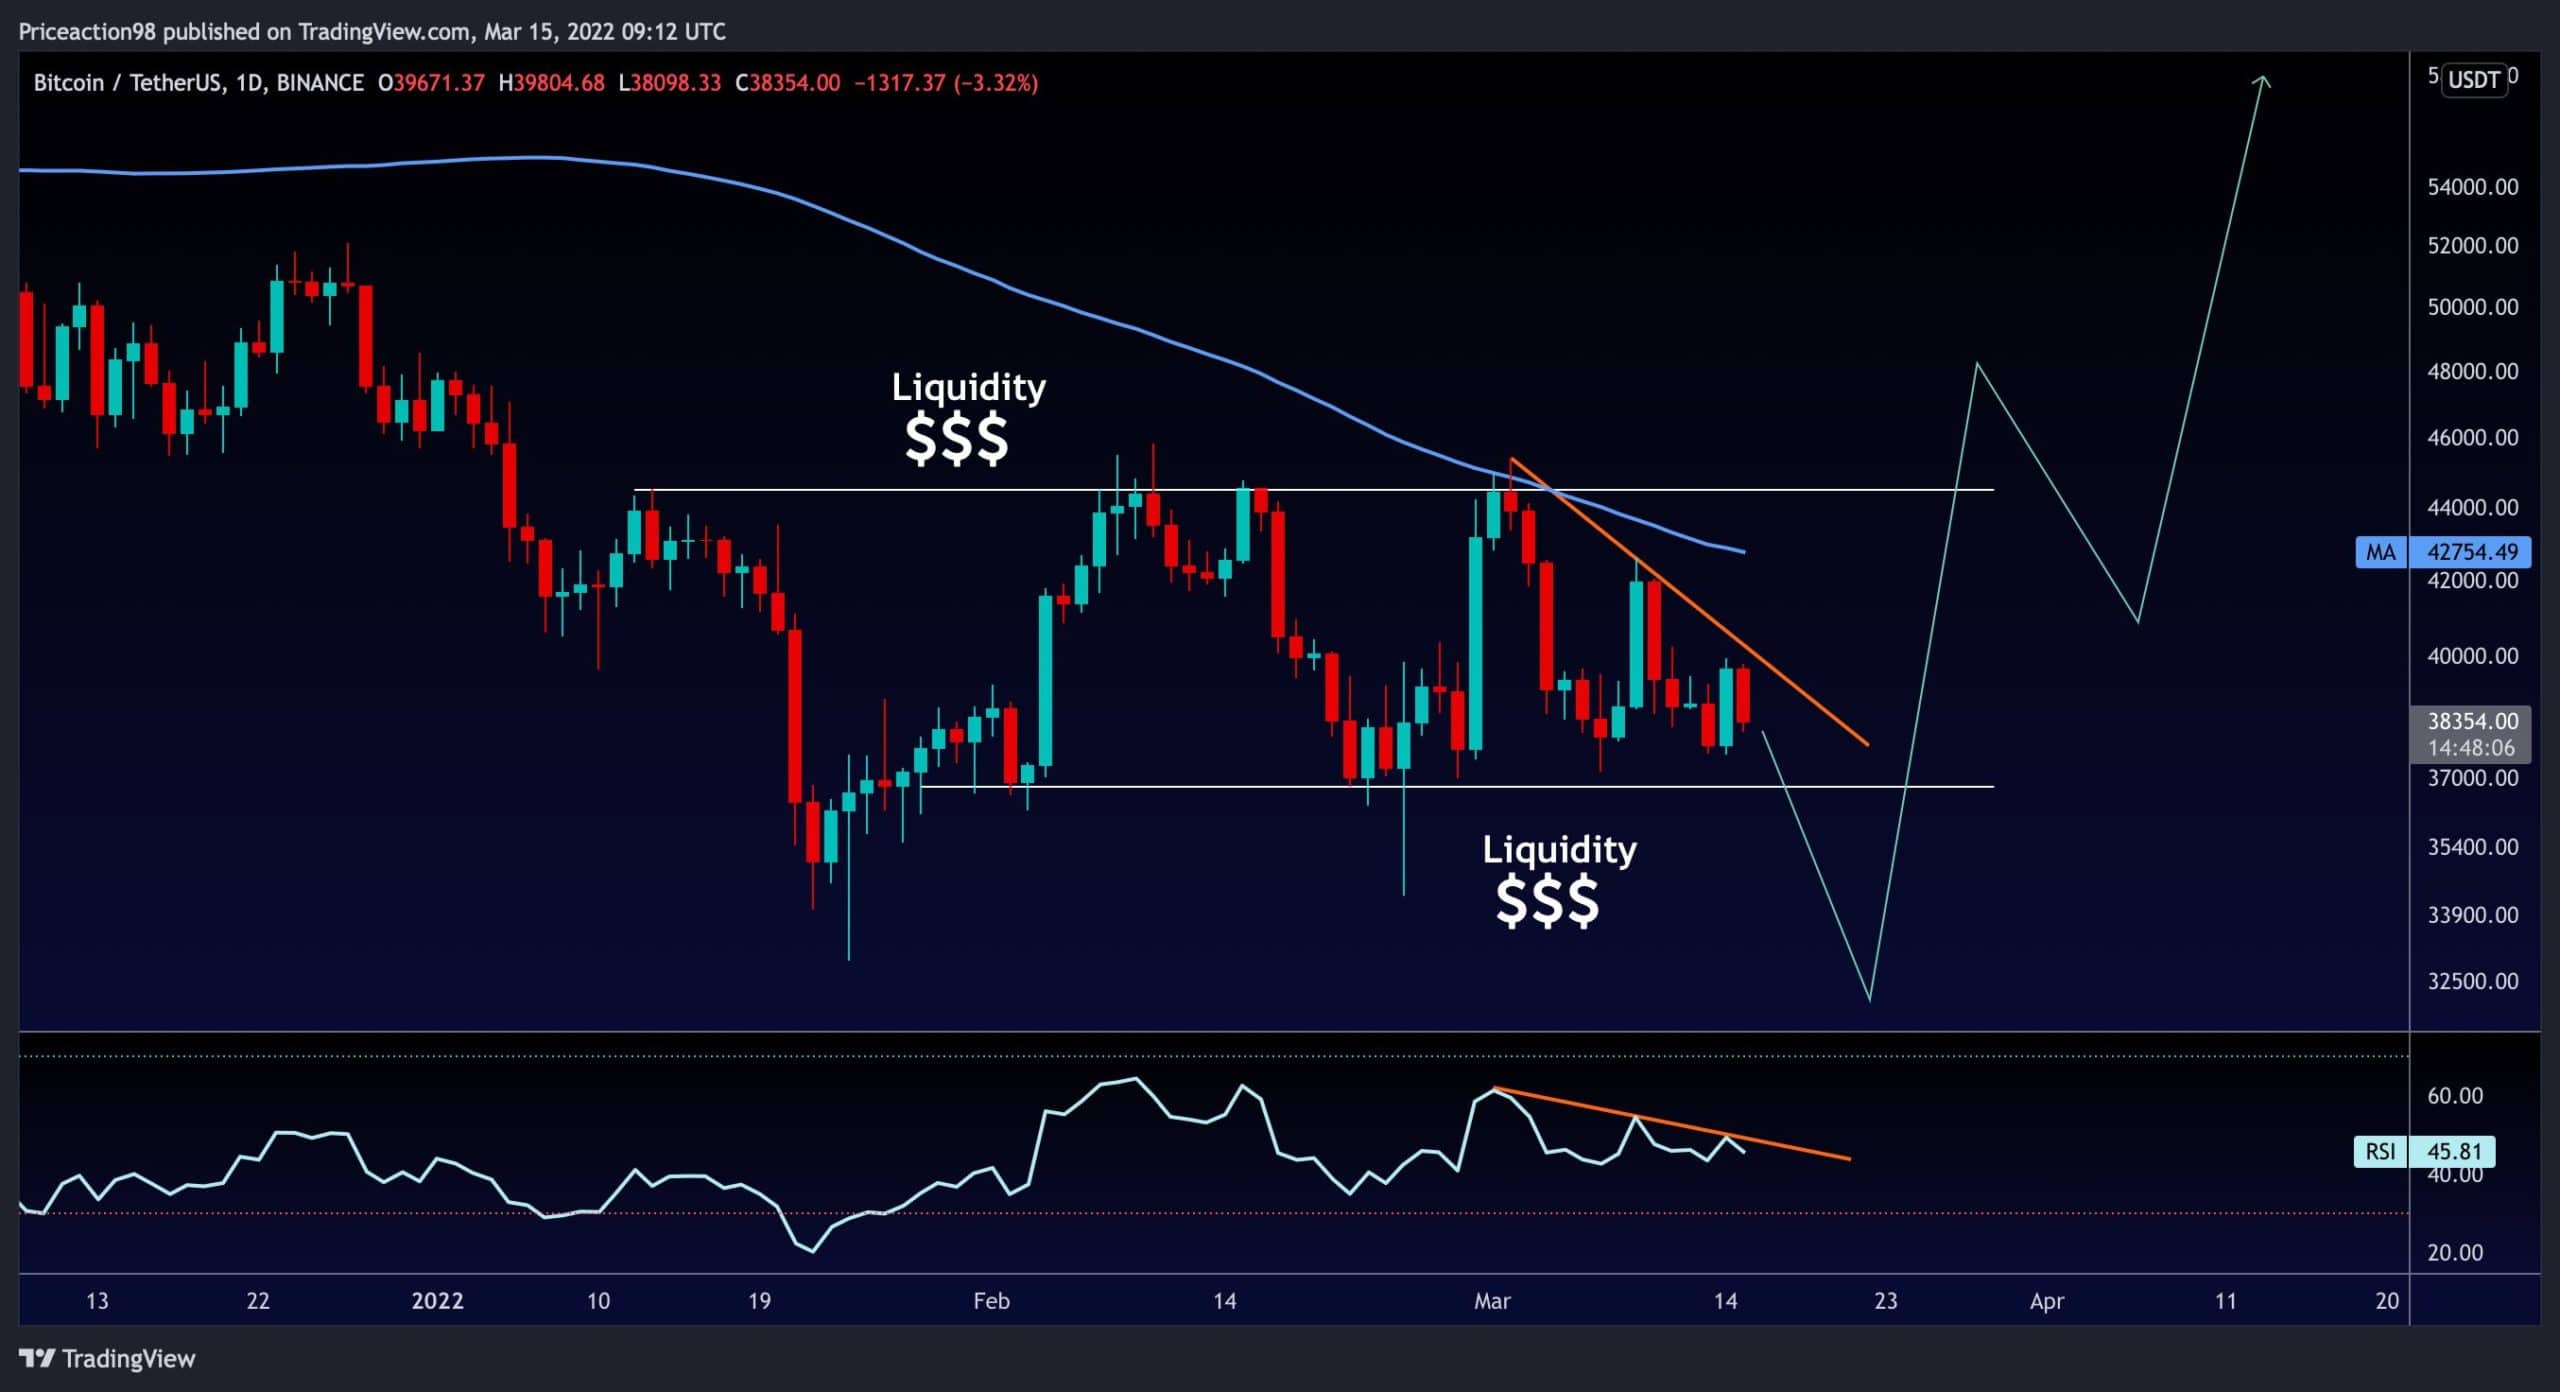
The Daily Chart
Techncial Analysis By: Shayan
Based on the market behaviour throughout this period, as shown below, massive liquidity (stop-loss orders) exists above the $45K resistance level, and also below the $34K support zone. The market usually absorbs the liquidity before beginning a possible healthy surge.
Due to the FOMC meeting tomorrow, which will carry some critical decisions regarding interest rates and the growth/printing of the United States money supply, the market faces uncertainty.
The meeting may end this confusion to either side; however, if the direction is upward, the first major resistance is the marked descending trendline seen on the RSI indicator (the lower section of the following chart).
The 4-Hour Chart
On the other hand, in the 4-hour’s short-term timeframe, the $37K support area has been proving itself as a solid support level, preventing BTC from dropping to lower levels.
In case of a bearish outcome, the $37K is the level to look at. Besides, it is worth mentioning that the descending trendline is the primary resistance for the price on the lower time frames.

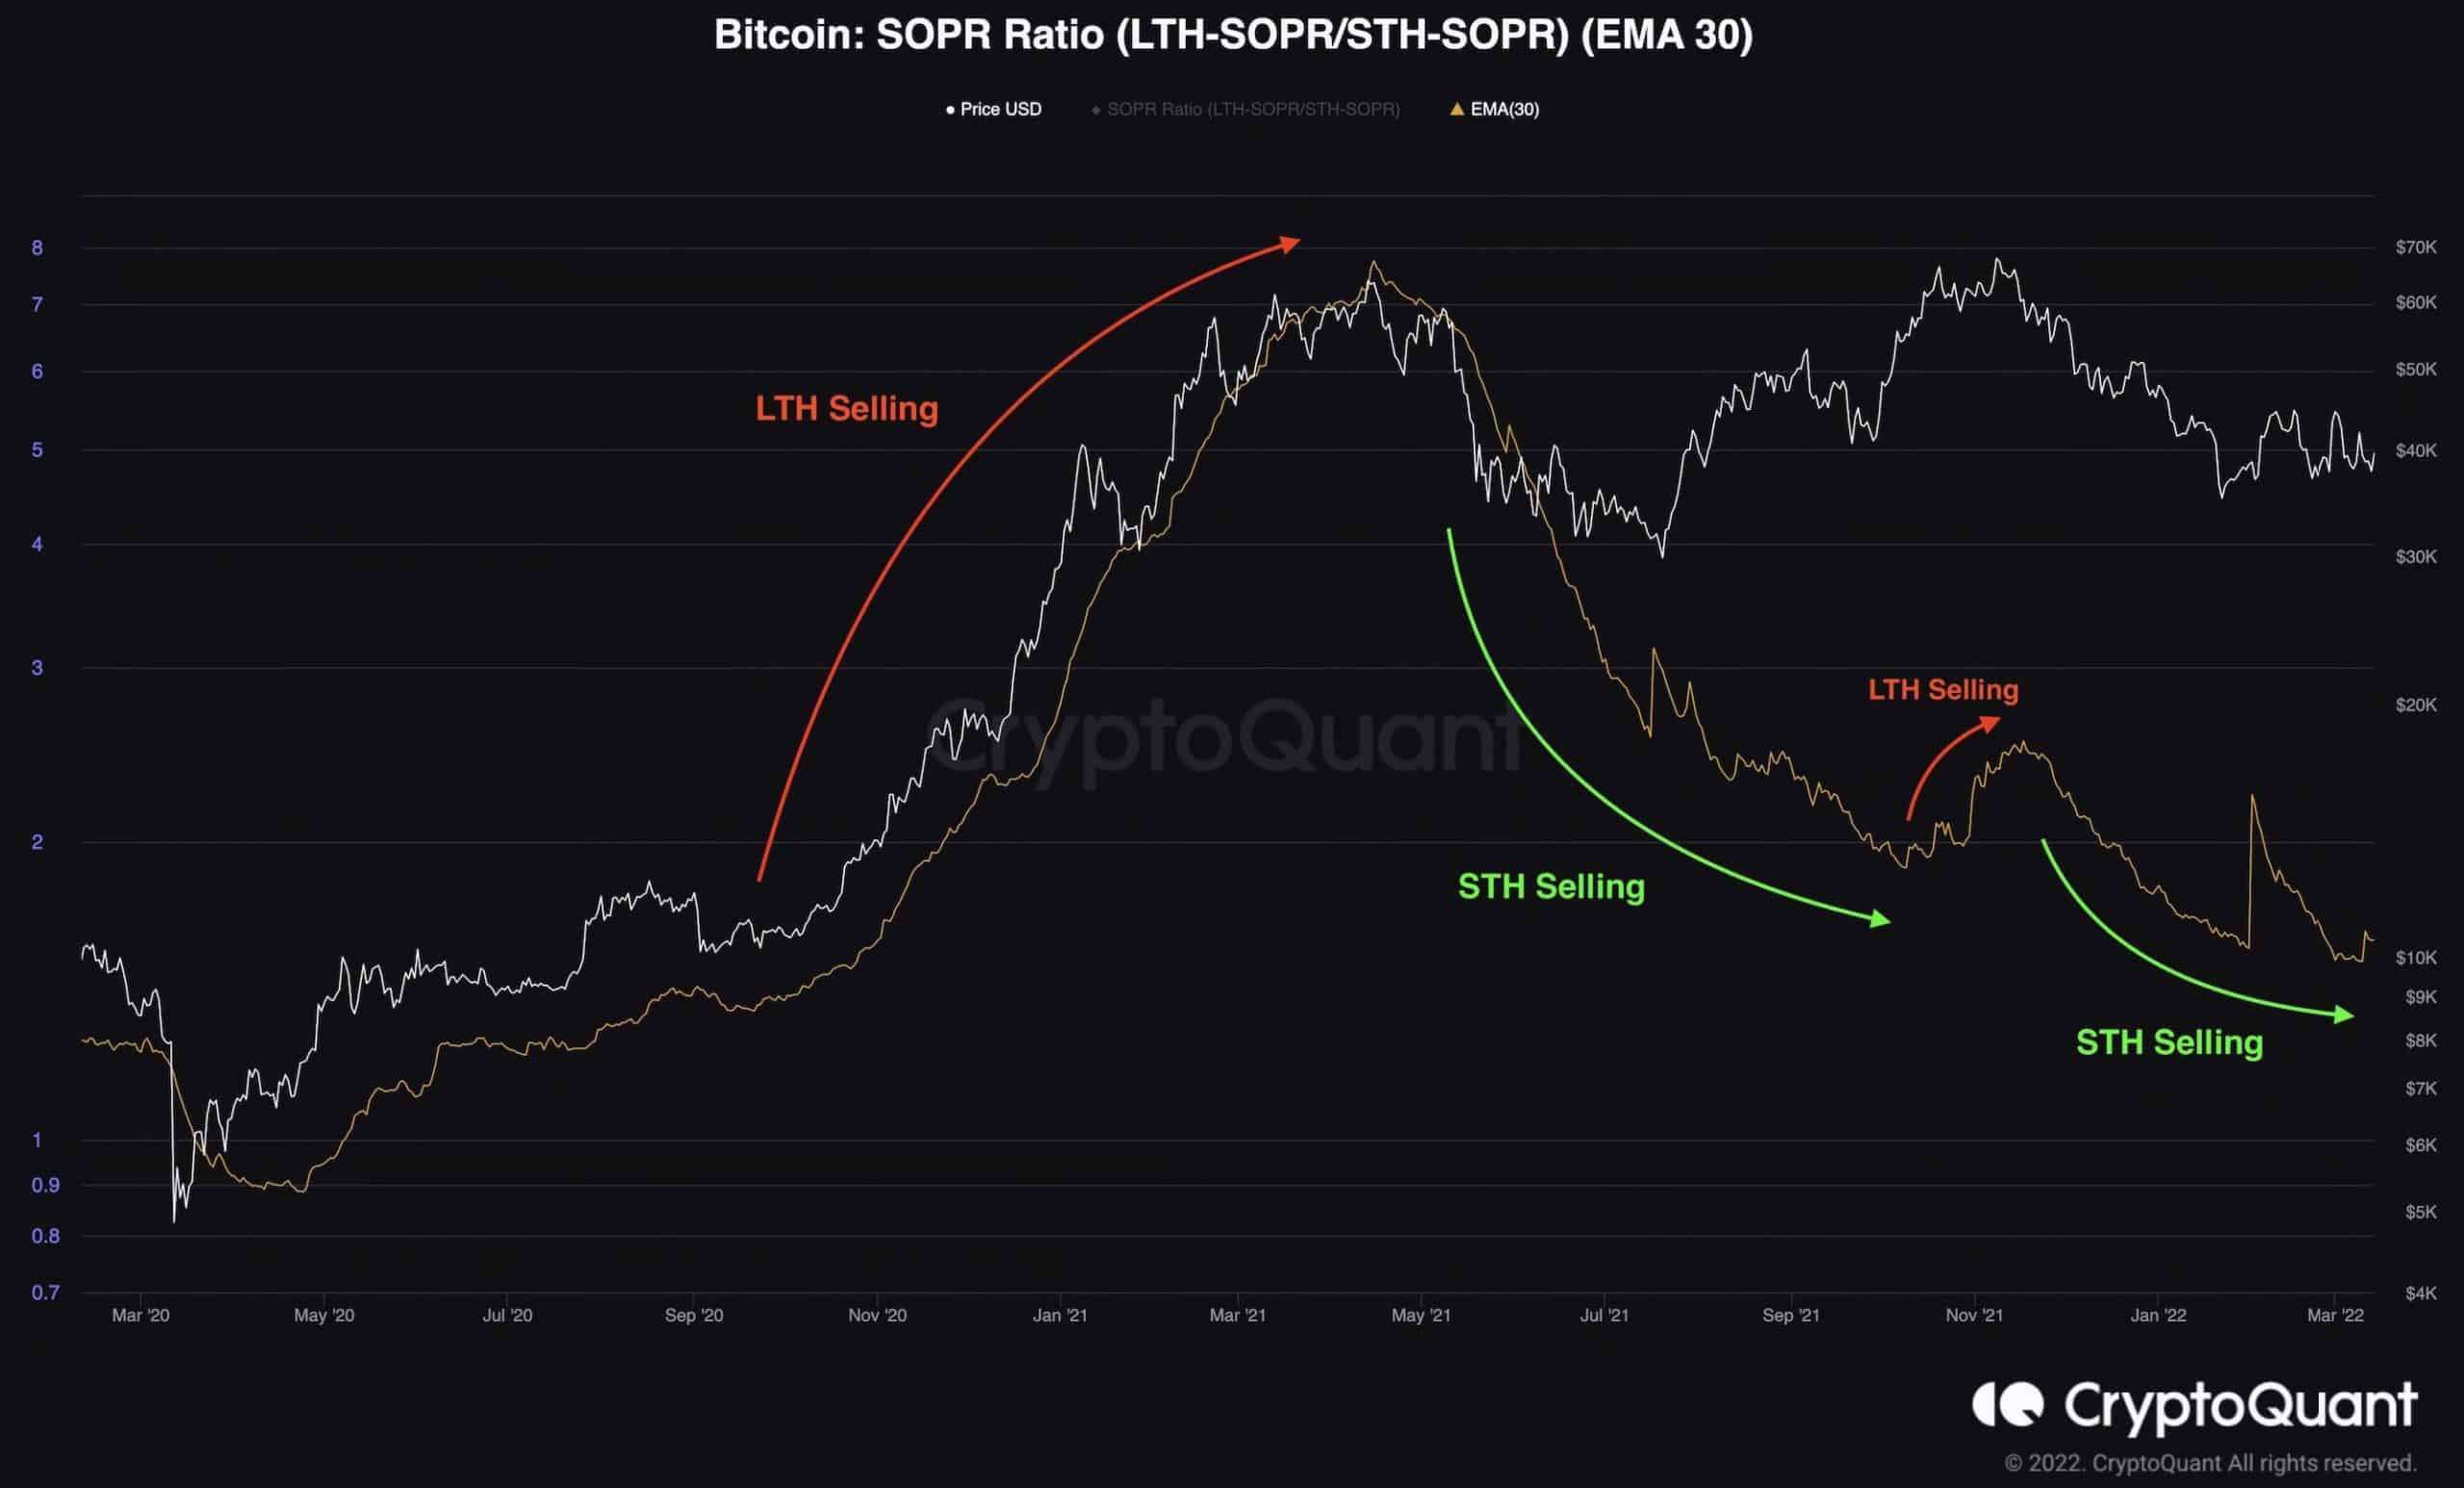
Onchain Analysis: Bitcoin SOPR Ratio (LTH-SOPR / STH-SOPR)
Onchain Analysis By: Edris
Analyzing the behavior of the short-term and long-term holders usually provides helpful information. The SOPR Ratio is an on-chain metric used for determining if the long-term or the short-term holders are the current dominant sellers in a given market.
An increase in this metric indicates that the long-term holders realize profits at a higher rate than the short-term holders. This cohort tends to sell into strength, realizing gains in bull markets, and then, they begin accumulating during the downtrend, as the short-term holders start panic selling.
As the chart shows, the long-term holders have been distributing during the bull market until the $64K all-time high was nailed. After the May 2021 crash, they began a long period of accumulation which continues to this day.
However, there was a short period in September and November 2021 where the metric rose again as the long-term holders started realizing profits while the market was rallying towards the $69K all-time high.
The SOPR Ratio is currently consolidating after a minor rise, so it should be tracked in order to determine if this spike is the beginning of an uptrend, indicating that the long-term holders are capitulating.