Bitcoin’s Bottom Might be Getting Closer According to Analyst
Bitcoin’s price could be getting closer to a local bottom according to at least one on-chain indicator. This comes as the cryptocurrency is trading in a tight range of around $30K for quite a while.
- The bitcoin price is currently sitting at around 57% below its all-time high reached in November last year.
- According to one technical indicator – namely, the long-term output profit ratio (LTH-SOPR), the bottom may be getting closer.
- The LTH SOPR is calculated as the USD value of spent outputs at the spent time divided by the USD value of spent outputs at the created time. In other words – the realized value is divided by the value at the time of creation.
- Data from CryptoQuant reveals that the current 7-day SMA LTH SOPR sits at 0.72, which means that some of the long-term holders could be selling at a loss.
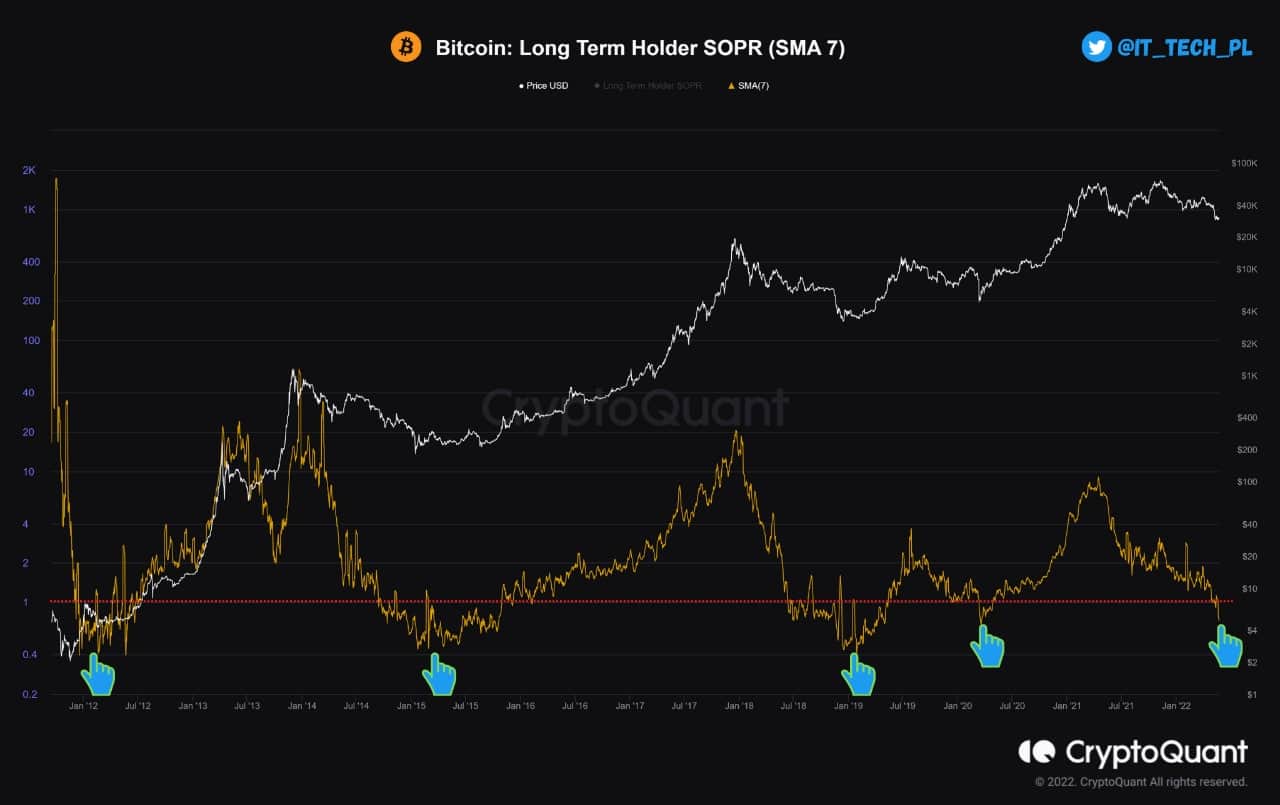
- The last time the LTH-SOPR dropped to the levels seen recently was back during the COVID crash in March 2020. Back then, however, its value dropped to 0.53, meaning that there might still be some pain ahead.
- According to the CryptoQuant analyst, this “doesn’t mean the bottom is in but it’s worth observing this metric.”
- Elsewhere, the cryptocurrency fear and greed index remains in the “extreme fear” territory. The metric is used to gauge the current market sentiment and according to it, investors remain particularly fearful at this time.