Bitcoin’s $800 Price Recovery Runs Into Key Resistance


markets
View
- Bitcoin’s bounce from Monday’s three-month low of $7,715 is struggling to beat the 200-day moving average resistance, currently at $8,440.
- The recovery rally lacks volume support and could be short lived. A rising wedge breakdown seen on the hourly chart favors a drop to levels below $8,000.
- A close above Monday’s high of $8,368 is needed to weaken bearish pressures. A bullish close, if confirmed, could yield a break above $9,000.
Bitcoin is better bid on the first day of the fourth quarter, but the relief rally is struggling to gather traction above a key former support-turned-resistance.
The top cryptocurrency is currently changing hands at $8,330 on Bitstamp, representing a 7 percent gain on a 24-hour basis.
Prices hit a high of $8,519 earlier today. At that level, the cryptocurrency was up $804 or 10.4 percent from the 3.5-month low of $7,715 reached in the Asian trading hours on Monday.
A recovery rally was expected, as the cryptocurrency was looking oversold on Monday, having dropped by more than $2,000 last week.
So far, however, a sustained break above the 200-day moving average (MA) resistance at $8,440 has remained elusive.
The 200-day MA is widely considered a barometer of the long-term trend. The cryptocurrency is said to be in a bull market if it is charting higher lows above the key MA, while lower lows below the long-term average is taken as a sign of bear market.
Further, the average line proved a tough nut to crack on Saturday, after which a fresh wave of selling ended up pushing prices to lows near $7,700.
Put simply, the 200-day MA is a crucial resistance, which if breached, may invite buying pressure.
Moreover, a convincing break above the 200-day MA would strengthen the narrative put forward by the likes of popular twitter analyst Crypto Bitlord that BTC may have bottomed out near $7,700.

While Crypto Bitlord is calling a bullish move to $9,000, market analyst Josh Rager is expecting consolidation.

The outlook would turn bullish above $8,800, according to Rager. That said, a convincing break above $8,800 may not happen immediately, as technical studies are still biased bearish and the rally seen in the last 24 hours is lacking substance.
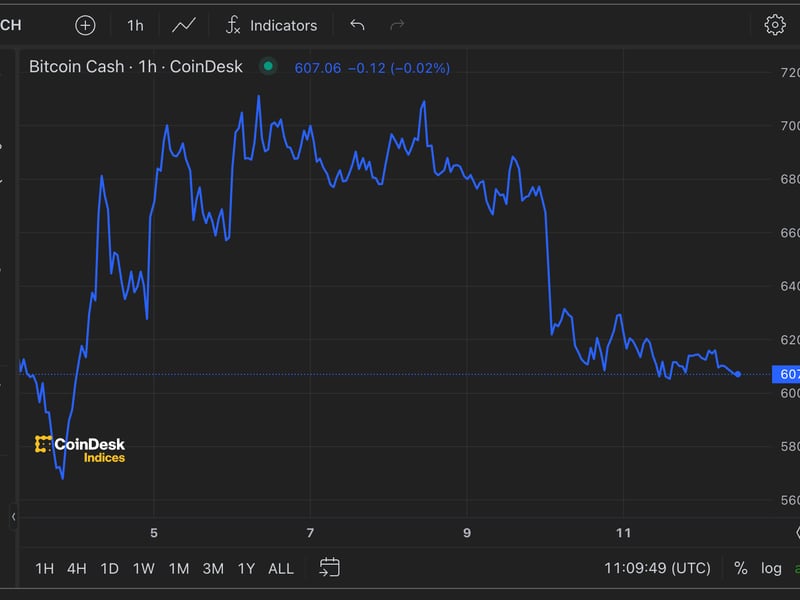
4-hour and hourly charts

Bitcoin witnessed a double bottom breakout on the 4-hour chart in the Asian trading hours, opening doors for a rise to $8,900 (target as per the measured move method).
The breakout, however, lacked volume support. In fact, trading volumes have remained low throughout the price rise from $7,715 to $8,519. A low-volume recovery is often short-lived.
The hourly chart is reporting a rising wedge breakdown – a bearish reversal pattern that indicates the corrective rally has ended and prices could fall back below $8,000 in the next 24 hours.
The case for a rise to $8,900 would strengthen if a move above $8,500 is accompanied by a surge in buying volumes.
Daily chart

Bitcoin is currently struggling to beat the 200-day MA resistance.
The cryptocurrency created a bullish outside bar candle yesterday, signaling seller exhaustion.
A short-term bullish reversal would be confirmed if prices print a UTC close above $8,368 today, validating Monday’s outside bar candle. That could yield a sustained move to $9,000.
However, the outlook as per the longer duration technical charts will remain bearish as long as prices are held below $9,097, as discussed yesterday.
Disclosure: The author holds no cryptocurrency assets at the time of writing.
Bitcoin image via CoinDesk Archives; charts by Trading View