Bitcoin Skyrockets to $11,000: How High Can It Go From Here? BTC Price Analysis & Weekly Overview
The most famous cryptocurrency does it again: Just four months ago, Bitcoin was trading at nearly $3,000, and now – close to $11,000.
Bitcoin has successfully managed to survive drops of more than 80% in its value. Not only survive, but overcome and become even stronger than before. We have seen such strength during the past three months, following the breakout of the $4,000 zone.
The $11,000 area was the target given to Bitcoin in our analysis just two days ago. Another thing to take note of is weekend action. Bitcoin whales plan their action for the weekends, and it’s not a coincidence that the breakout took place when most of the world was off to start another weekend.
Total Market Cap: $322.8 billion (crossed $300 billion!)
Bitcoin Market Cap: $190.8 billion
BTC Dominance: 59.1%
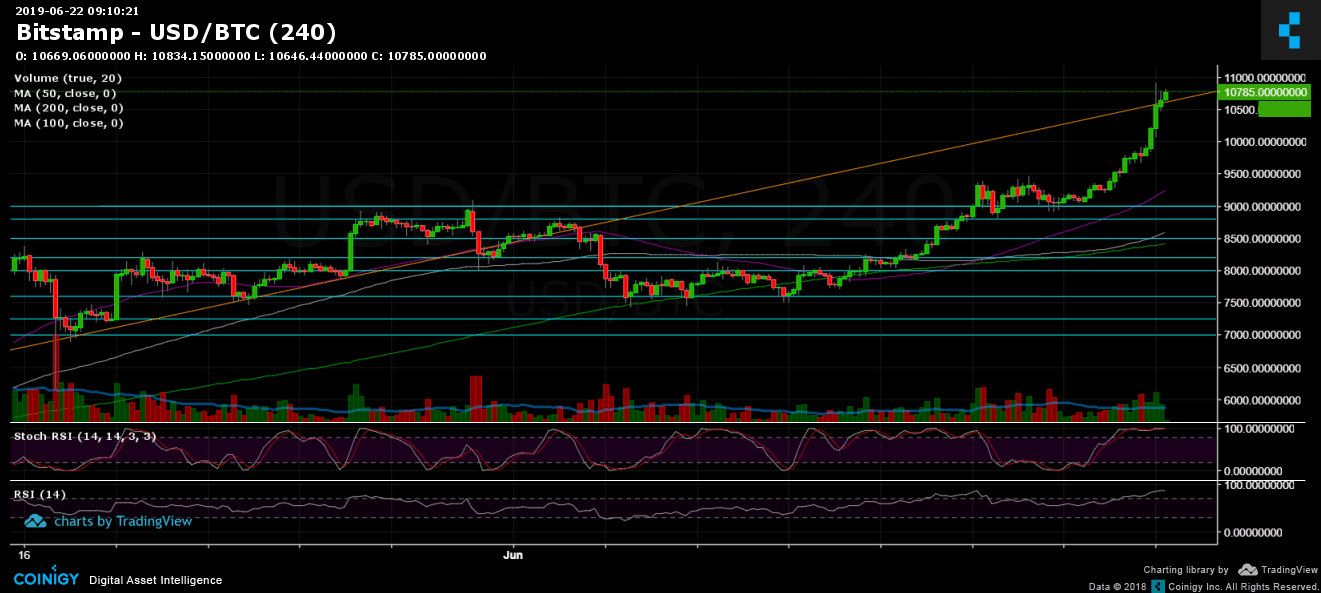
Looking at the 1-day and 4-hour charts:
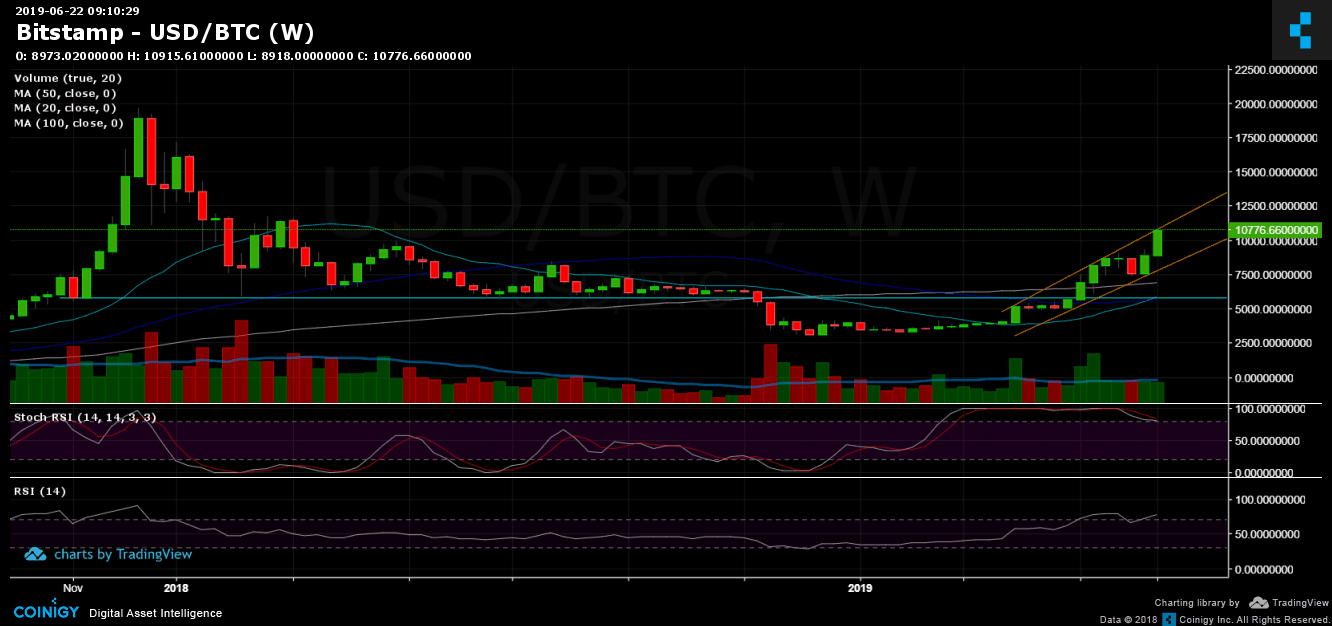
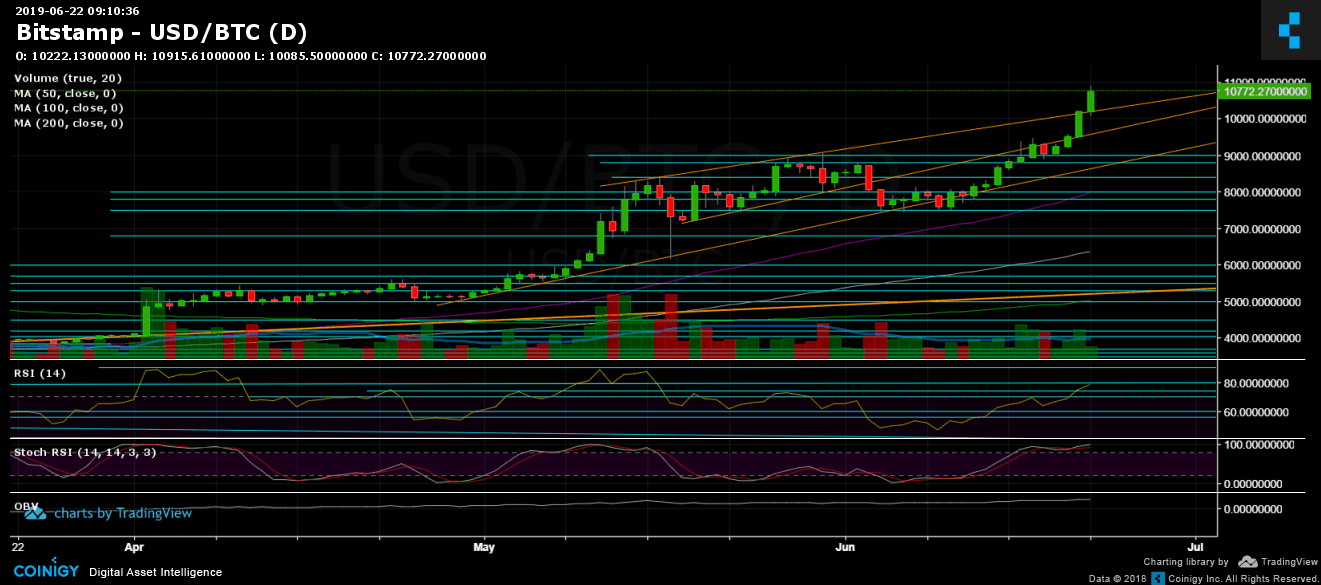
Support/Resistance: Looking at the daily chart, we can see Bitcoin’s breakout of the upper ascending trend-line (note the three lines marked in orange). However, the longer-term weekly chart tells a different story, as $11,000 serves as a robust resistance level.
Since the coin hasn’t seen a significant correction since the $7,500 area, coupled with the fact that Bitcoin is in the middle of yet another parabolic move, the inevitable correction will hurt. Until then, however, you’d better not disturb the bulls. Anything that goes 3x in three months is unexpected and volatile for both sides.
Now the closest resistance lies at $11,000. If this level is broken, the next significant resistance area is located around $11,500 – $11,600, which is the high from February 2018. Further above lies $12,000.
From below, Bitcoin crossed $10,000 like it was nothing. The nearest levels of support lie at $10,600, $10,200 and $10,000. Below 5 digits is the $9600 – $9700 support area, followed by $9,400, $9,000, and $8,800.
Daily chart’s RSI: The RSI also broke out above 70 and is now facing the 80 level. However, one concern is the divergence in the RSI on both the daily and weekly charts. To see the bullish momentum continue, the RSI needs to follow Bitcoin’s price chart in creating higher highs. Another thing to note is that the Stochastic RSI for the daily chart stretches into the overbought area.
Trading Volume: The volume is not record-breaking, yet. This is according to the divergence in the RSI. However, this could be due to the fact that it’s the weekend.
Bitfinex open short positions: Just as expected, the open short positions are gaining momentum along with the rising Bitcoin price. There is now 28.8K BTC worth of open short positions. This is their highest level since May 11.
BTC/USD Bitstamp 4-Hour Chart
BTC/USD Bitstamp 1-Day Chart
The post Bitcoin Skyrockets to $11,000: How High Can It Go From Here? BTC Price Analysis & Weekly Overview appeared first on CryptoPotato.