Bitcoin Records a New 2019 High Following The Golden Cross: $6000 Soon? BTC Price Analysis April 23
The bulls are back. This is what was written in our recent analysis from 48 hours ago: “Some signs are telling about a coming-up sharp move, which will probably take place in the next day or so, following the Easter Holiday.” The main reasons for that were the tight Bollinger Bands, along with a decreasing volume on the daily chart.
To the joy of the bulls, Bitcoin finally broke up above the tight range of $5300 – $5350, and as of now, had marked the daily high at $5639 (BitMEX). Indeed – a decent breakout!
In our previous analysis, we’ve talked a lot about the next targets in a case of a breakout: the first target at $5500, while the second one lies at $5700 – $5800 which is expected to be a tough resistance area.
Time for a Golden Cross
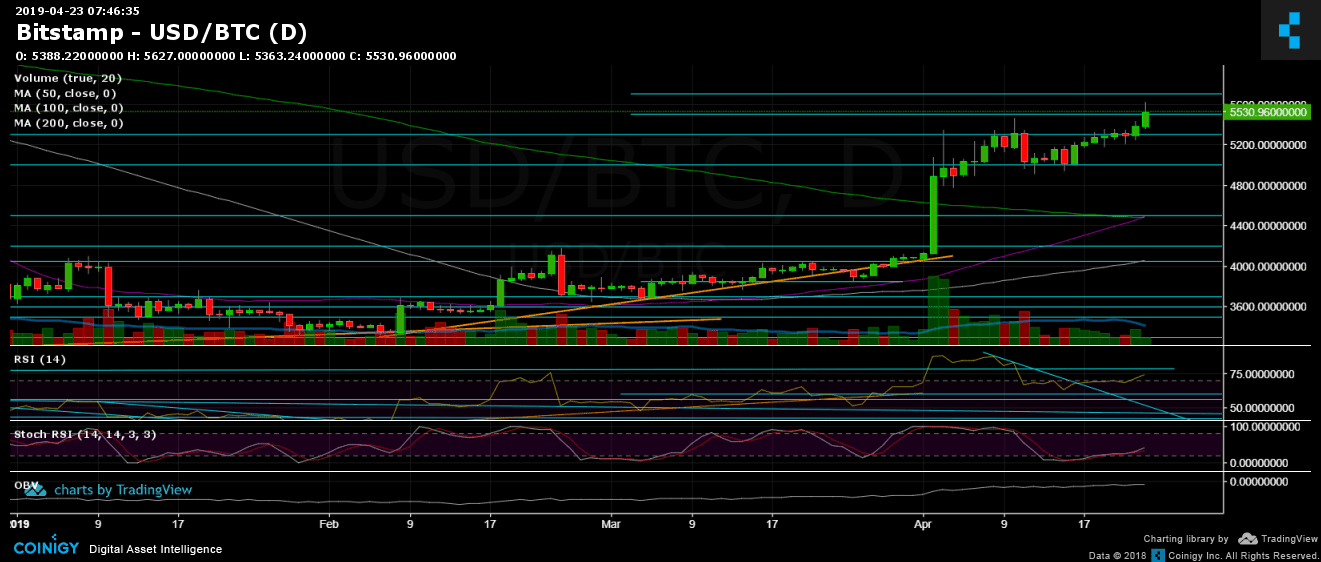
Another bullish technical sign is coming from the interaction between the two moving average lines, which just occurred hours ago: The 50 days (purple) and the 200 days (light green) on the daily chart. A Golden Cross happens as the 50-days moving average, or MA-50, crosses above the 200-days MA.
The last time Bitcoin’s chart saw a Golden Cross took place somewhere in 2015. Many see it as an early sign for a coming-up bull market. Yesterday, we had published an in-depth article about the coming-up Golden Cross.
Total Market Cap: $184.9 Billion
Bitcoin Market Cap: $98.3 Billion
BTC Dominance: 53.2%
Looking at the 1-day & 4-hour charts
– Support/Resistance:
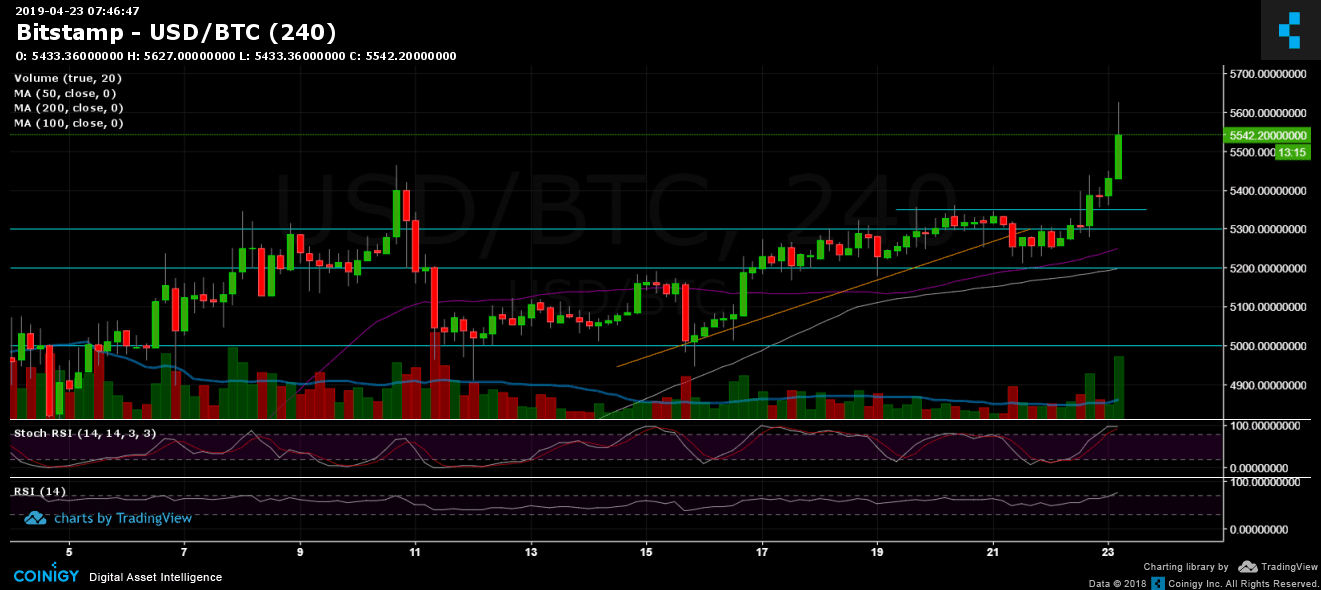
As mentioned above, Bitcoin had surpassed $5500 and now tests it as support. In case this doesn’t hold up, the $5300 – $5350 is the next major resistance turned support area. Below is the $5200 level (along with MA-50 and MA-100 of the 4-hour chart, marked in purple). Further below lies the strong $5000 support level.
From above, as mentioned, the next major resistance area is $5700 – $5800. The last was the 2018 bear market last barrier before the severe breakdown that torn away another 45% from the bleeding Bitcoin’s price (until reaching the low of $3122 in last December). From this above reason, we expect $5700 – $5800 to be a broad zone of supply or in other words a tough resistance area. In case of a break-up, the $6000 level is not expected to be easier to overcome.
– Daily chart’s RSI: On our last analysis we mentioned the RSI struggling with the 70 RSI level as resistance. The breakout in BTC price breached the previous, as it now hovers around the 75 bullish RSI level.
– BitFinex open short positions: the open short positions keep on getting momentum: there are now 24.5K BTC open short positions, which is a 30% increase in the last five days.
BTC/USD BitStamp 4-Hour Chart
BTC/USD BitStamp 1-Day Chart
The post Bitcoin Records a New 2019 High Following The Golden Cross: $6000 Soon? BTC Price Analysis April 23 appeared first on CryptoPotato.