Bitcoin Pushes $30K but Worrying Signs Beg for Caution: BTC Price Analysis
After a gradual uptrend approaching the 100-day and 200-day moving averages, the price has successfully broken above these key indicators, instilling hope and a bullish sentiment in the market.
Currently, Bitcoin is eyeing the pivotal resistance level of $30K.
Technical Analysis
By Shayan
The Daily Chart
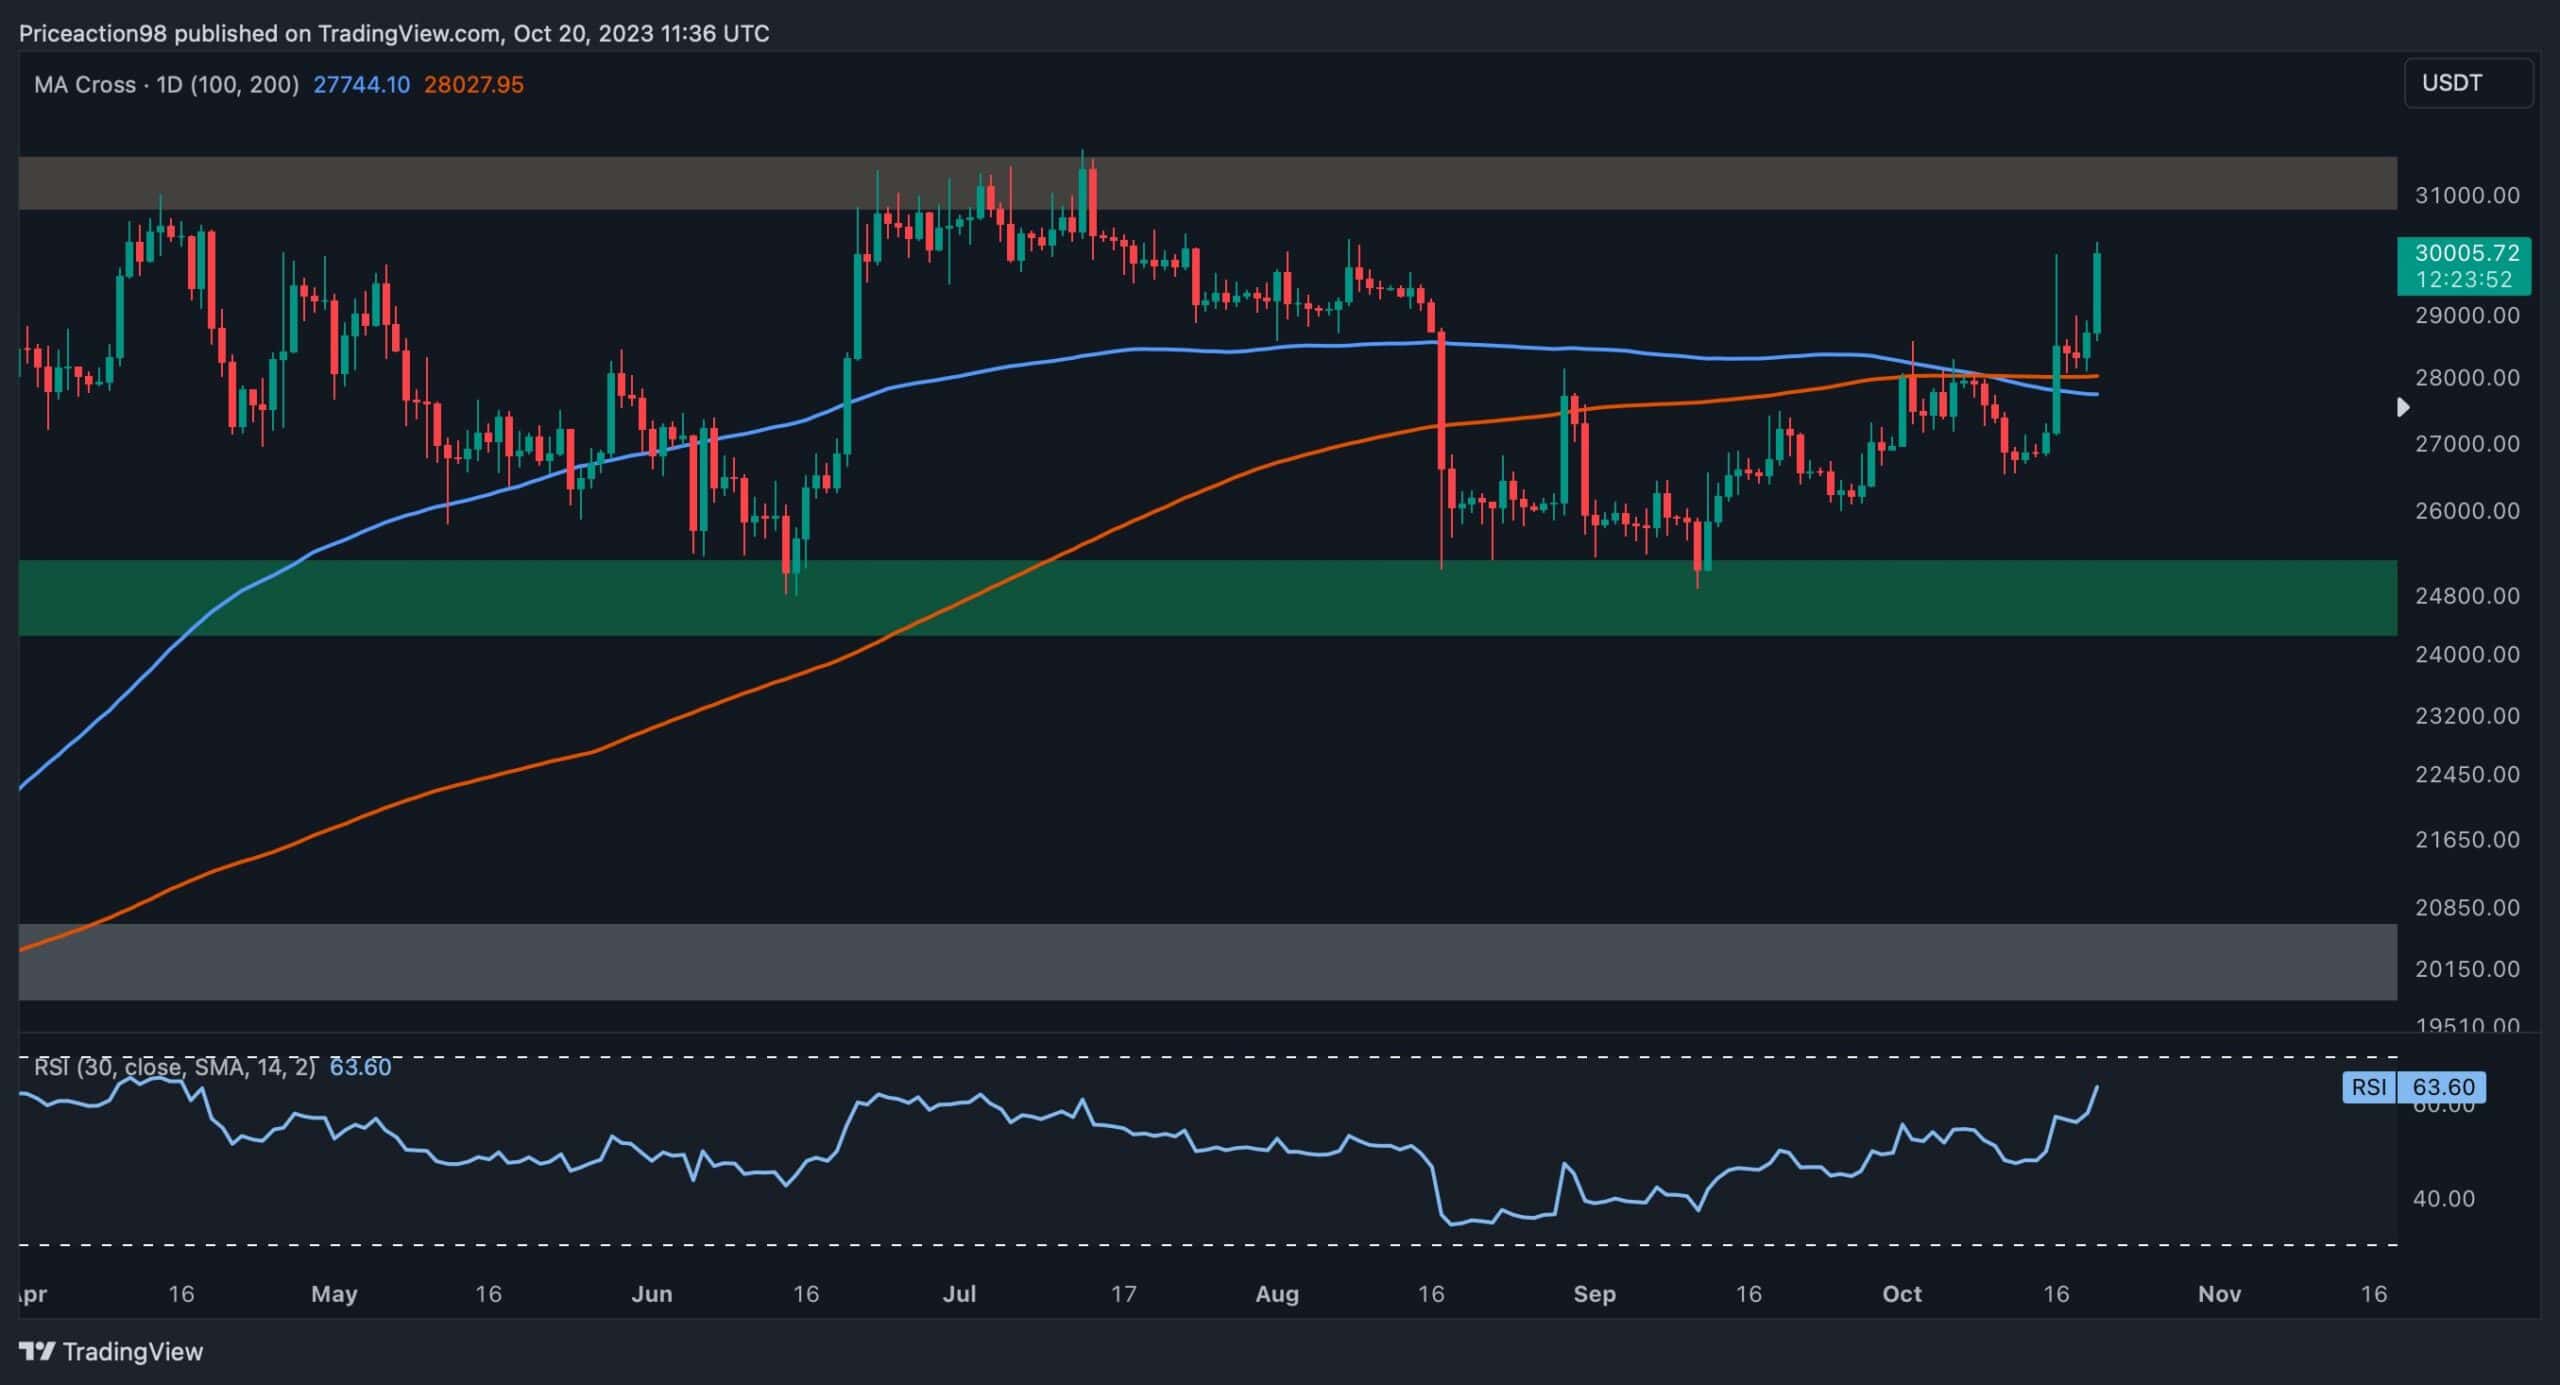
Examining the daily chart, the price found substantial support around the $25K region, initiating a healthy uptrend that led to a breakthrough above the critical resistance levels of the 100-day and 200-day moving averages.
This surge in momentum generated increased demand, propelling Bitcoin towards the significant resistance region of $30K, which aligns with the cryptocurrency’s yearly high.
However, this price range acts as a vital psychological barrier where the influence of sellers might temporarily pause the uptrend. Observing Bitcoin’s behavior around this crucial mark in the coming days is essential.
The 4-Hour Chart
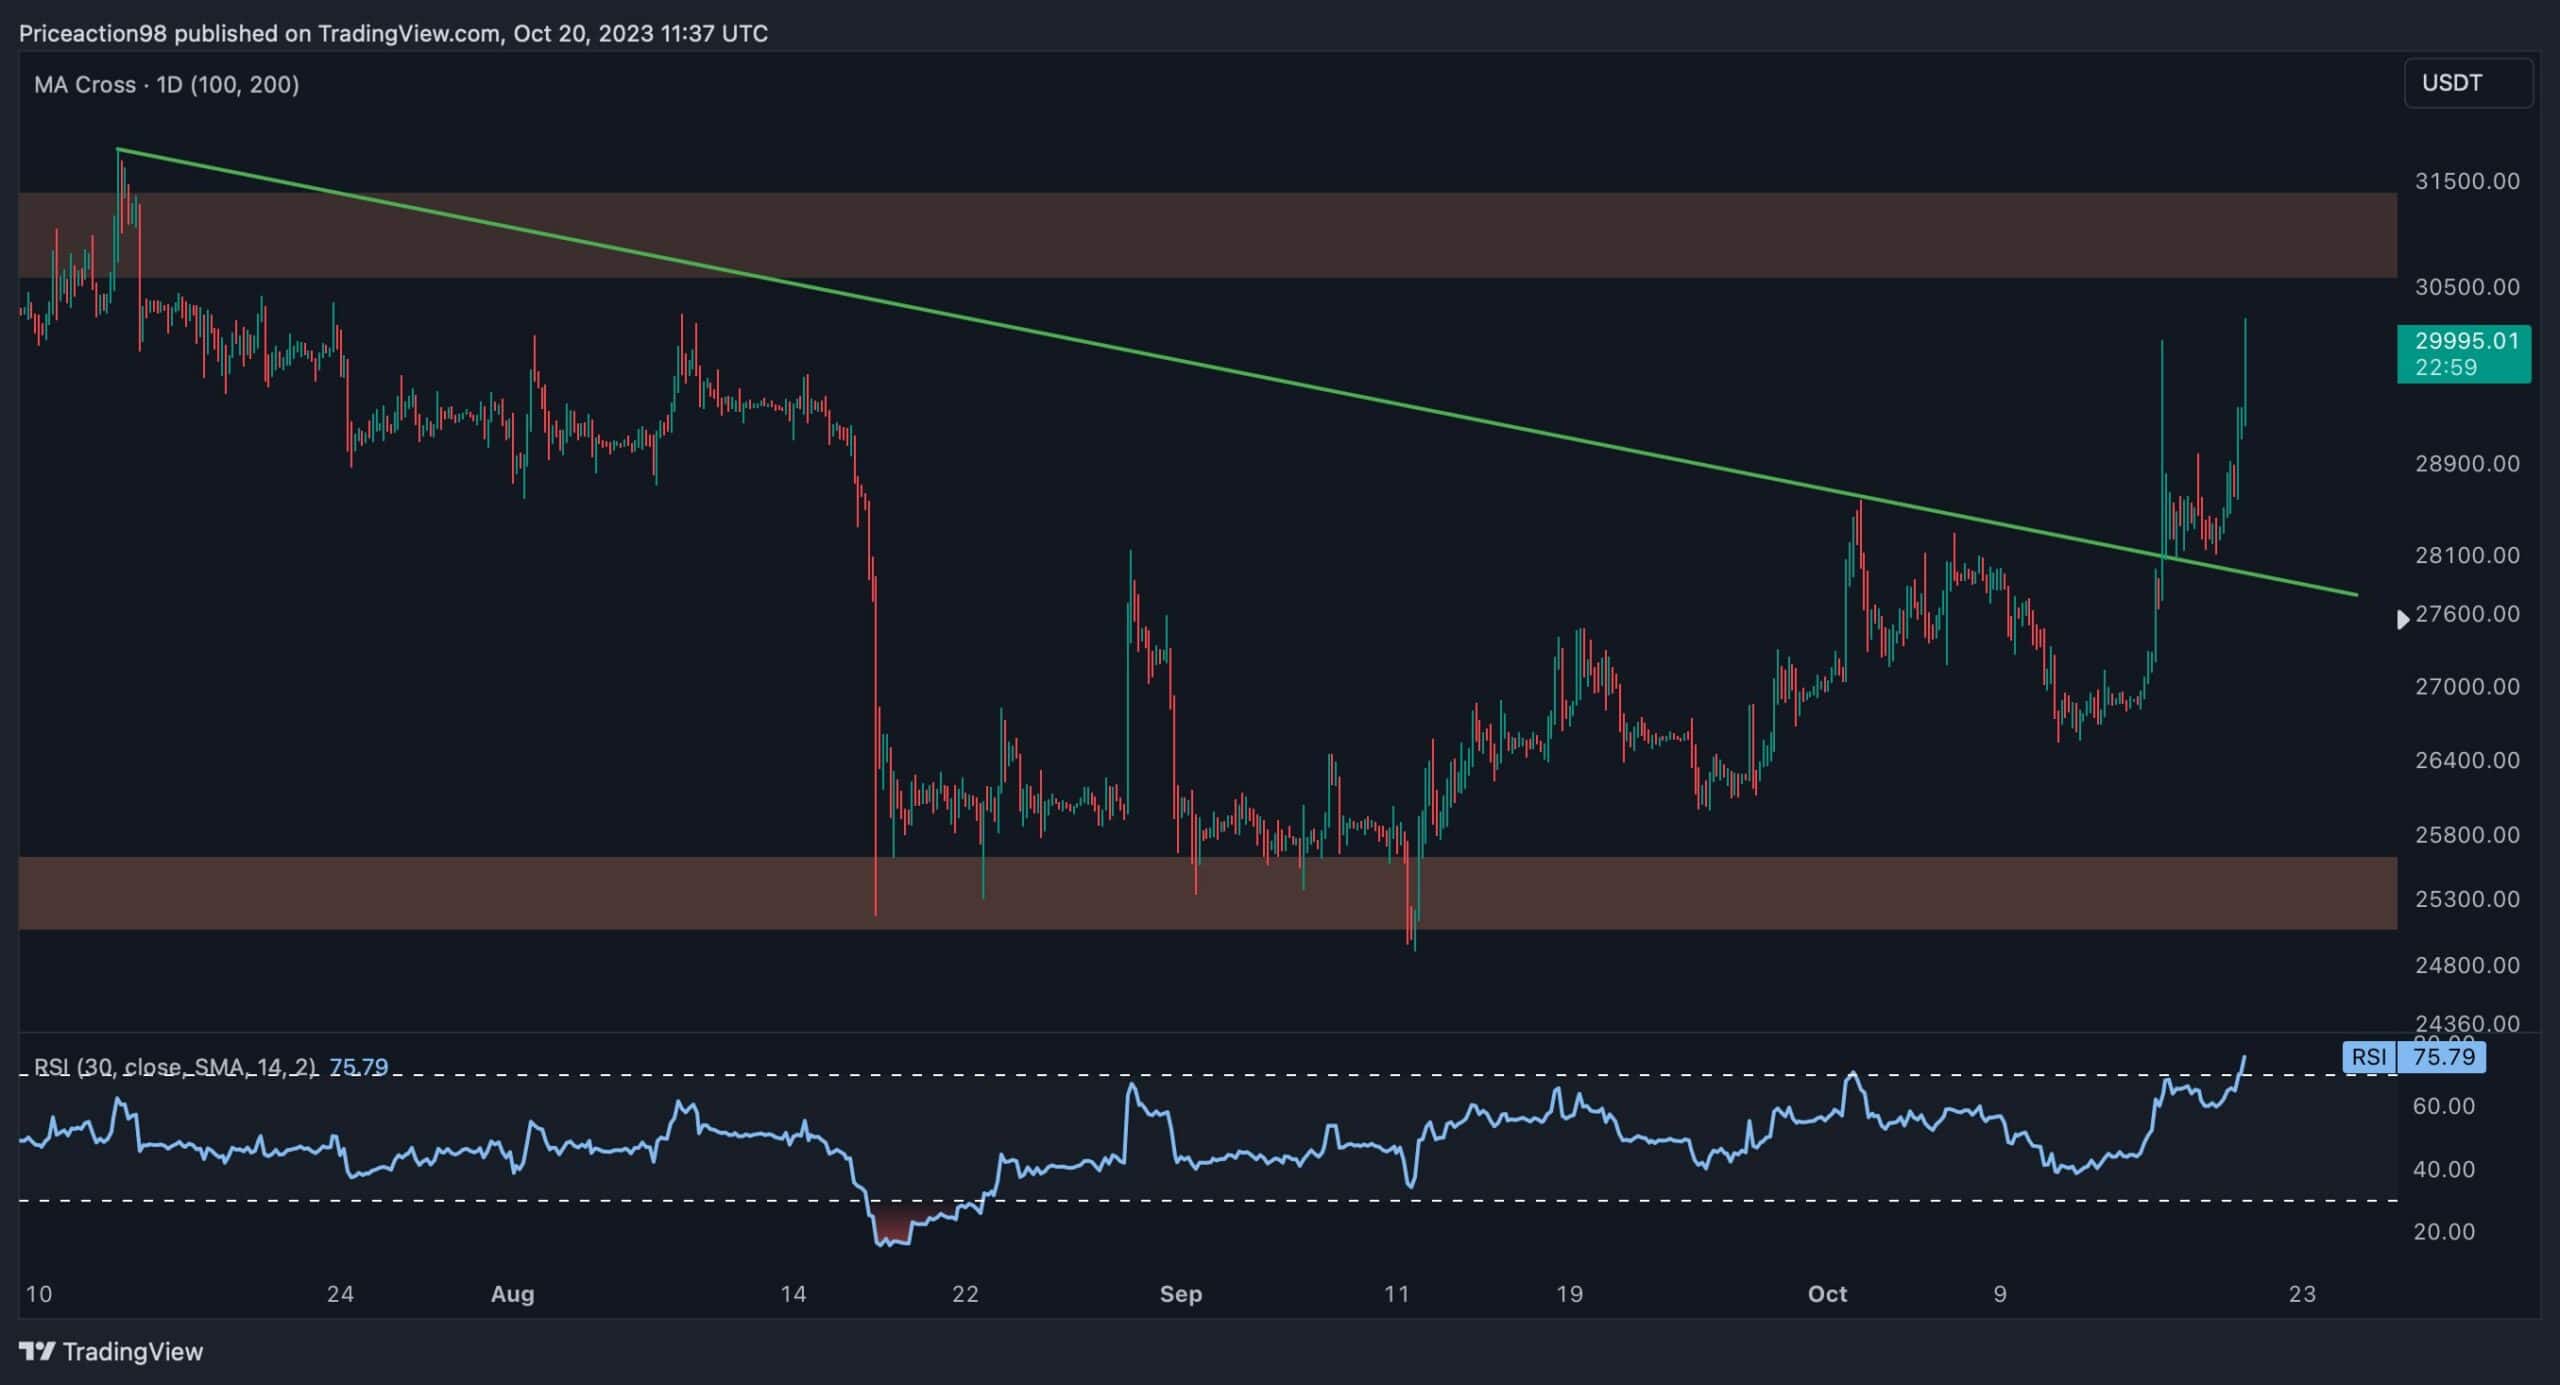
Analyzing the 4-hour chart, a clear pattern of higher highs and higher lows is evident. Following this robust upward movement, the price surpassed its descending trendline spanning multiple months and completed a pullback, indicating a continuation of the uptrend with enhanced momentum.
Nevertheless, the price is approaching a substantial resistance zone at the $30K mark, characterized by a significant supply of Bitcoin. If buyers manage to overpower sellers, a sudden breakout could occur, potentially leading to the liquidation of numerous short positions. Conversely, if sellers dominate buyers, the market may face rejection, potentially resulting in a consolidation phase.
Regardless of the outcome, closely monitoring price action in the coming days is imperative.
On-chain Analysis
By Shayan
Despite Bitcoin’s recent sharp uptrend, where sellers failed to breach the $25K support region, there’s an intriguing development in the futures market suggesting a potential consolidation correction stage.
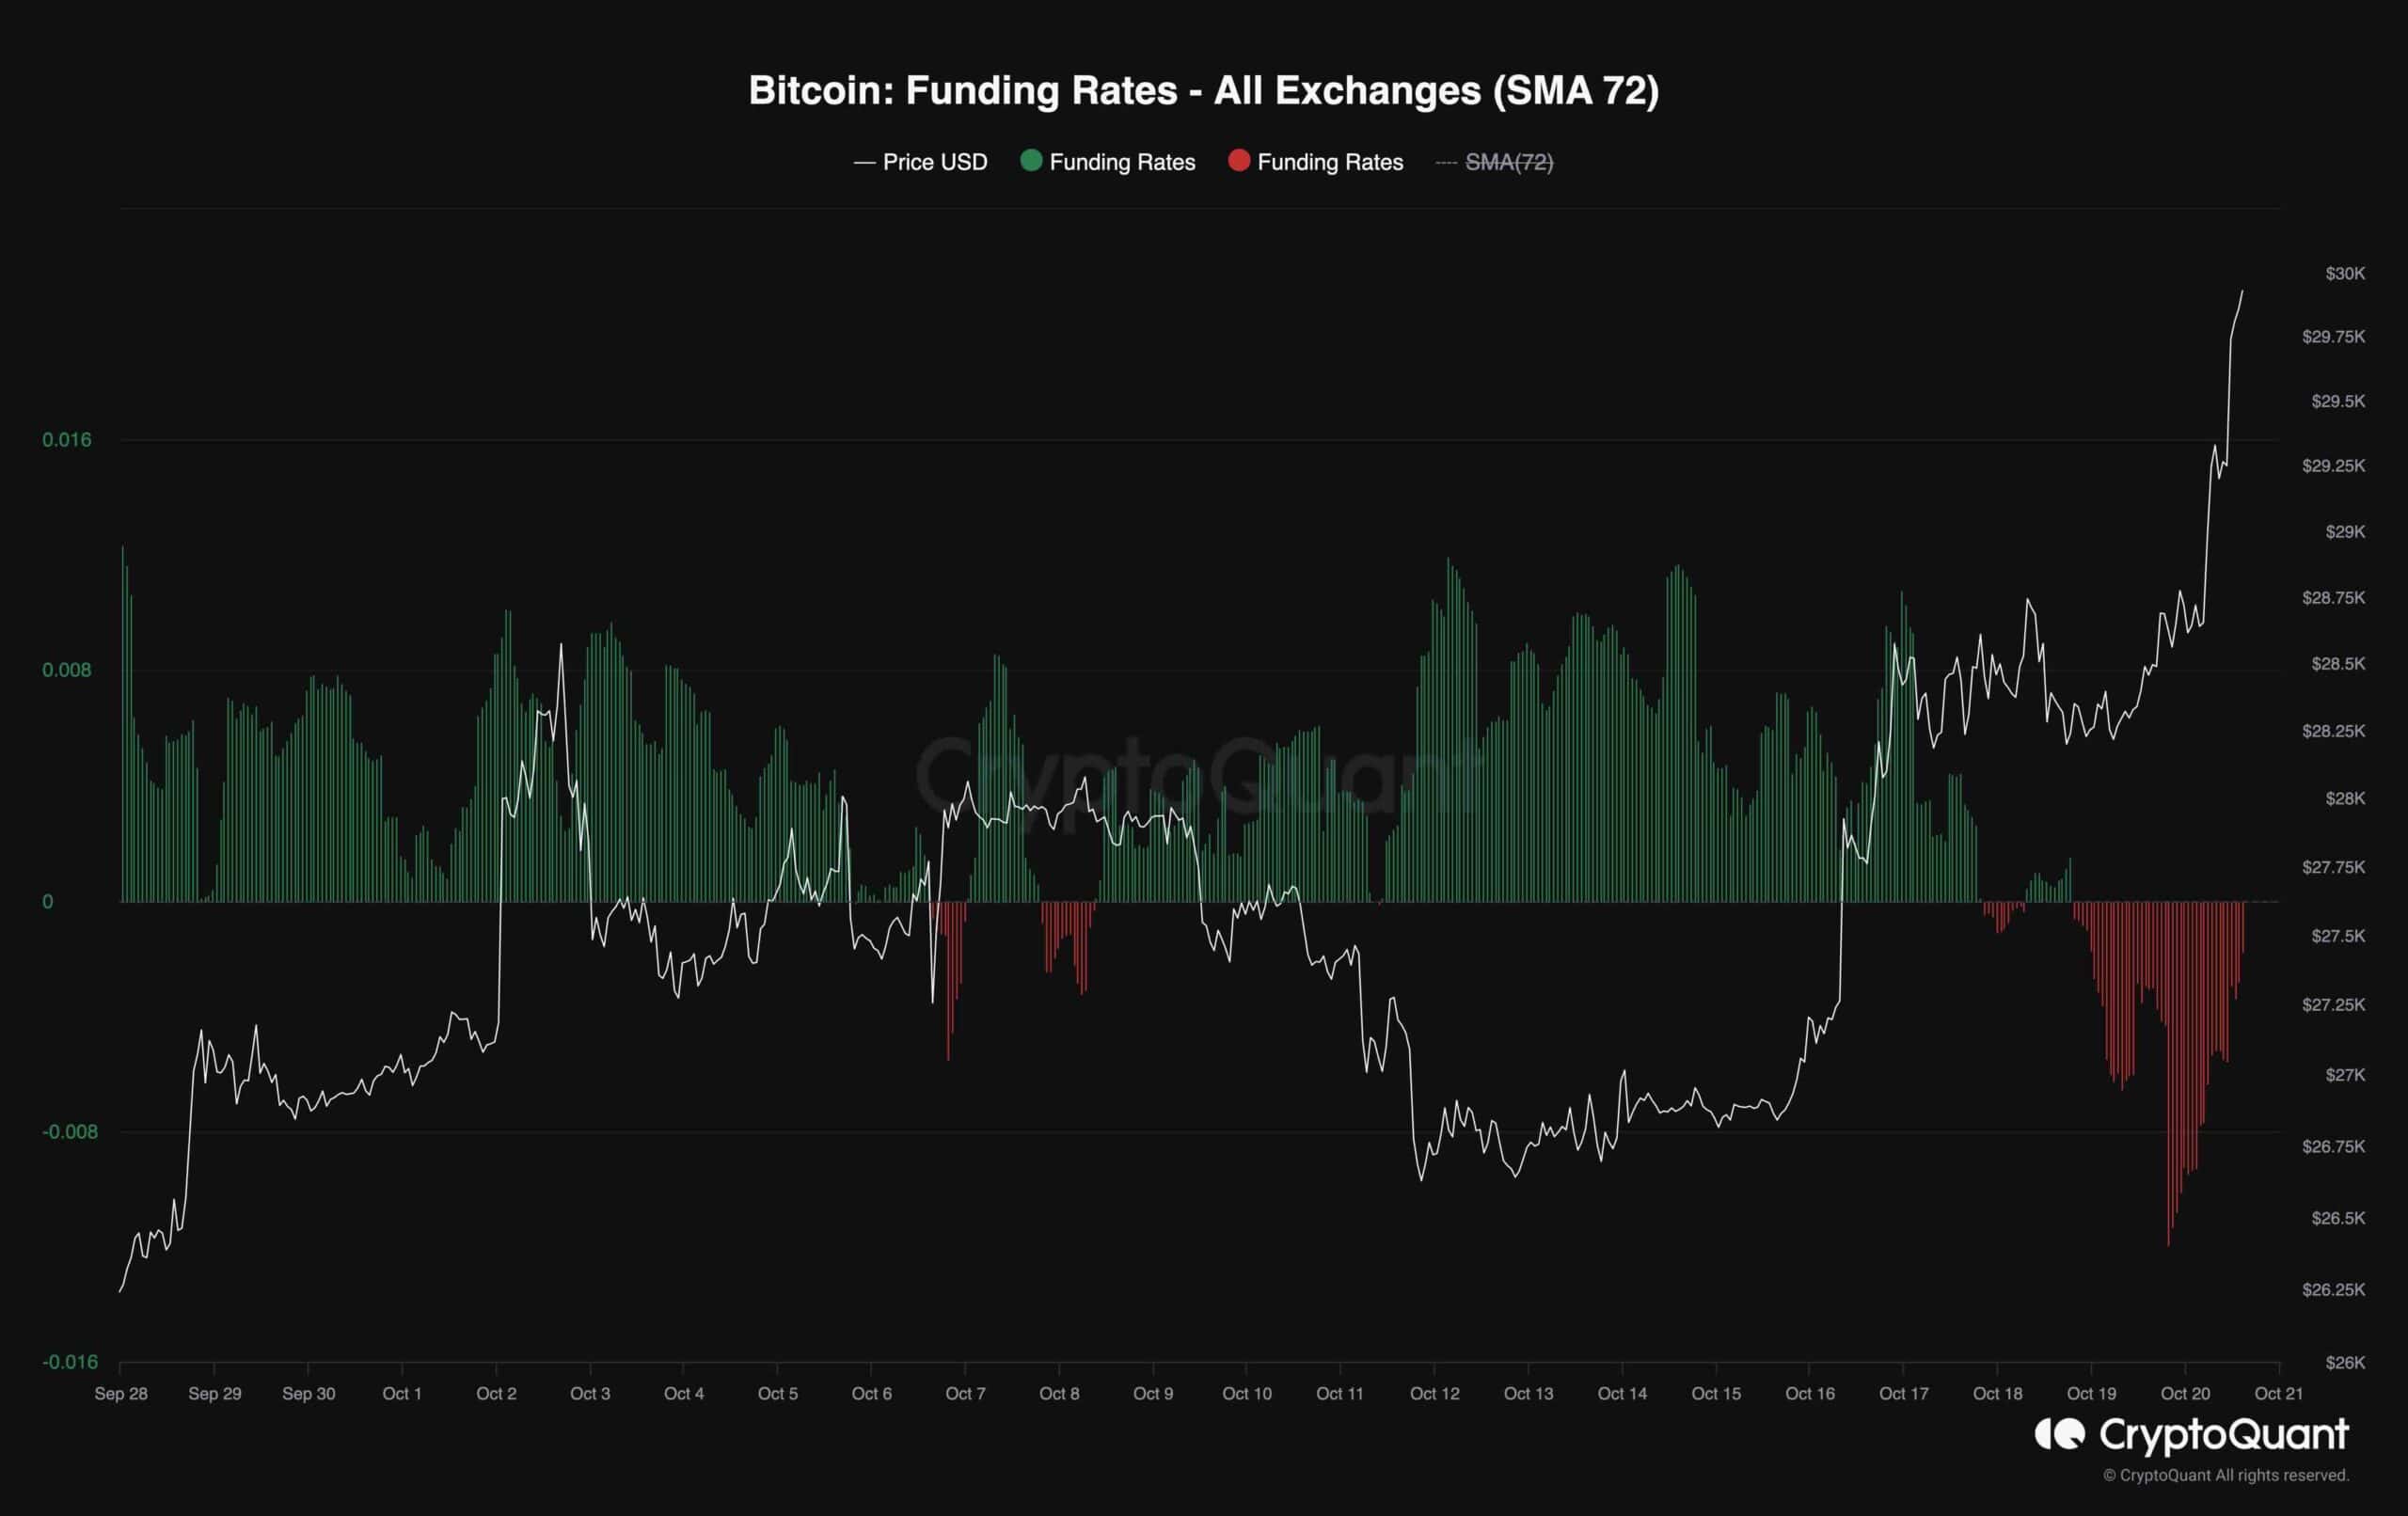
The funding rates metric, representing traders’ sentiments in the perpetual futures market, is noteworthy in this context. Positive funding rates signify the dominance of long-position traders, while negative rates indicate the dominance of short-position traders.
At the beginning of the price spike, the funding rates metric stayed above 0, indicating a bullish sentiment. However, recently, amid the impulsive surge in price, the metric has turned negative, signaling the entry of sellers into the market. This shift suggests a possible consolidation correction stage. However, if Bitcoin bulls manage to drive the price higher, there is a possibility of a short squeeze event occurring, resulting in an unexpected spike in prices.
The post Bitcoin Pushes $30K but Worrying Signs Beg for Caution: BTC Price Analysis appeared first on CryptoPotato.