Bitcoin Prices Topping $31.9K Would Confirm Long-Term Bullish Bias: Fairlead Strategies
Bitcoin (BTC) has rallied by 85% in the first half of 2023, outperforming traditional risk assets by a significant margin. Still, technical analysis research provider Fairlead Strategies remains long-term neutral on the world largest cryptocurrency by market value.
Per Fairlead, the long-term outlook will flip bullish once prices cross above “Ichimoku cloud” resistance at $31,900″ and momentum indicators like the MACD histogram validate the move.
“We remain long-term neutral on bitcoin, but a breakout above the weekly cloud and a monthly MACD ‘buy’ signal would dictate a bullish bias,” analysts at Fairlead Strategies said in a note to clients on Monday.
Created by Japanese journalist Goichi Hosoda in the late 1960s, the Ichimoku cloud is primarily used by traders and analysts to define support and resistance levels and identify momentum and trend direction. It comprises two lines – the leading span A and the leading span B. The gap between the two lines forms the cloud. Crossovers above or below the cloud are widely taken to represent bullish or bearish trend change.
The MACD histogram is a moving average-based indicator used to gauge trend strength and changes. Crossovers above zero represent a bullish shift in momentum, while crossovers below zero suggest otherwise.
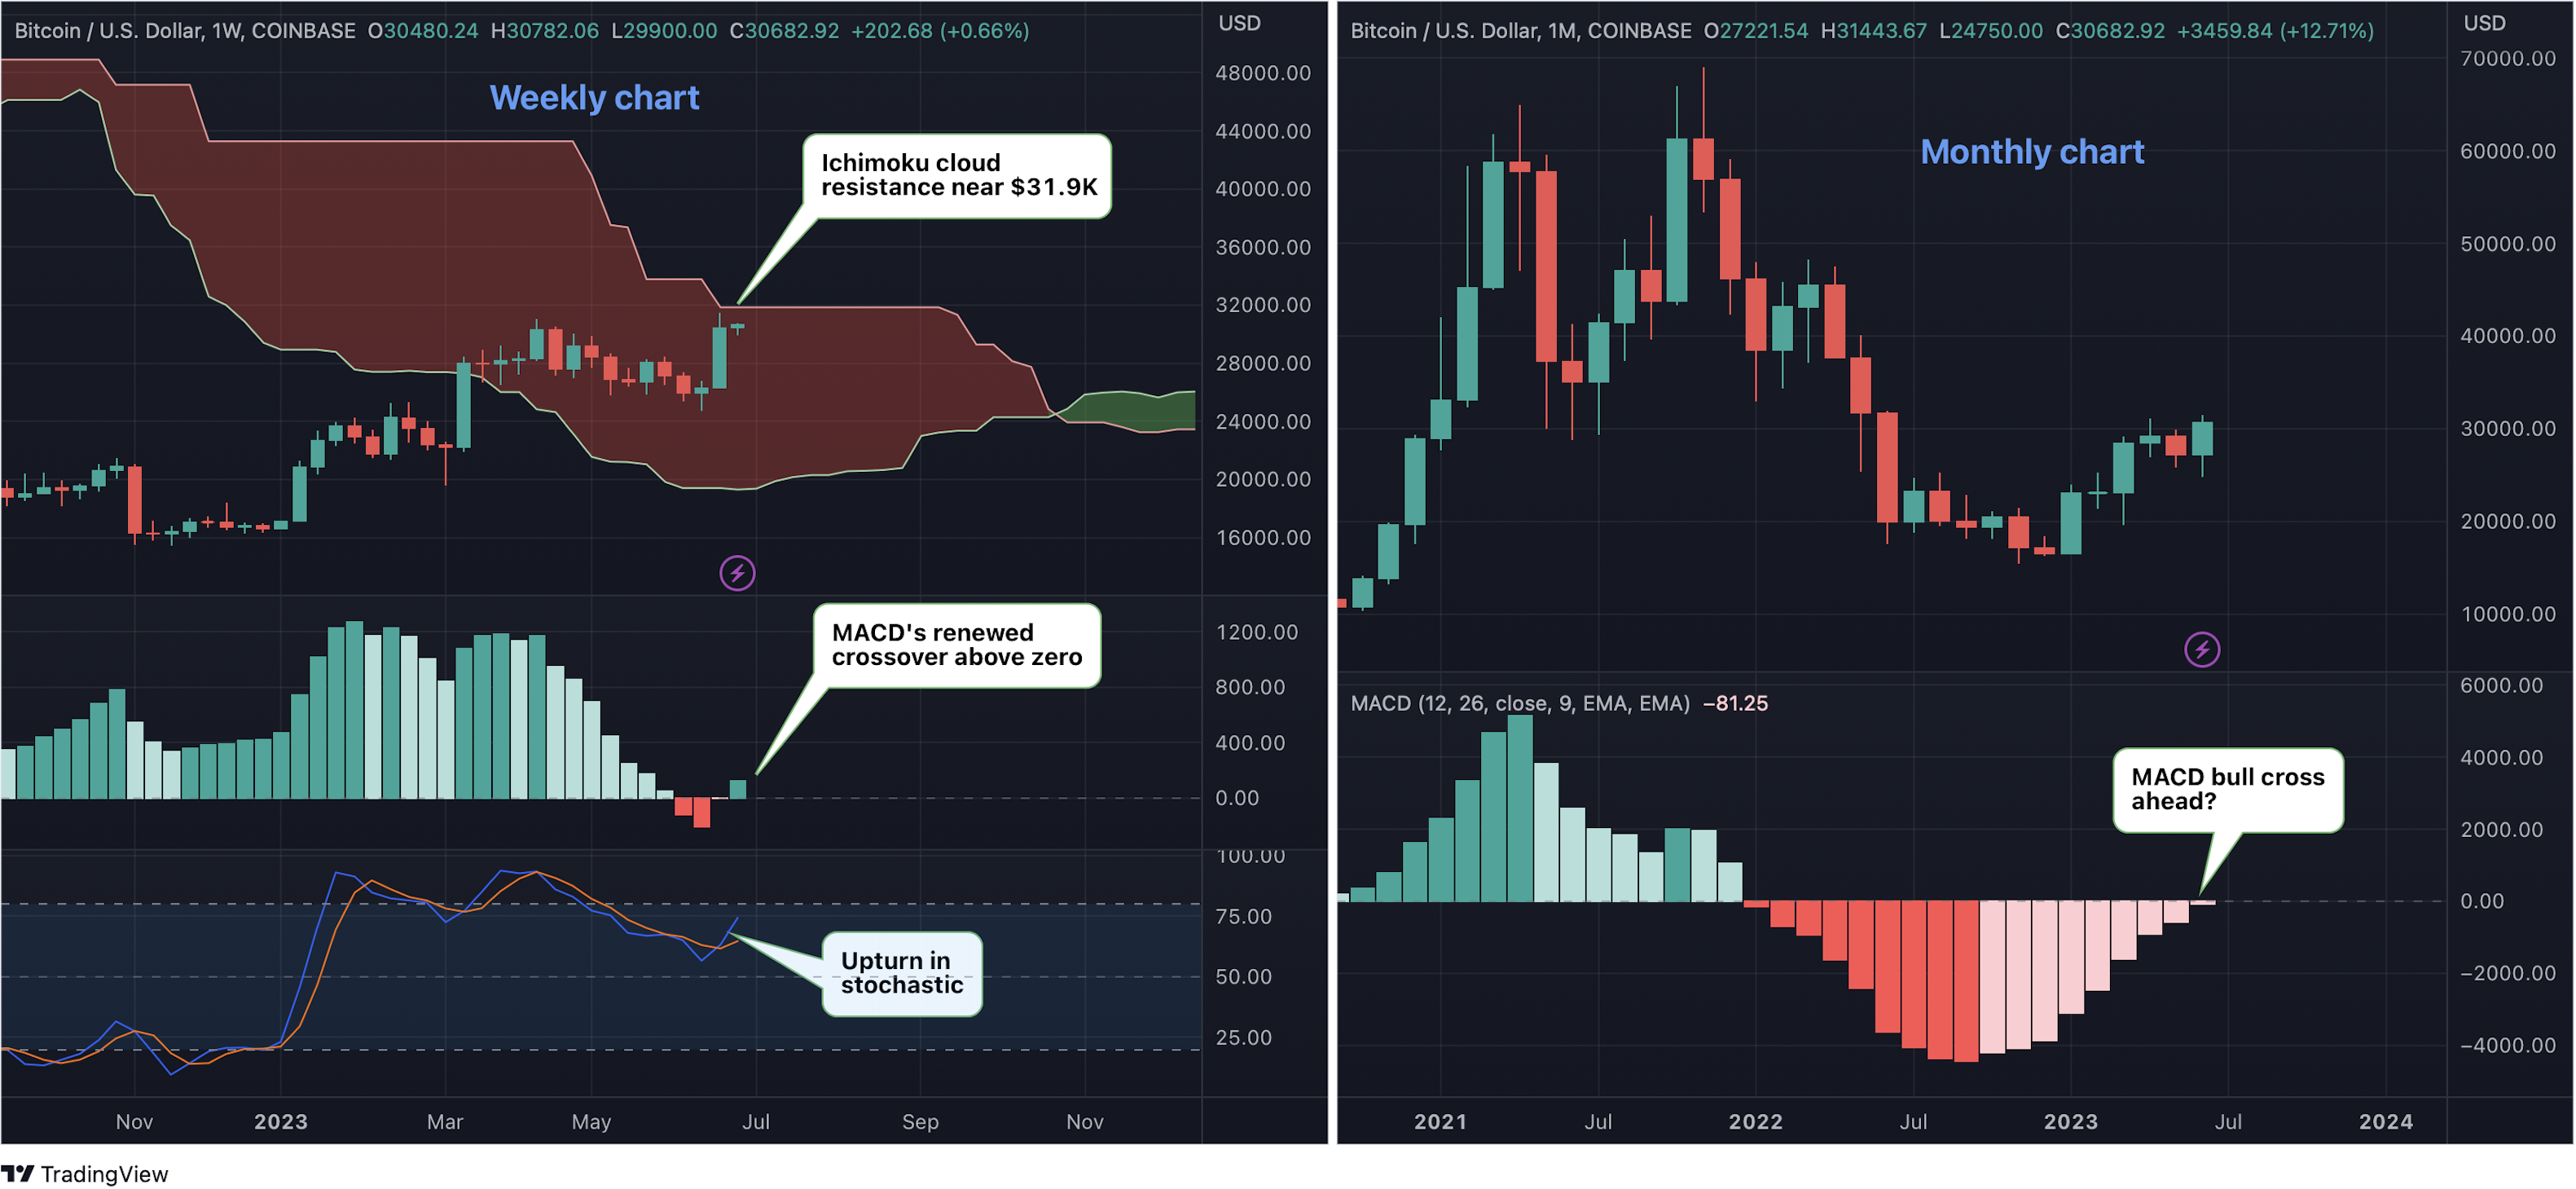
The weekly chart (above left) shows bitcoin is looking to extend past week’s 15.5% rise, the biggest since March.
At press time, the cryptocurrency is changing hands at $30,700, with the cloud resistance located at around $31,900.
The renewed positive reading on the weekly chart MACD and the upturn in the stochastic indicator suggest scope for a breakout above the cloud resistance, per Fairlead.
The monthly chart MACD is yet to flash the bullish signal.
Edited by Parikshit Mishra.