Bitcoin Price Analysis: This Is The First Major Test Of 2020 In The Road To $10,000 BTC
Over the past two days, we saw Bitcoin reaching the $9000 zone, quickly getting rejected, and now Bitcoin is once again a touch away from 2020 high.
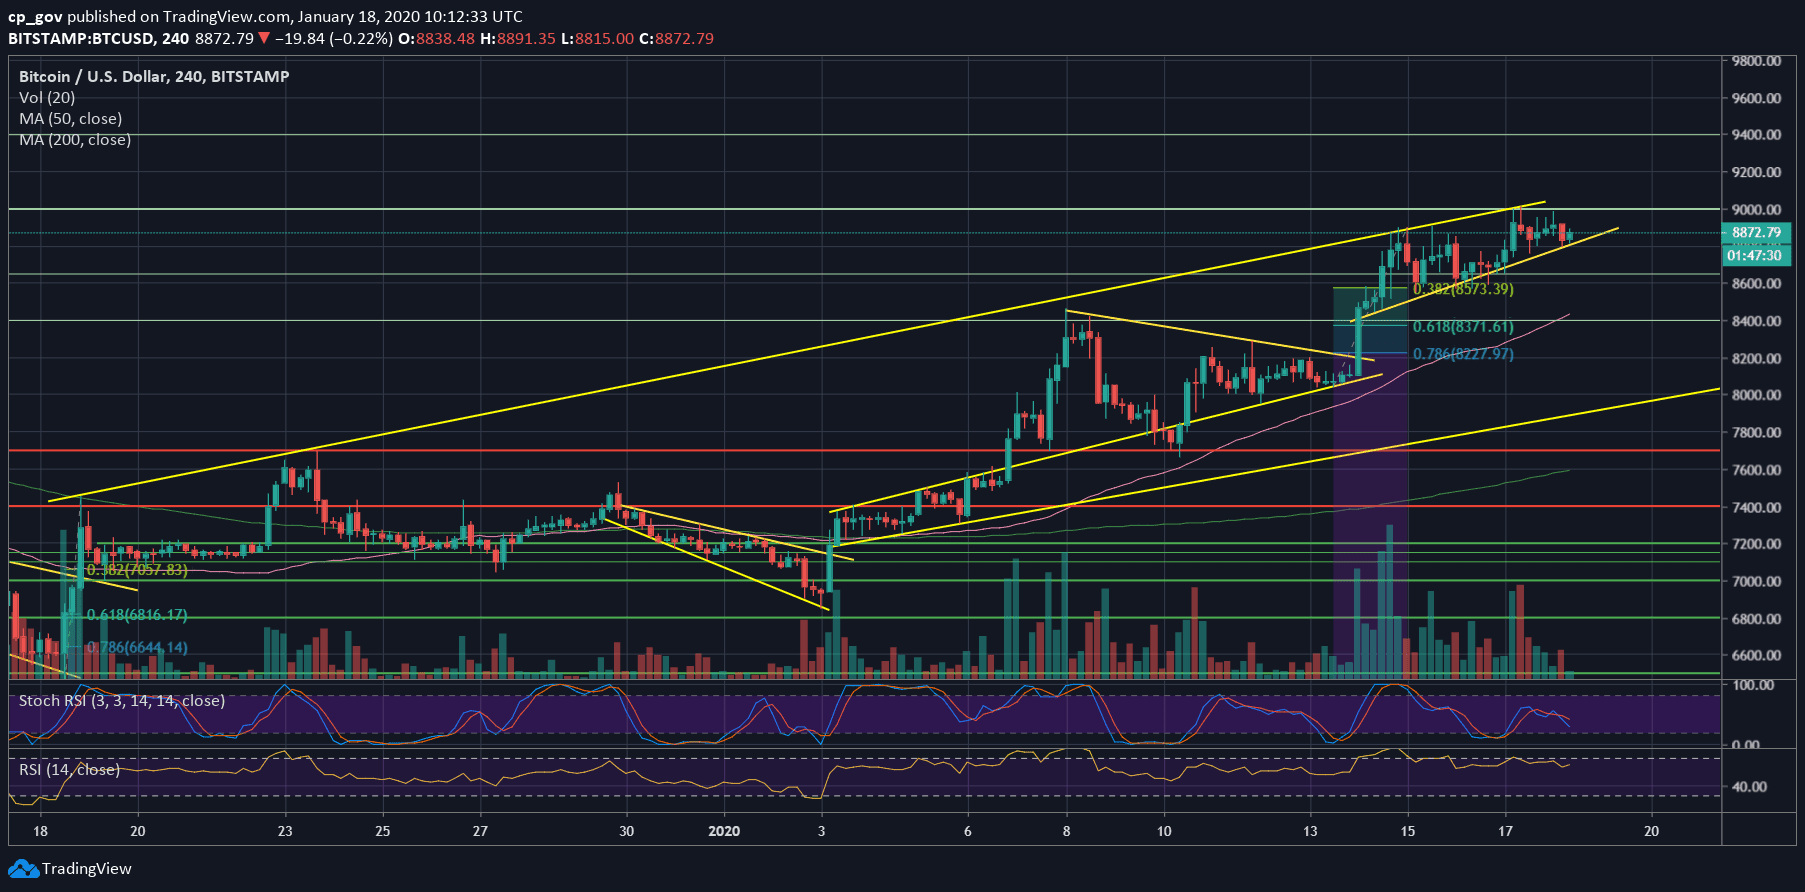
Two bullish signs to keep an eye on is the fact that Bitcoin corrected accurately into the 38.2% Fibonacci retracement level – which is considered a healthy correction of a rising trend. The second fact is the fact that the coin is forming an ascending channel (marked on the following 4-hour chart).
On the other hand, this channel can easily breakdown, and things can change quickly.
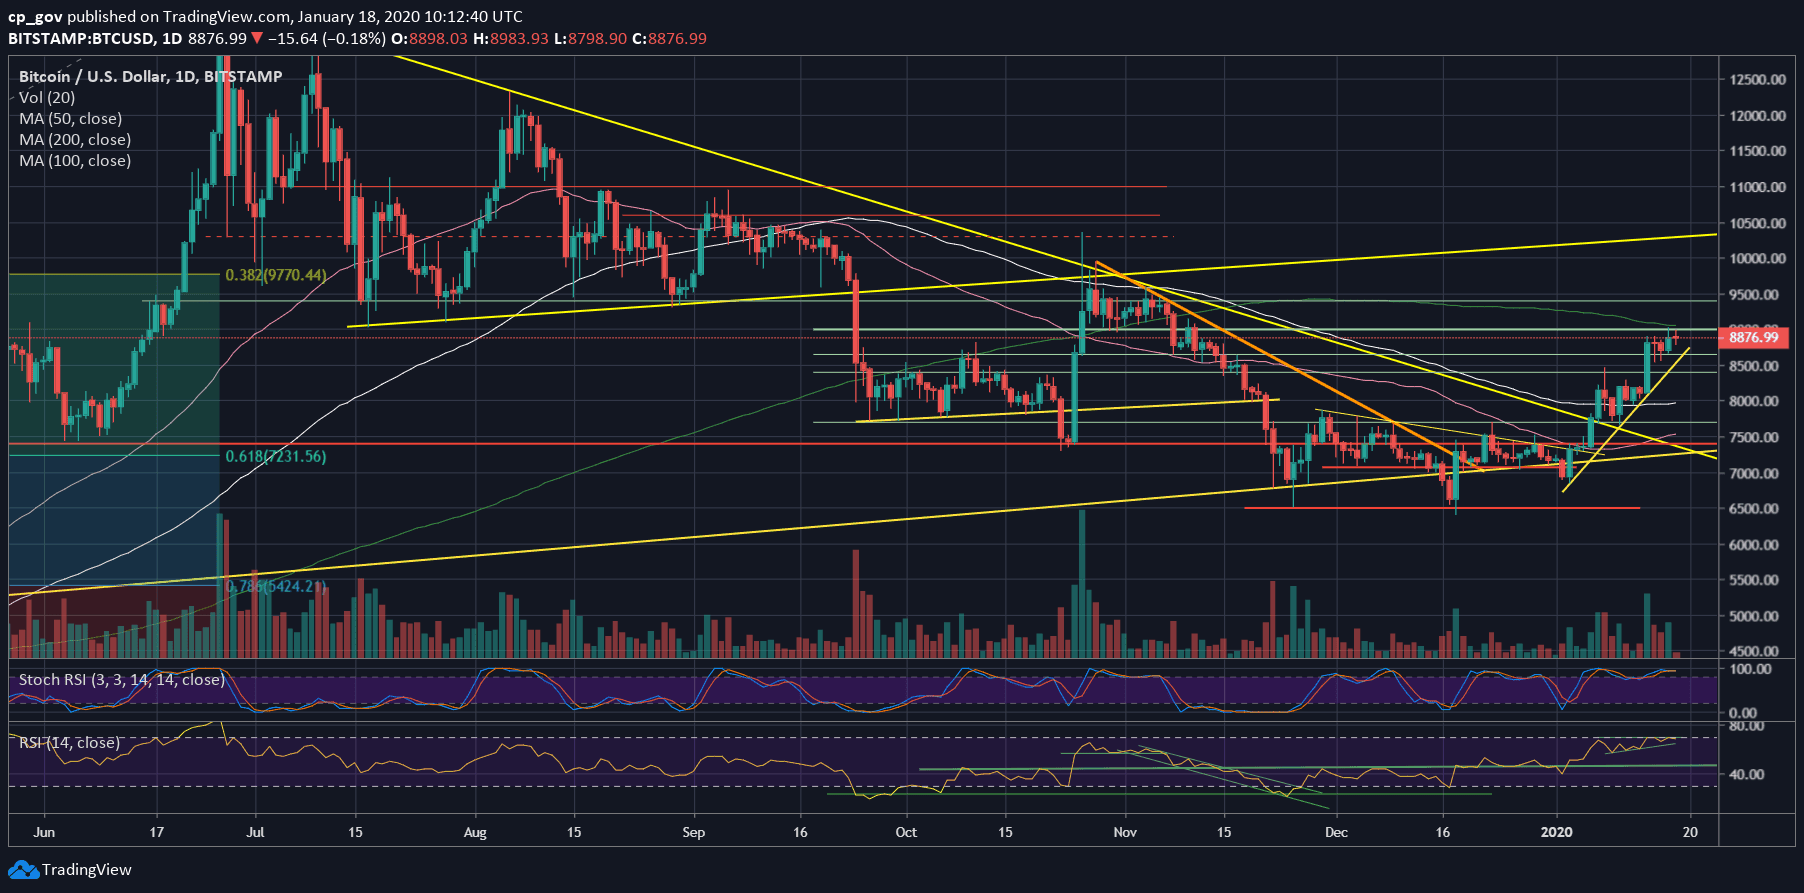
The $9000 resistance area contains the significant 200-days moving average line, currently hovering around $9050 (marked by a green line on the following daily chart). By no doubt, this is the first significant test of the new decade.
By many analysts, a must-have condition for a bull market is the asset being traded above that line. Bitcoin will have to show strength and decide soon how it interacts with the primary resistance line.
If we put aside the false breakout during November, when we saw the substantial daily 42% surge, the last time Bitcoin was trading above the MA-200 took place during late September 2019.
Total Market Cap: $244.0 billion
Bitcoin Market Cap: $161.5 billion
BTC Dominance Index: 66.2%
*Data by CoinGecko
Key Levels To Watch & Next Targets
– Support/Resistance levels: As of writing these lines, Bitcoin is finding support on the lower line of the ascending channel (marked on the 4-hour chart). This is the first level of support, along with $8800. Further below lies $8570 – $8600 (the 38.2% Fib level). Down below is $8400 (61.8% Fib level).
From above, the next major resistance level, as mentioned, is the $9000 price area along with the MA-200. In case of a breakout, then Bitcoin is likely to surge quickly to $9300 – $9400. Further above lies $9600 and $9800.
– The RSI Indicator: The RSI is building a bullish triangle formation, which can fuel a possible breakout of the $9000 area. This is the highest level of the momentum indicator since June (when Bitcoin spiked to $13,880).
– Trading volume: Since Tuesday, the volume had been decreased, however, the trading volume is still high compared to the monthly average.
BTC/USD BitStamp 4-Hour Chart
BTC/USD BitStamp 1-Day Chart
The post Bitcoin Price Analysis: This Is The First Major Test Of 2020 In The Road To $10,000 BTC appeared first on CryptoPotato.