Bitcoin Price Analysis Sep.7: Where is the bottom?
Lots of bloody altcoins and Bitcoin over the past two days. Bitcoin had lost $1000 in less than a day. More on what have happened – you can read on our featured article from yesterday. To sum it up, some large institution, who opened the huge 10,000 BTC short position (that was reported here) had made lots of money.
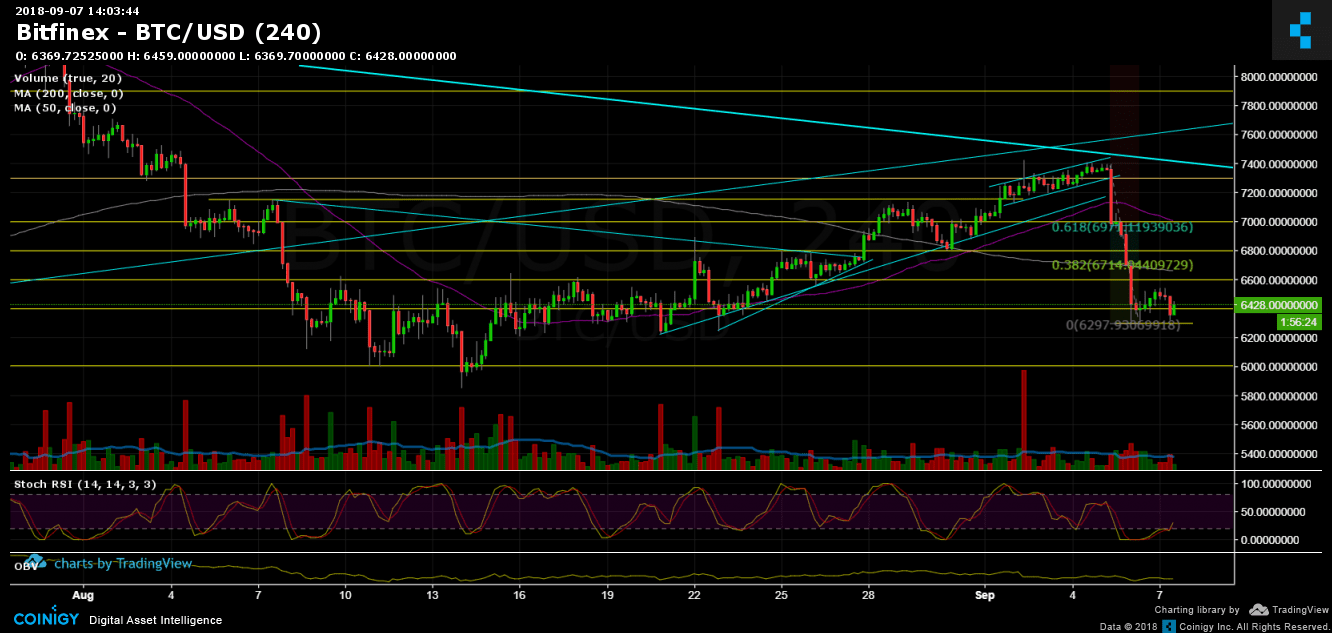
Back to the technical analysis: Bitcoin had broke all the major support levels including $7000, moving average 50 and 200 days, $6600, till it reached a low of $6300 on Bitfinex. This is where lies the current support level. The situation is very fragile. Market seems to be weak (yes, situations in crypto tend to change quickly). So weak hands can even lower the price more, to re-test strong support at $6000 and then to the yearly low at $5700 – $5800.
Low RSI levels can lead to a possible correction back to %38.2 Fibonacci retracement level at $6600 – $6700 and also to $7000. Till the market stays below $7000 mark I would consider it bullish and weak and the chances we would see a new yearly low are getting higher.
To sum up
Support levels lie at $6300, $6200, $6000, $5800 area (yearly low).
Resistance levels lie at $6600 – $6700 (strong resistance – MA-200 and Fibb level, $7000 MA-50).
Bitcoin Prices: BTC/USD BitFinex 4 Hours chart
Cryptocurrency charts by TradingView. Technical analysis tools by Coinigy.
The post Bitcoin Price Analysis Sep.7: Where is the bottom? appeared first on CryptoPotato.