Bitcoin Price Analysis Sep.5: Will $7000 Hold?
When any asset fails to break up after consolidation – the momentum dies suddenly. Especially when dealing with volatile Bitcoin. Bitcoin was looking very good till lately, but it might be enough: in less than 60 minutes Bitcoin had lost $400 of its value. As what looks to be a long squeeze.
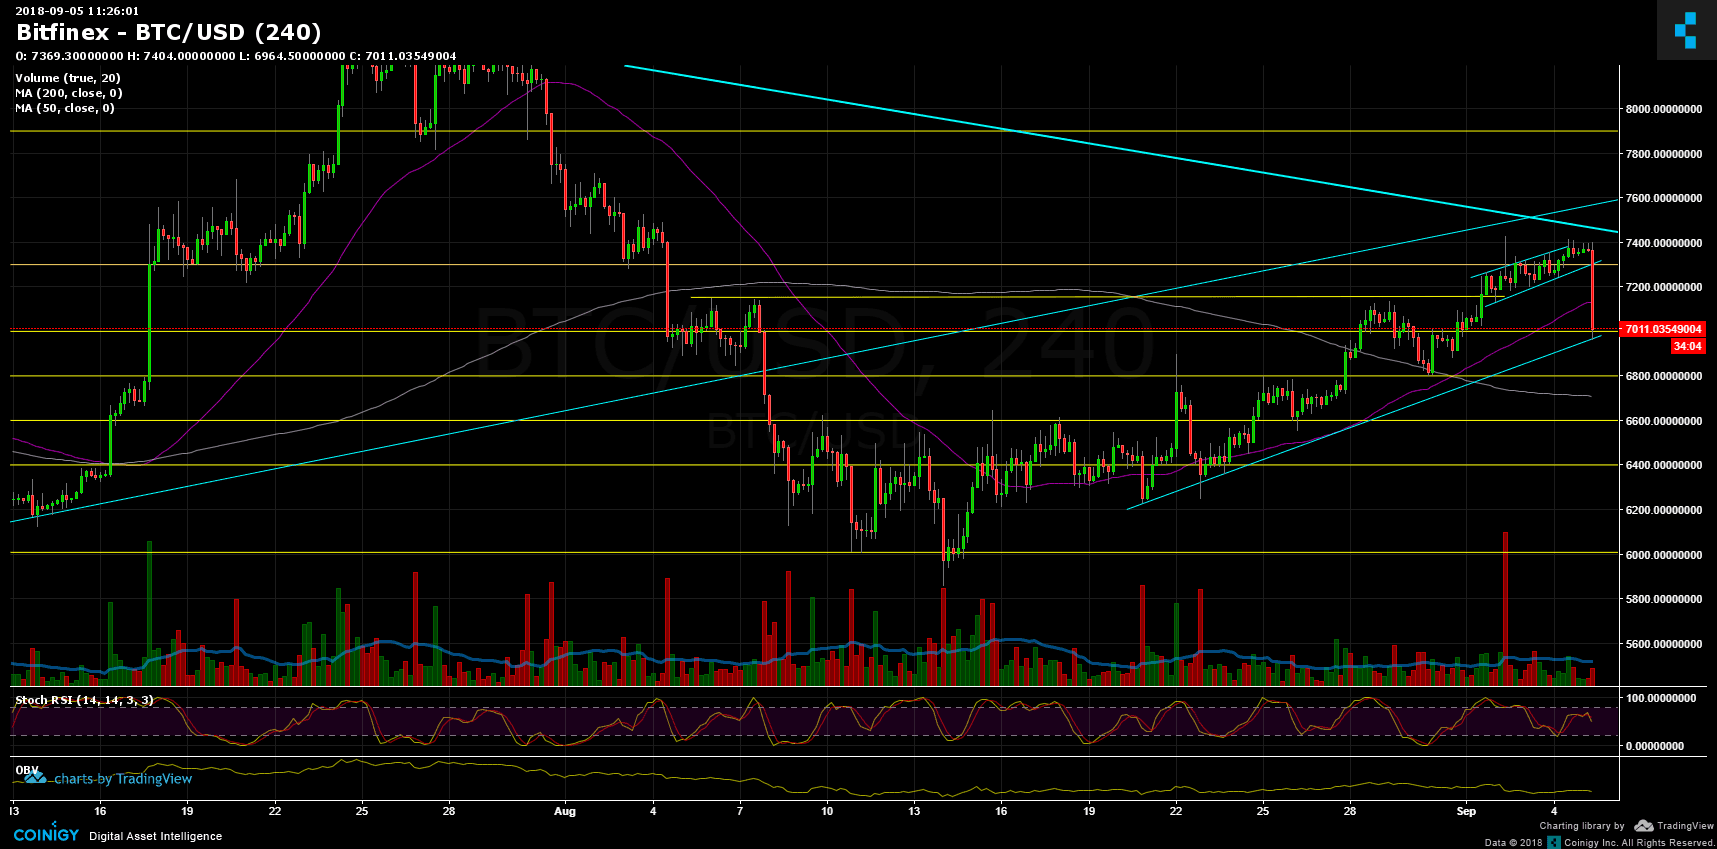
It’s now unclear what the real reason is, but the fact is that Bitcoin had broke the major support at $7300, $7140 (the 50 days moving average) and as of writing this update the $7000 major support along with the ascending line is being tested.
Breaking it down, and Bitcoin should visit the $6800 very quickly. The next major area of support is the $6700 zone where lies the moving average 200 days.
This is how it works – Bulls Take the Stairs and Bears Take the Elevator down.
To sum up
Support levels lie at $7000, $6800 (strong support), $6700.
Resistance levels lie at $7140, $7300, $7500 – $7600 (the long-term descending line).
Bitcoin Prices: BTC/USD BitFinex 4 Hours chart
Cryptocurrency charts by TradingView.
The post Bitcoin Price Analysis Sep.5: Will $7000 Hold? appeared first on CryptoPotato.