Bitcoin Price Analysis Sep.29: A Volatile Weekend
Following our price analysis from yesterday, the futures’ expiration at the CME exchange caused lots of price action, as expected.
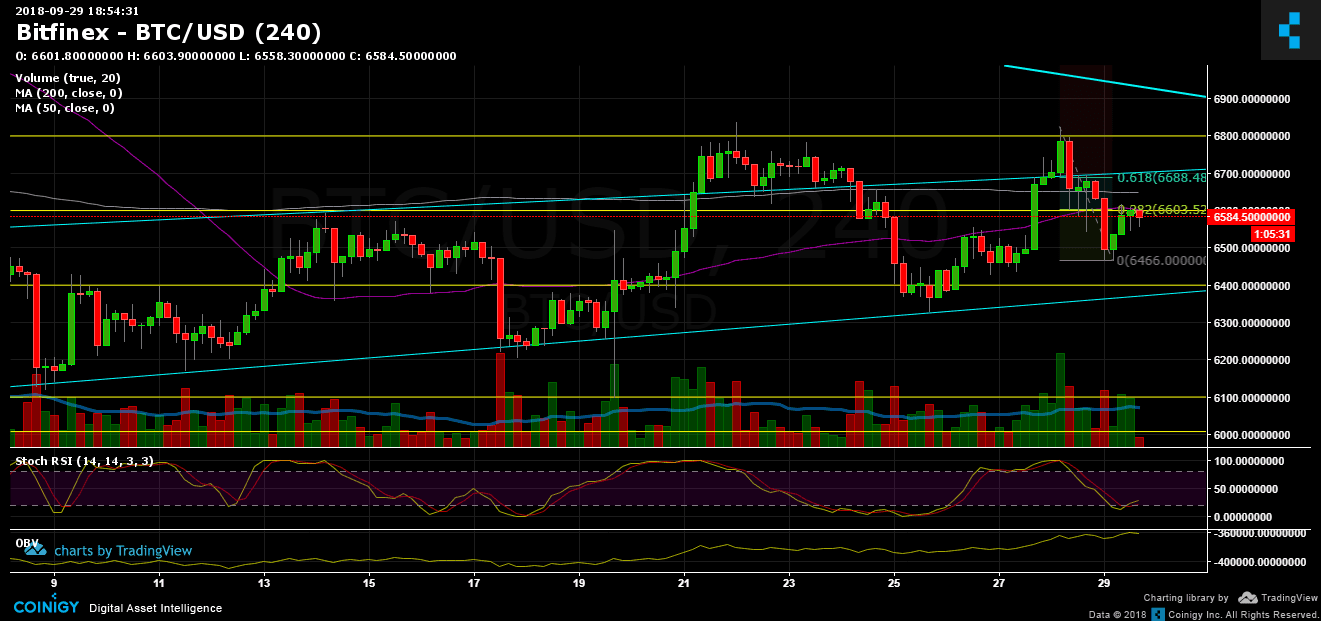
Bitcoin went down to the $6400 area, breaking down the 50 days moving average line (purple on the chart). So far, Bitcoin had recovered nicely, to re-test the moving average from below, this time as a resistance.
Now what?
- Over the past hours, Bitcoin is struggling with the $6600 resistance, along with the 50 days moving average (support-turned resistance). This area is also the 38.2% Fibonacci retracement (marked on the chart below).
- Breaking up the $6600 resistance area will likely to send BTC to its next resistance at $6700 (61.8% Fibonacci retracement) and to re-test the double top at $6830. Next is the long-term descending trend-line is getting lower, and now it’s around the $6900 level.
- From the bear side, support lies at $6470, $6400 (ascending trend-line), $6300 and $6250.
- Stochastic RSI had crossed at it’s low level. Market is oversold.
- As always: To declare an end to the long-term bear market, Bitcoin will need to create a higher low and break past $7300 (the last major high on the weekly chart).
- Bitcoin short positions on BitFinex are not something significant.
- Trading volume is relatively low, which is typical to weekends.
Bitcoin Prices: BTC/USD BitFinex 4 Hours chart
 Cryptocurrency charts by TradingView. Technical analysis tools by Coinigy.
The post Bitcoin Price Analysis Sep.29: A Volatile Weekend appeared first on CryptoPotato.