Bitcoin Price Analysis Sep.25: Optimism has disappeared?
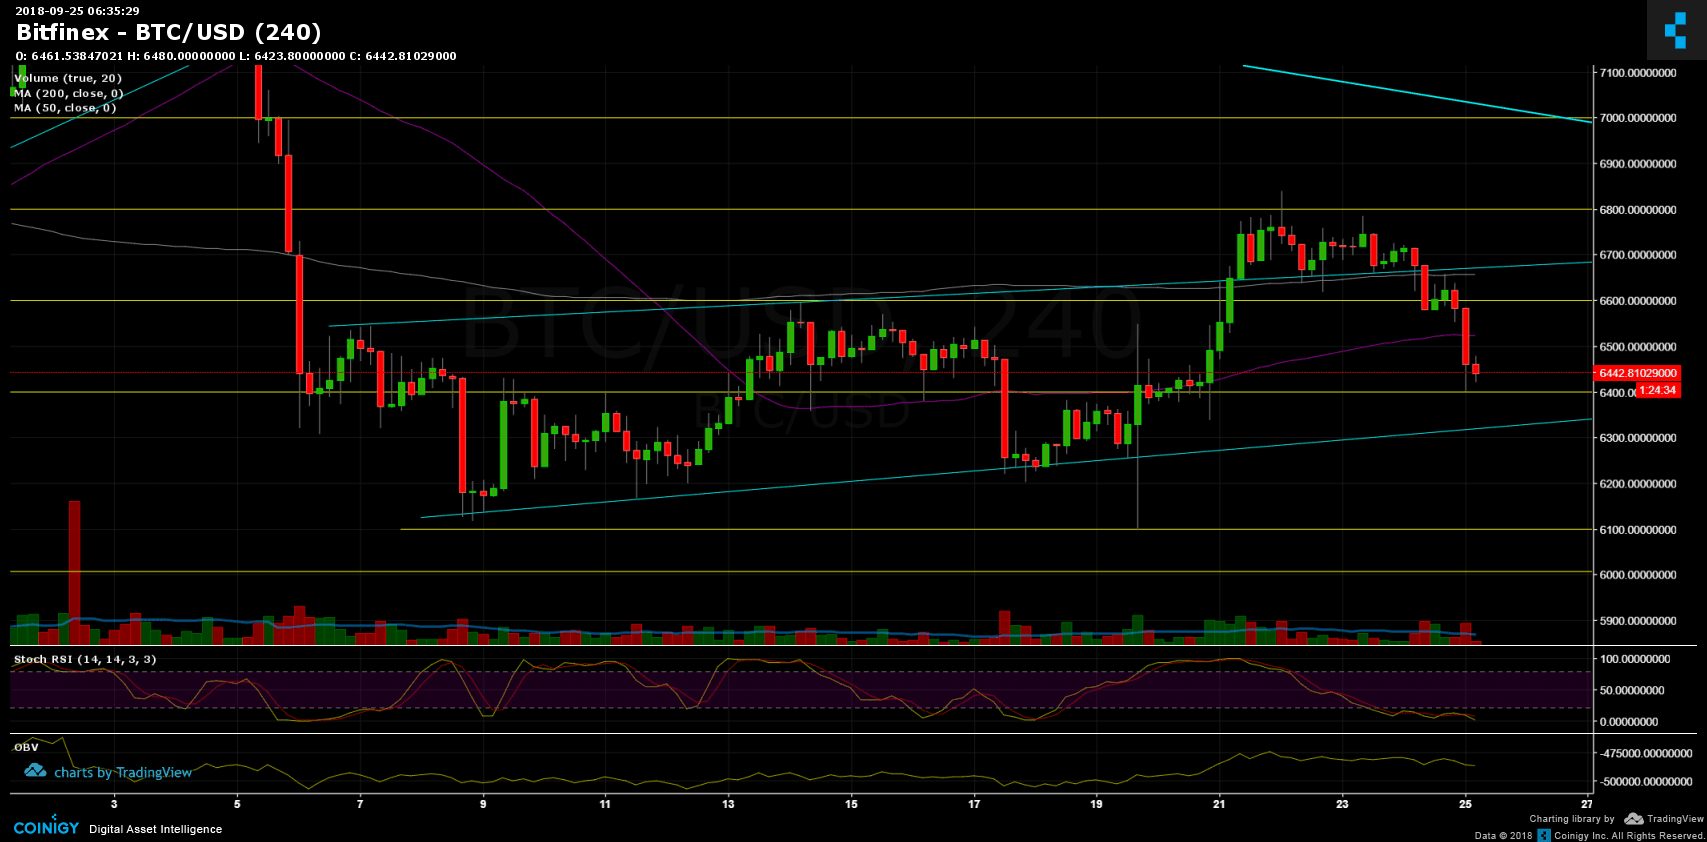
After almost a week full of optimism, Bitcoin has taken a nosedive breaking the ascending trend-line and the 200 day moving average (the pink line on the chart) at $6660.This level has been retested and was met with major resistance and then took a plunge even breaking the important 50 day moving average (the purple line on the chart) to the major support level of $6400.
Why did this happen when we were all optimistic? A reason might be the SEC’s unclear statement about the ETF. It was expected to be delayed, but there is still a possibility of the SEC rejecting the ETF before the original deadline on Sep.30.
Now what?
- As of writing this, the $6400 seems to hold and we might see a little correction to re-test the 50 day moving average from below, this time as resistance. There also lies the 38.2% Fibonacci retracement.
- , If this level does not hold this move might end up in the support level and ascending line around $6300. Next support areas are at $6100 and $6000.
- Again: To declare an end to the long bear market, Bitcoin will need to create a higher low and break past $7300 (the last major high on the weekly chart), now it seems less likely .
- From the bull side, $6520 and $6660 are now support-turned resistance levels. $6800 is still the major resistance area Bitcoin has failed to overcome.
- Looking at the 4-hour chart, the Stochastic RSI indicator is very low, indicating that the market is oversold. This supports the option for a correction back to re-test prior resistance.
- Also, Bitcoin short positions on BitFinex have decreased significantly.
- Trading volume, typical at weekends was relatively low.
Bitcoin Prices: BTC/USD BitFinex 4 Hours chart
 Cryptocurrency charts by TradingView. Technical analysis tools by Coinigy.
The post Bitcoin Price Analysis Sep.25: Optimism has disappeared? appeared first on CryptoPotato.