Bitcoin Price Analysis Sep.17: On the cliff?
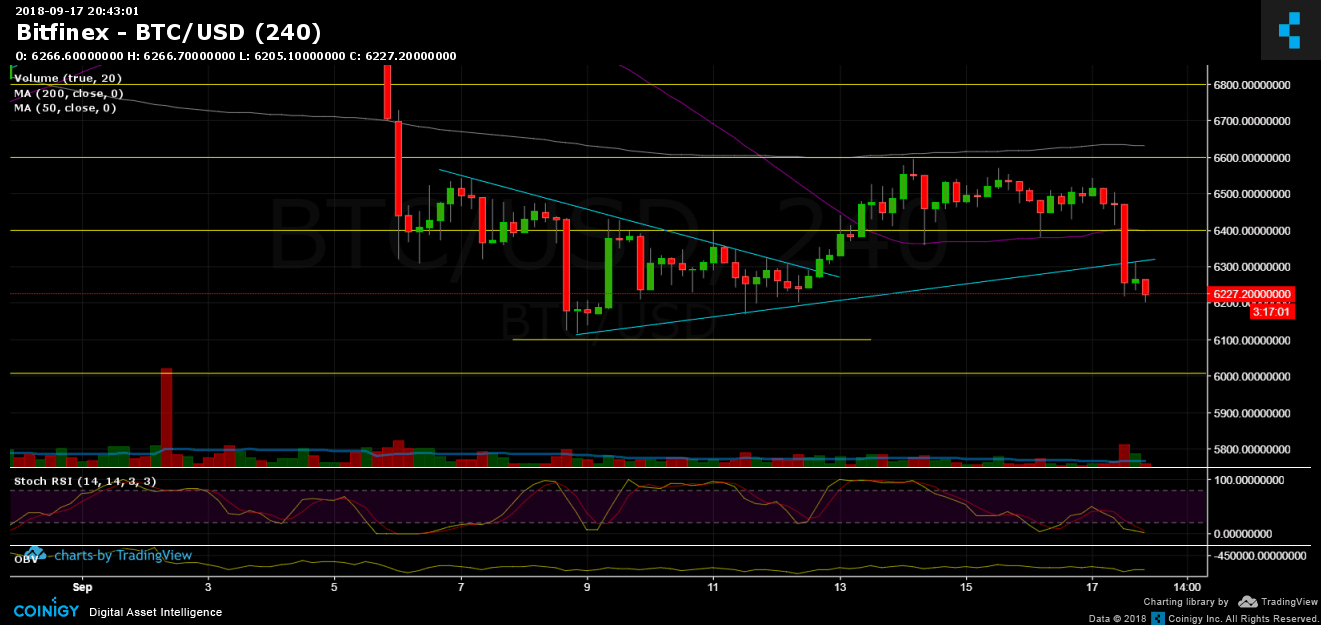
A lot has happened over the past 12 hours surrounding Bitcoin’s price. The important range (from yesterday’s analysis) had been broken: Bitcoin lost support at $6400, going below the 50 days moving average (purple line).
- After testing it twice over the past two days, Bitcoin had lost the the critical support level of $6400.
- Bitcoin also broke the descending line at $6315, and then re-tested it again as support-turned resistance.
- As expected – breaking down the range was followed by a major move ($200) in the same direction (down).
- As of now, Bitcoin is testing the $6200 support level. Next support lies at $6100, $6000, before getting to the danger all-time yearly low at $5700 – $5800.
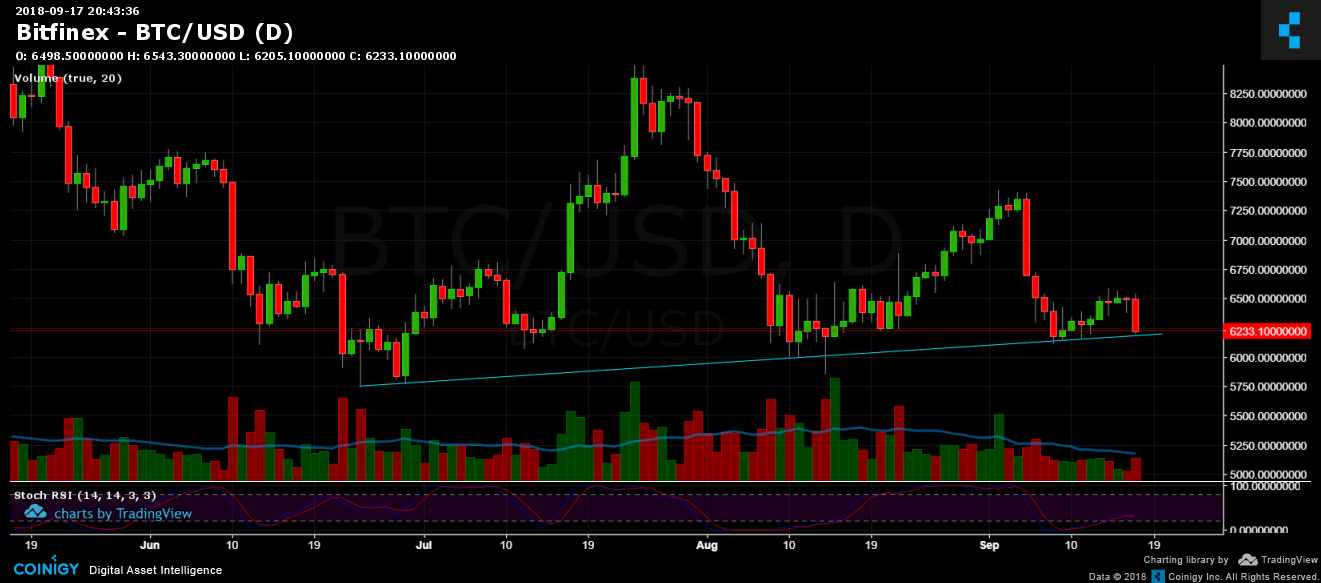
- Looking at the 1 day chart (the second below), there is a strong resistance around $6200 – $6180 of the ascending trend line, which its formation started on June 24, the yearly low.
- Looking at the 4 hours chart, the RSI indicator is at its low levels, which points to the market being oversold. We might see a correction to previous resistance level at $6300 before continue the way down (Fibonacci retracement level %38.2 to the last decline also lies around $6300).
- Trading volume is also increasing (a bearish mark).
- BTC shorts amount on BitFinex has been increased rapidly and getting very close to their all-time high.
- From the less-likely to happen bull market: Resistance levels lie at $6300, $6400 and $6600.
Like mentioned here before: trade with caution! the sea is dangerous.
Bitcoin Prices: BTC/USD BitFinex 4 Hours chart
Bitcoin Prices: BTC/USD BitFinex 1 Day chart
Cryptocurrency charts by TradingView. Technical analysis tools by Coinigy.
The post Bitcoin Price Analysis Sep.17: On the cliff? appeared first on CryptoPotato.