Bitcoin Price Analysis Oct.16: Where are we after yesterday’s madness?
Some will say it’s “business as usual,” others will say that yesterday is a turning point. Whether to the bullish side (with the breaking of the long-term descending line) or to the bearish side (Tether is likely to cause significant damages to the crypto industry).
What is for sure is that we can’t rely anymore on the BitFinex Bitcoin chart since it’s trading against Tether or USDT. From now on, we will analyze the BitStamp Bitcoin USD chart.
Regarding the pump from yesterday – since it was like a pump and dump movement, it can be seen only as the tail of the 4-hour candle. Of course, the trading volume of that candle was gigantic.
Now what?
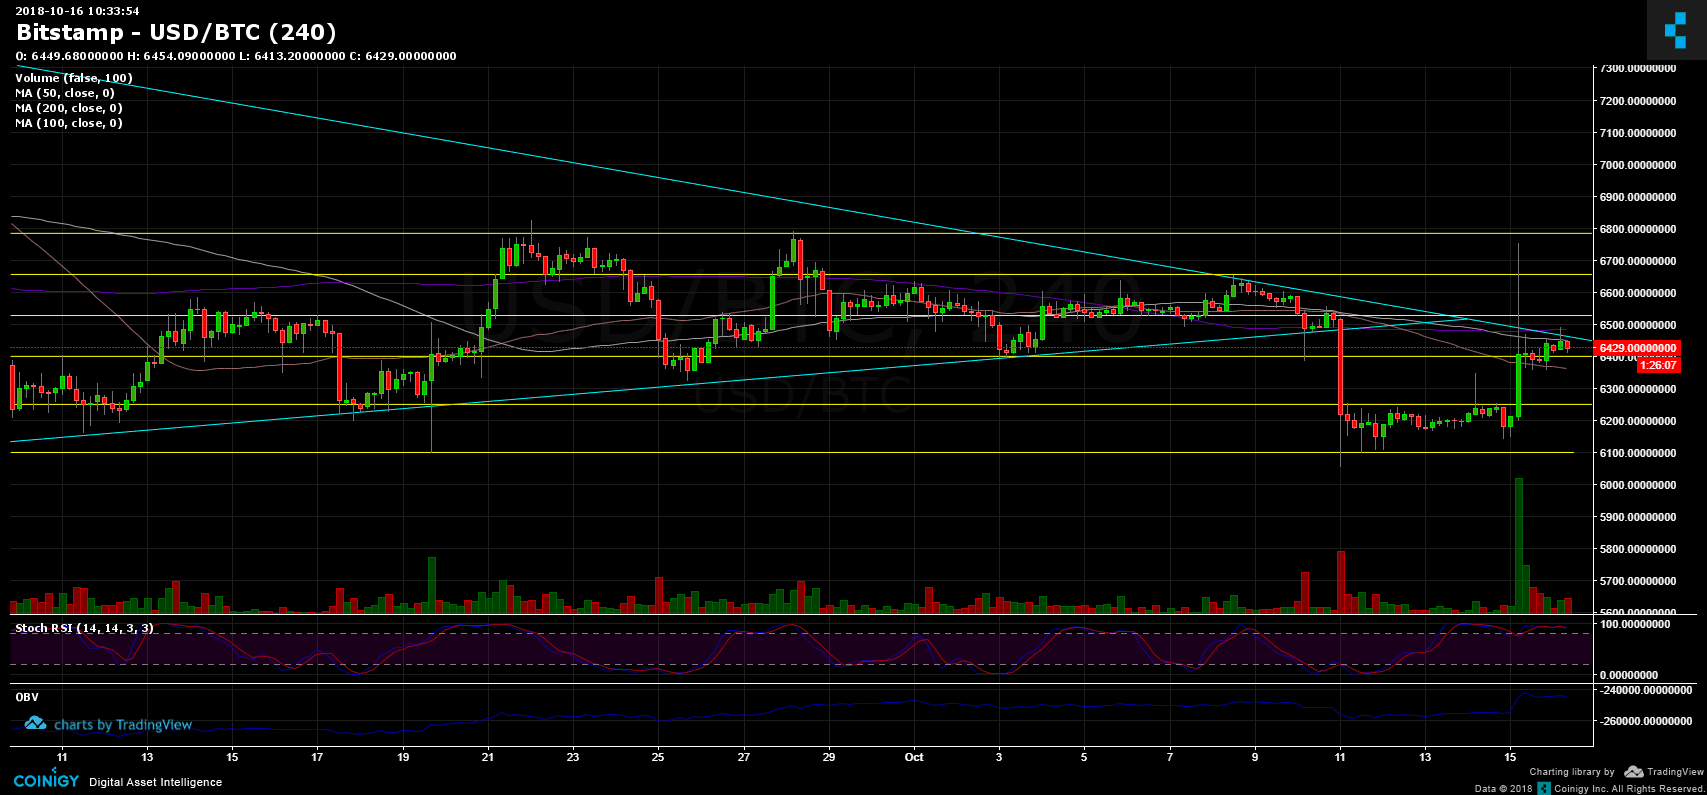
- Bitcoin is testing the long-term descending trend-line, which started somewhere around March this year when Bitcoin’s price was about $11,700. This is a tough resistance area including the 200 and 100 days moving average lines (purple line represents the MA-200, white line represents MA-100).
- The overall momentum is still bearish. I would start thinking about the market as bullish in a scenario of creating a higher-low and breaking above $6800. Yesterday, the peak reached close at $6756 on BitStamp.
- From the bearish side – support lies at current levels around $6400 (along with 50 days moving average line around $6350). Next support lies at $6250 and after is $6100.
- After yesterday’s short squeeze, BitFinex short positions are starting to accumulate again.
- RSI levels are at their high levels; Market is overbought as of now.
BTC/USD BitStamp 4 Hours chart
 Cryptocurrency charts by TradingView. Technical analysis tools by Coinigy.
The post Bitcoin Price Analysis Oct.16: Where are we after yesterday’s madness? appeared first on CryptoPotato.