Bitcoin Price Analysis: November’s Candle Ended Very Bearish, What Does It Mean For December?
From euphoria to depression: The recent volatility in the price of Bitcoin had burned many shorts and longs. Heaven for traders, hard times for the HODLers.
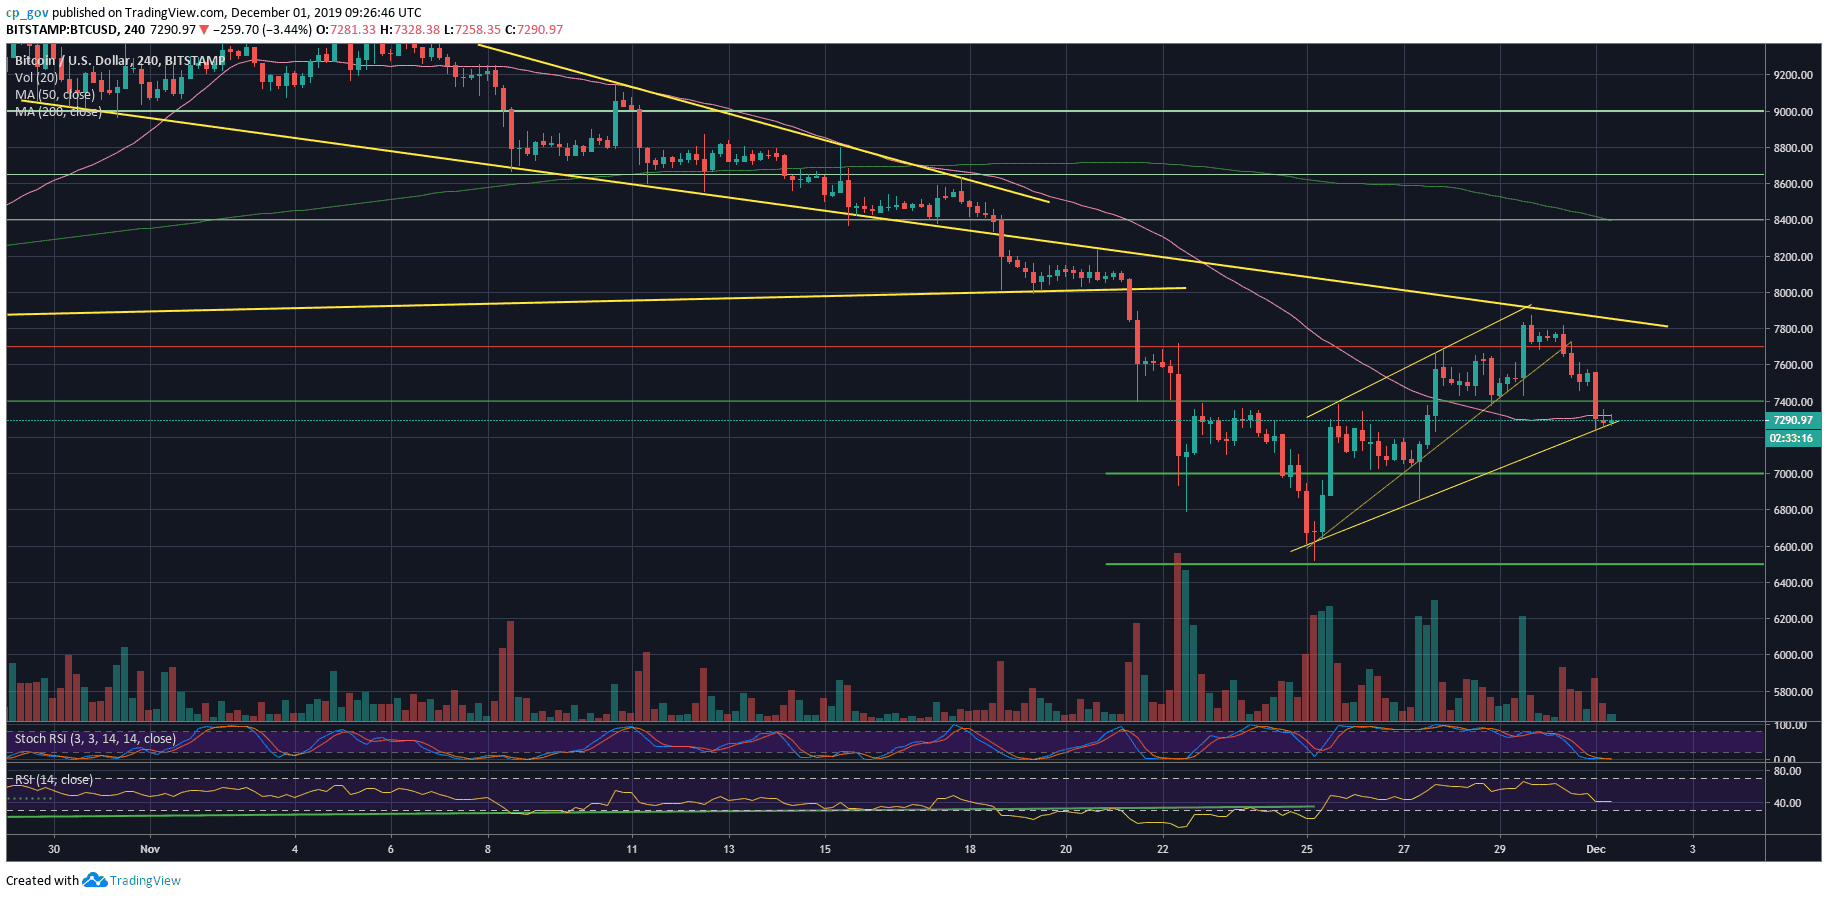
On Friday, just two days ago, everyone was bullish, following a breakout of a decent inverse head and shoulders pattern (at $7400). Following our recent analysis, the huge bullish move had indeed arrived, but couldn’t resist beyond $7870.
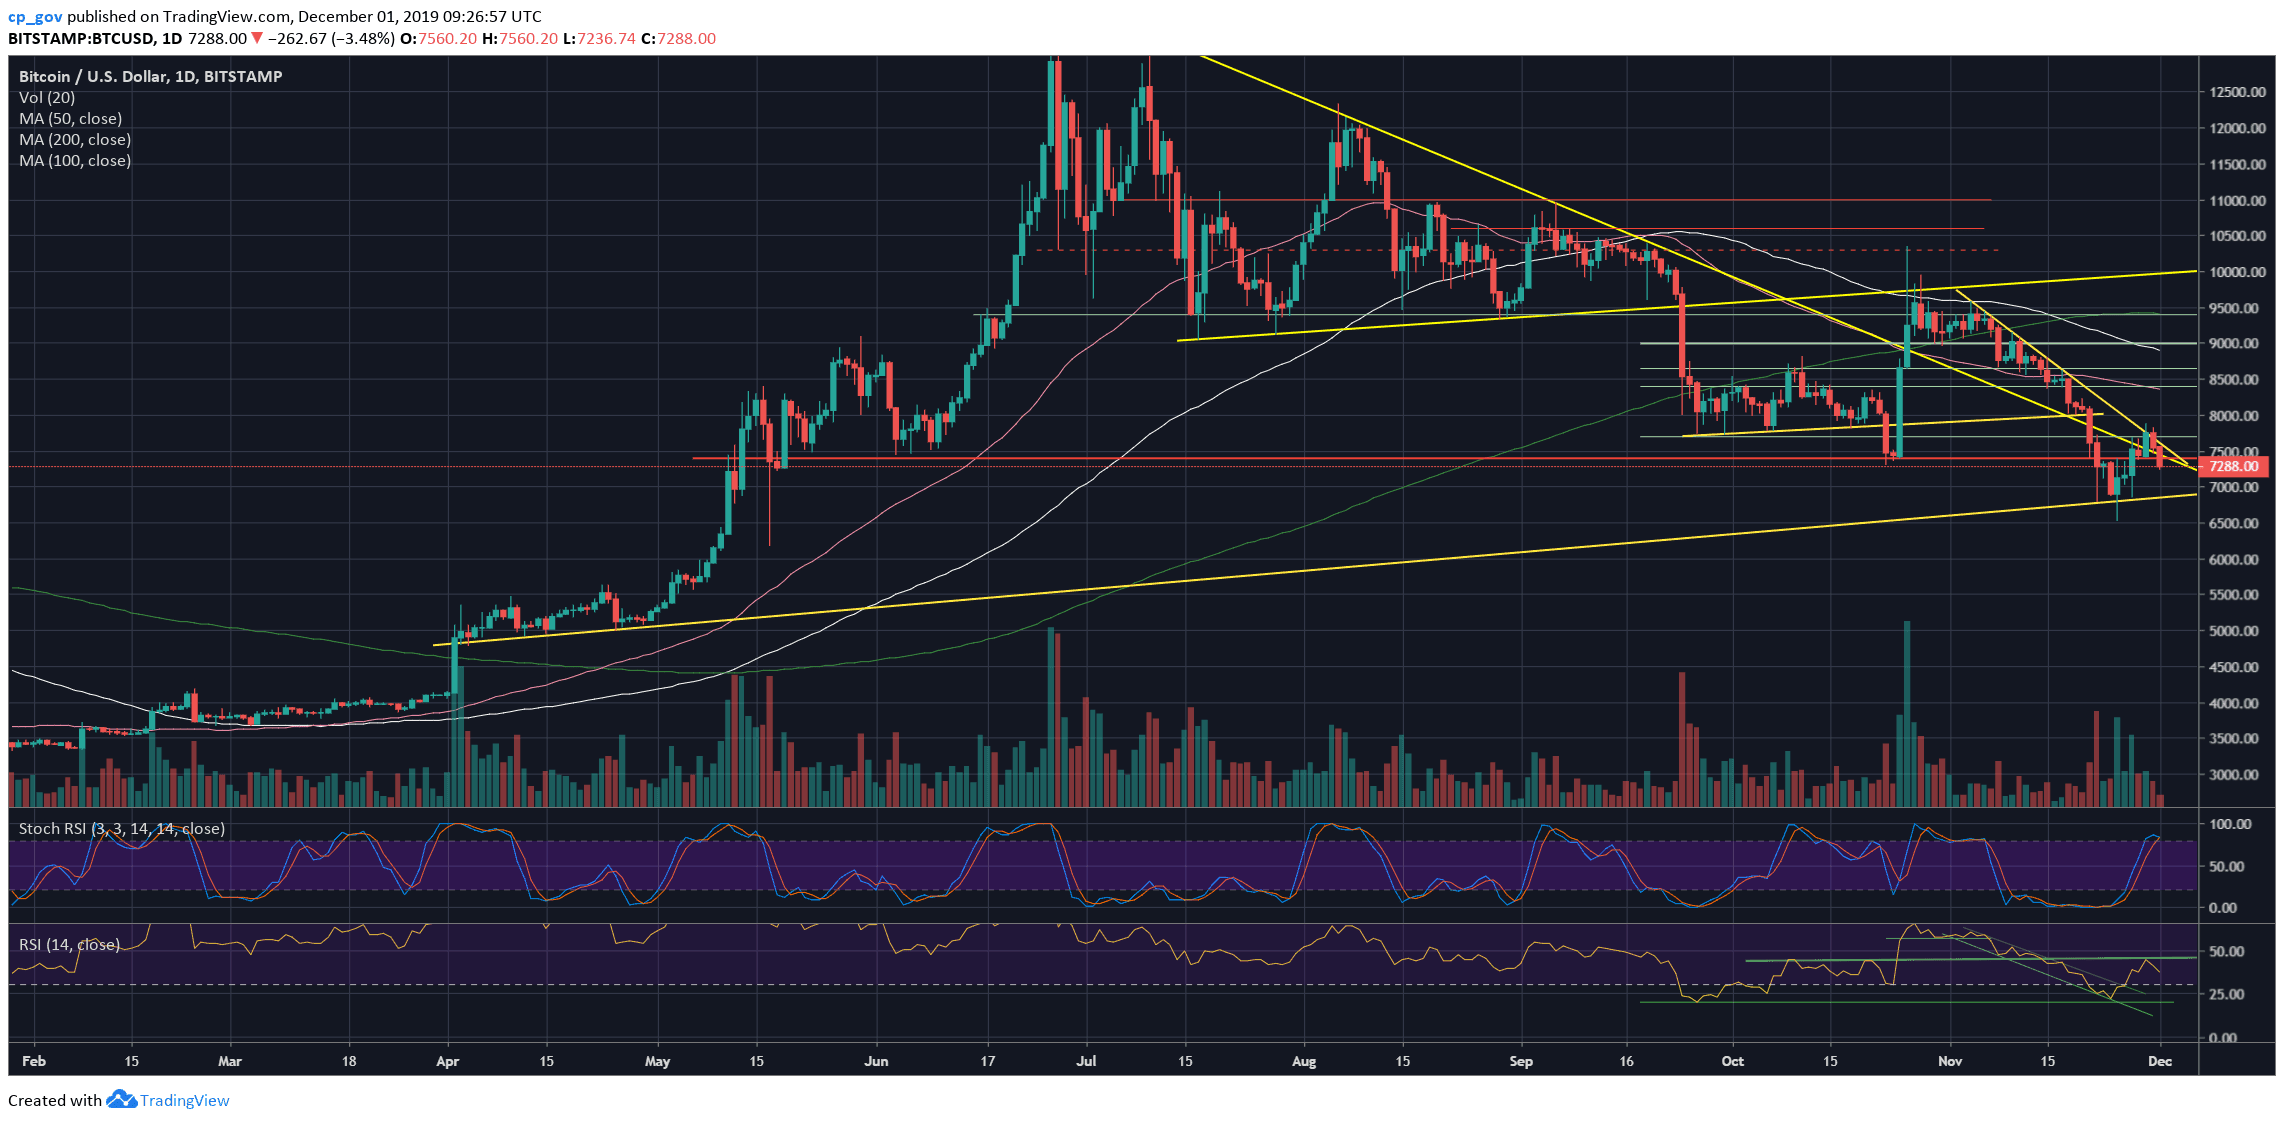
Then, Bitcoin encountered a long-term descending trend-line, shown both on the following 4-hour and the daily chart, and quickly turned bearish – breaking down a rising wedge pattern, which tends to be bearish when it gets broken down.
Once the $7400 was broken down yesterday, the $8300 target given by the inverse H&S became invalidated.
Bloody November
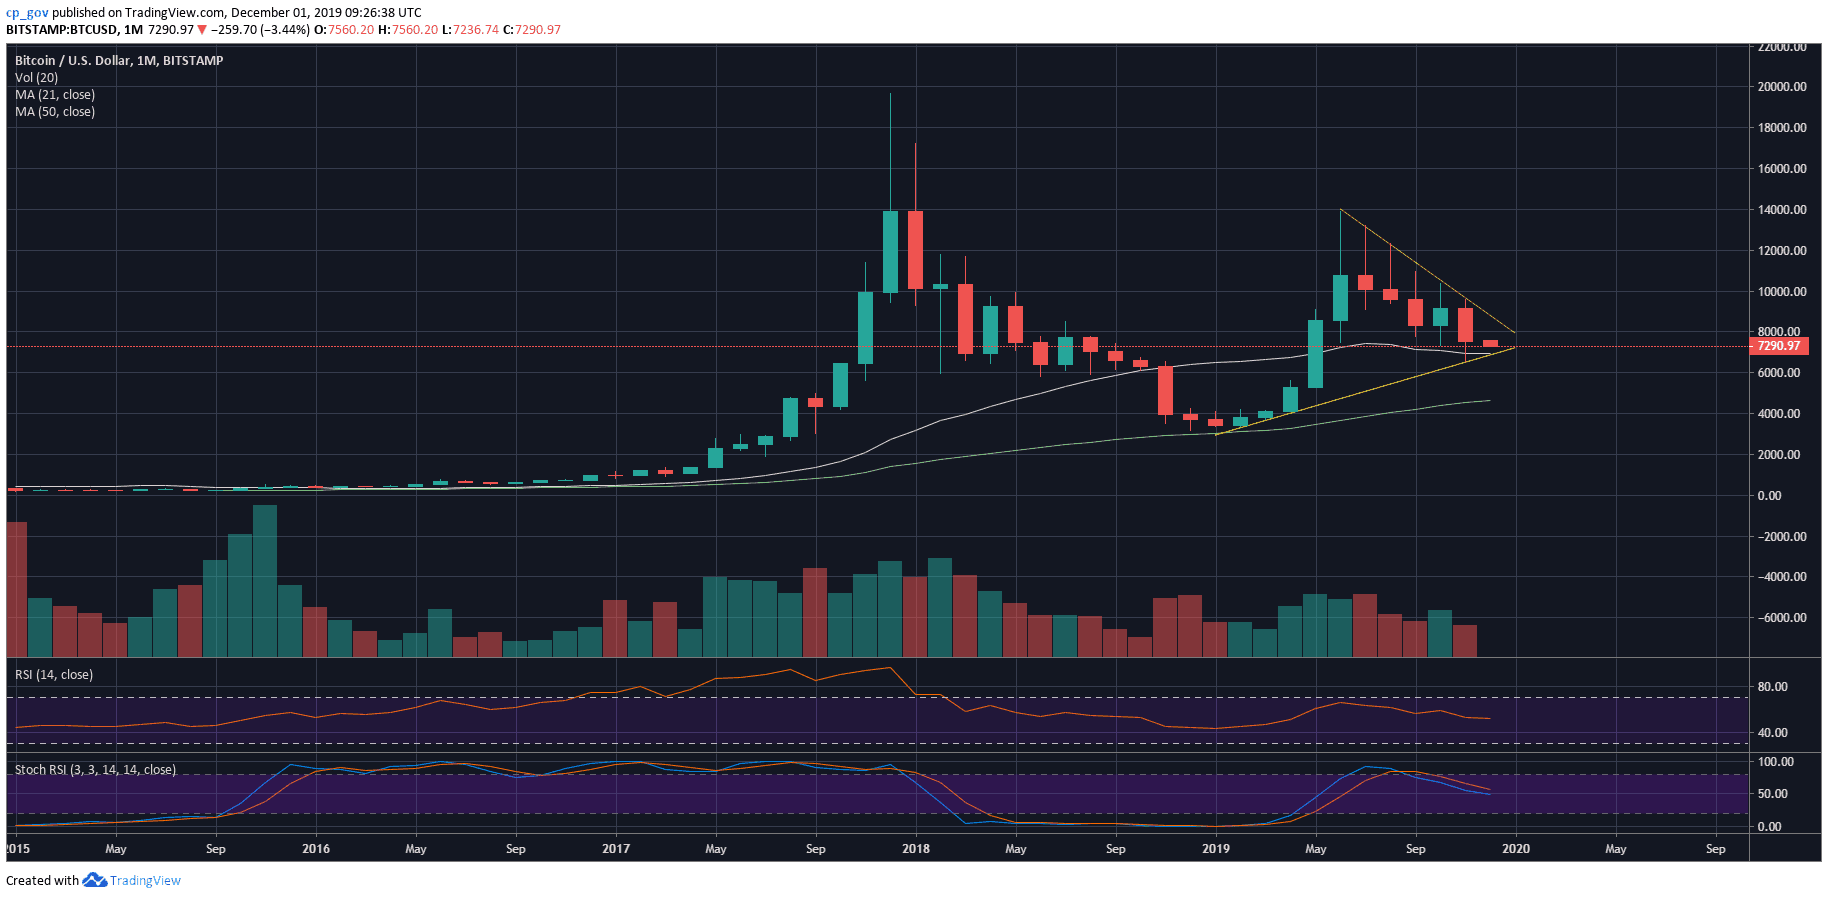
Not only that, by yesterday’s closing, was crucial since it was the monthly candle of November. Following a colossal push-down from the bears, November’s candle closed very bearishly. The last month opened-up around $9150 (Bitstamp) and closed at $7550. This is not including a self-off of $3000 throughout the month – November high was $9550, while the low reached $6500.
This is also not a promising sign for December, which is starting today.
Total Market Cap: $198.8 billion
Bitcoin Market Cap: $132.3 billion
BTC Dominance Index: 66.6%
*Data by CoinGecko
Key Levels to Watch
– Support/Resistance: As of now, Bitcoin’s price action had calmed down a bit, while there is a fight on the 4-hour’s MA-50 (the marked pink line on the 4-hour chart). The first level of support lies not far – around $7250. This is the current daily low as of writing these lines; however, it won’t be a surprise if Bitcoin was to break it down while you’re reading this.
The next level is the $7000 – $7100 support area. Further down lies $6800 and the November’s lowest price area around $6500.
Following this substantial two-day sell-off, we might see a positive correction. Possible levels are the $7400 support turned resistance level, while higher above lies $7600 and $7700. A short-term change of momentum, from bearish to bullish, will be above $8000 (as mentioned more than once in our recent analysis).
– The RSI Indicator: Failing to break above the 44-45 horizontal resistance, the RSI turned sharply down. A bearish sign is coming from the Stochastic RSI oscillator of the daily chart. The oscillator is above to make a cross-over at the overbought territory.
– Trading volume: Maybe because of Thanksgiving Holiday, together with the weekend, the trading volume is so-far not very significant. A good sign for the bulls?
BTC/USD BitStamp 4-Hour Chart
BTC/USD BitStamp 1-Day Chart
The post Bitcoin Price Analysis: November’s Candle Ended Very Bearish, What Does It Mean For December? appeared first on CryptoPotato.