Bitcoin Price Analysis Nov.18: A recess ahead of the storm?
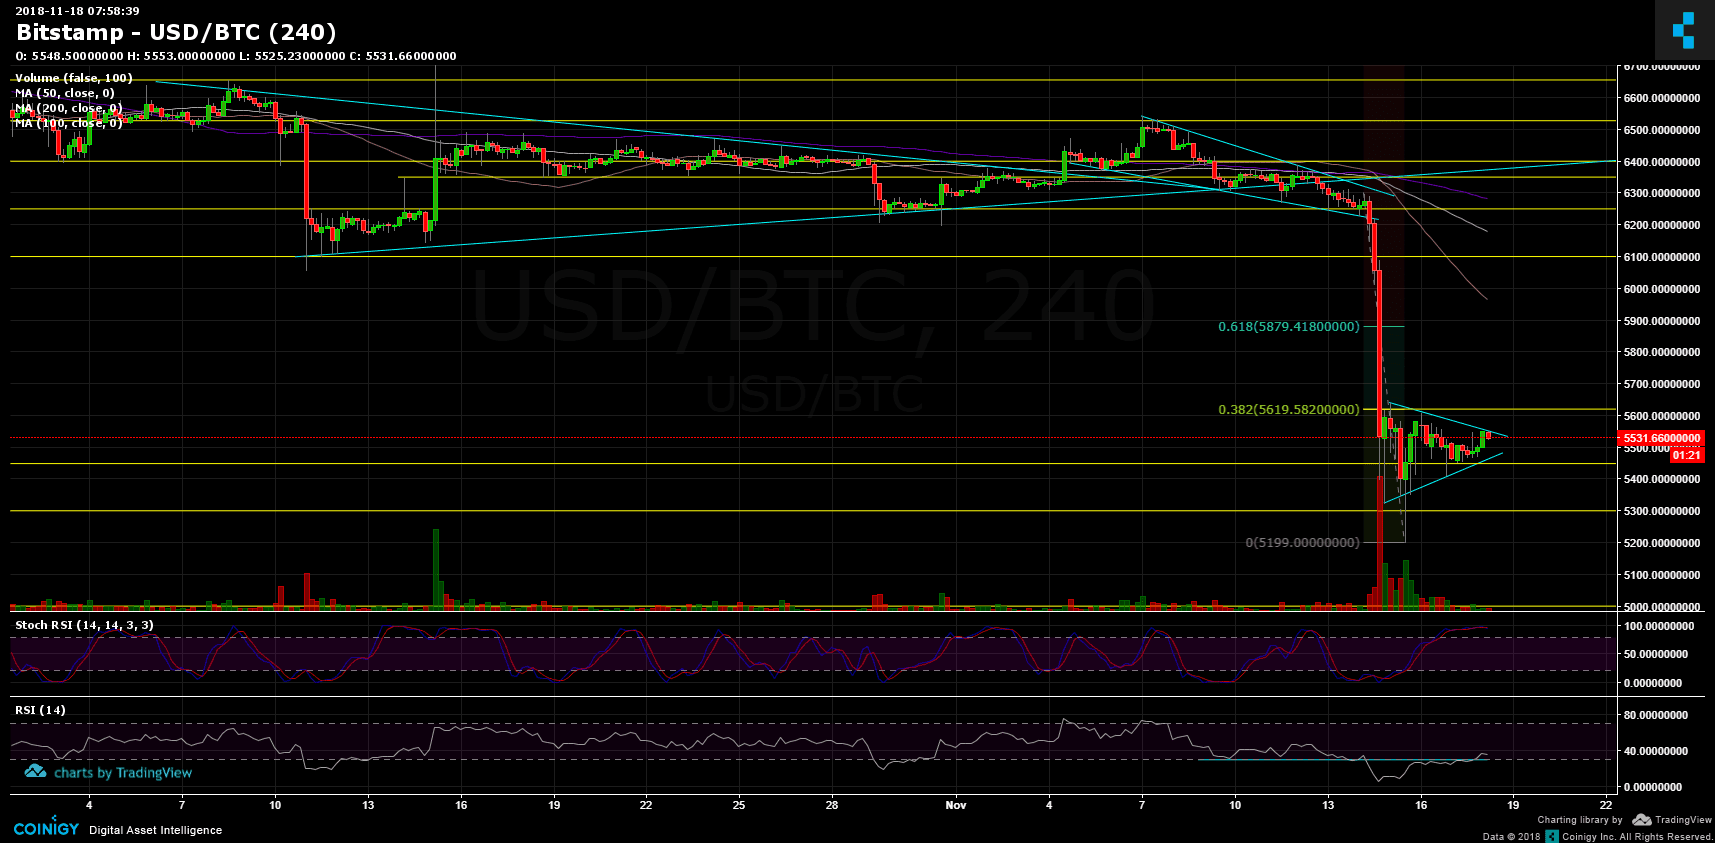
Over the past days since our latest price analysis and overview, we saw Bitcoin consolidating around the $5400 – $5500 range. As we can see, the current high since the severe drop lies at $5620 which is precisely where Fibonacci retracement level of %38.2. This is the first significant resistance area before a possible correction.
Along with our long-term prediction, in my opinion, the Bitcoin market had just started the last cycle which is known as capitulation. This doesn’t mean that the Bitcoin is bullish from now on, but after a long period of consolidation, the capitulation is the latest stage of the market cycle. Bitcoin will decide to turn bullish once most of the people declare on “its death”, and this we’ve not seen yet.
Looking at the 4-hour chart:
- Looking at the bigger time-frame, the Bitcoin daily chart: As mentioned before, the first target had been reached very quickly at $5300. The $5000 – $5300 might hold as possible support. Next possible support areas are $5000, $4500 and $3700. As we mentioned in the horror prediction – $2700 – $3000 is the possible bottom.
- Zoom in to the current’s situation: Bitcoin is forming a symmetric triangle which it’s getting tighter and expected to break. In my opinion, the higher the chance is a breakdown. The next support area lies around $5450 and $5300.
- Resistance levels lie at ~$5650 (Fibonacci retracement level %38.2), and $5700 – $5800 area which is now support turned tough resistance. The next significant resistance lies at another support turned tough resistance – $6K.
- The RSI indicator: After visiting yearly low areas, the RSI is back above the critical level of 30. This could be the first bullish sign, as long as it keeps its head above that level.
- Scholastic RSI oscillator is at its highest levels and about to cross there. The market is overbought, and this indicates on a possible correction down.
- Trading volume: after the massive volume following the days of the drop, the current weekend carries low volumes like before.
- BitFinex open short positions are at 22.3K. In their weekly high the number was 27.7K.
BTC/USD BitStamp 4-Hours chart
Cryptocurrency charts by TradingView. Technical analysis tools by Coinigy.
The post Bitcoin Price Analysis Nov.18: A recess ahead of the storm? appeared first on CryptoPotato.