Bitcoin Price Analysis March.26: BTC Gets Away From The $4000 Area Following Break-Down Of The Mid-term Ascending Trendline
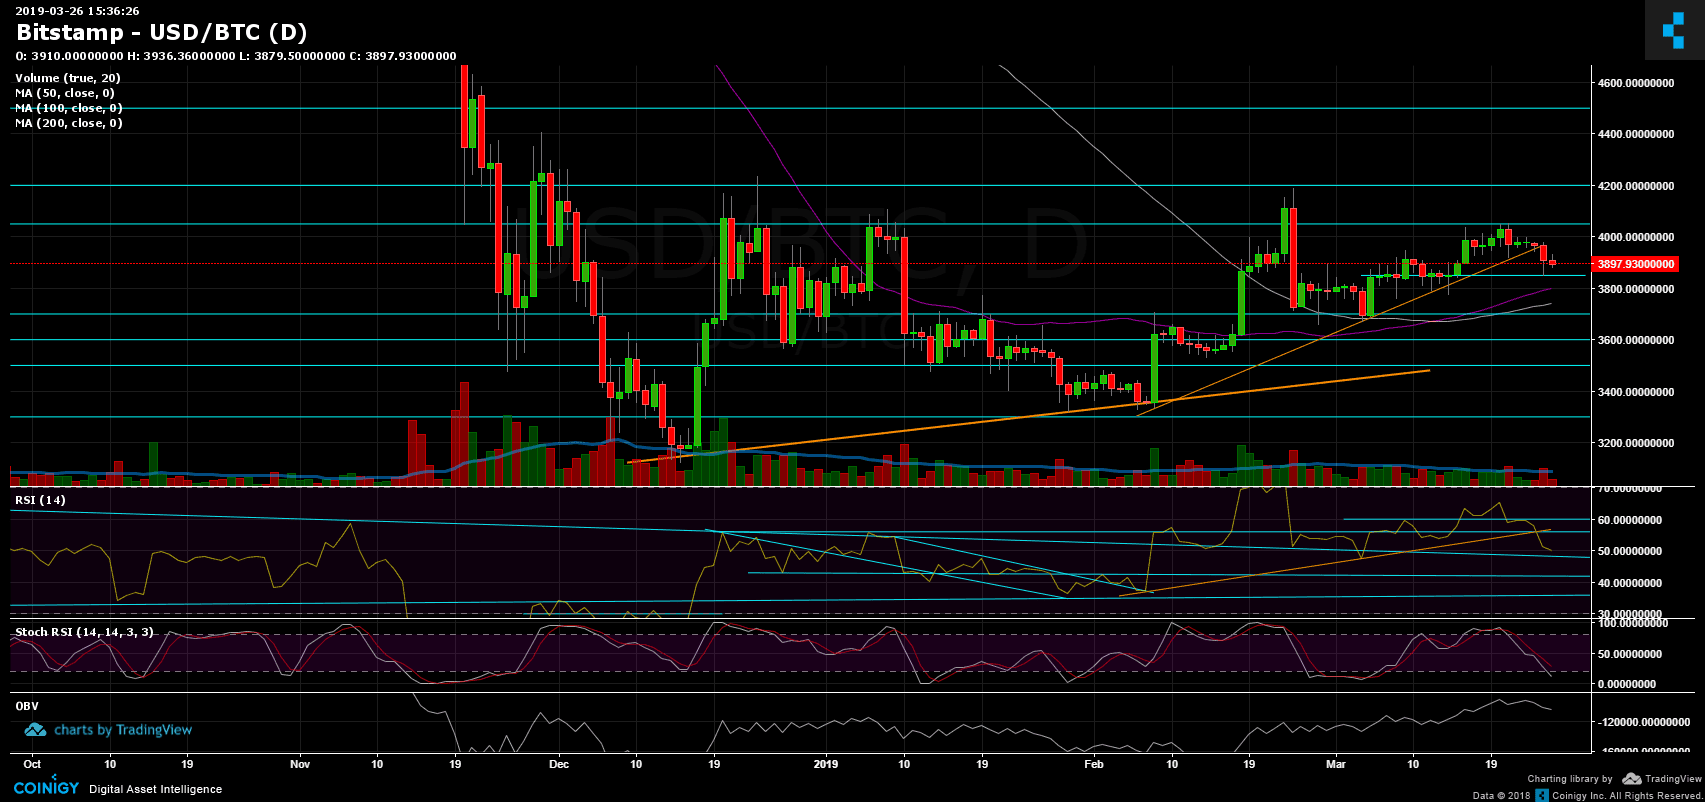
Continue from our previous BTC price analysis; we can see that the mid-term ascending line from the daily chart had been broken down.
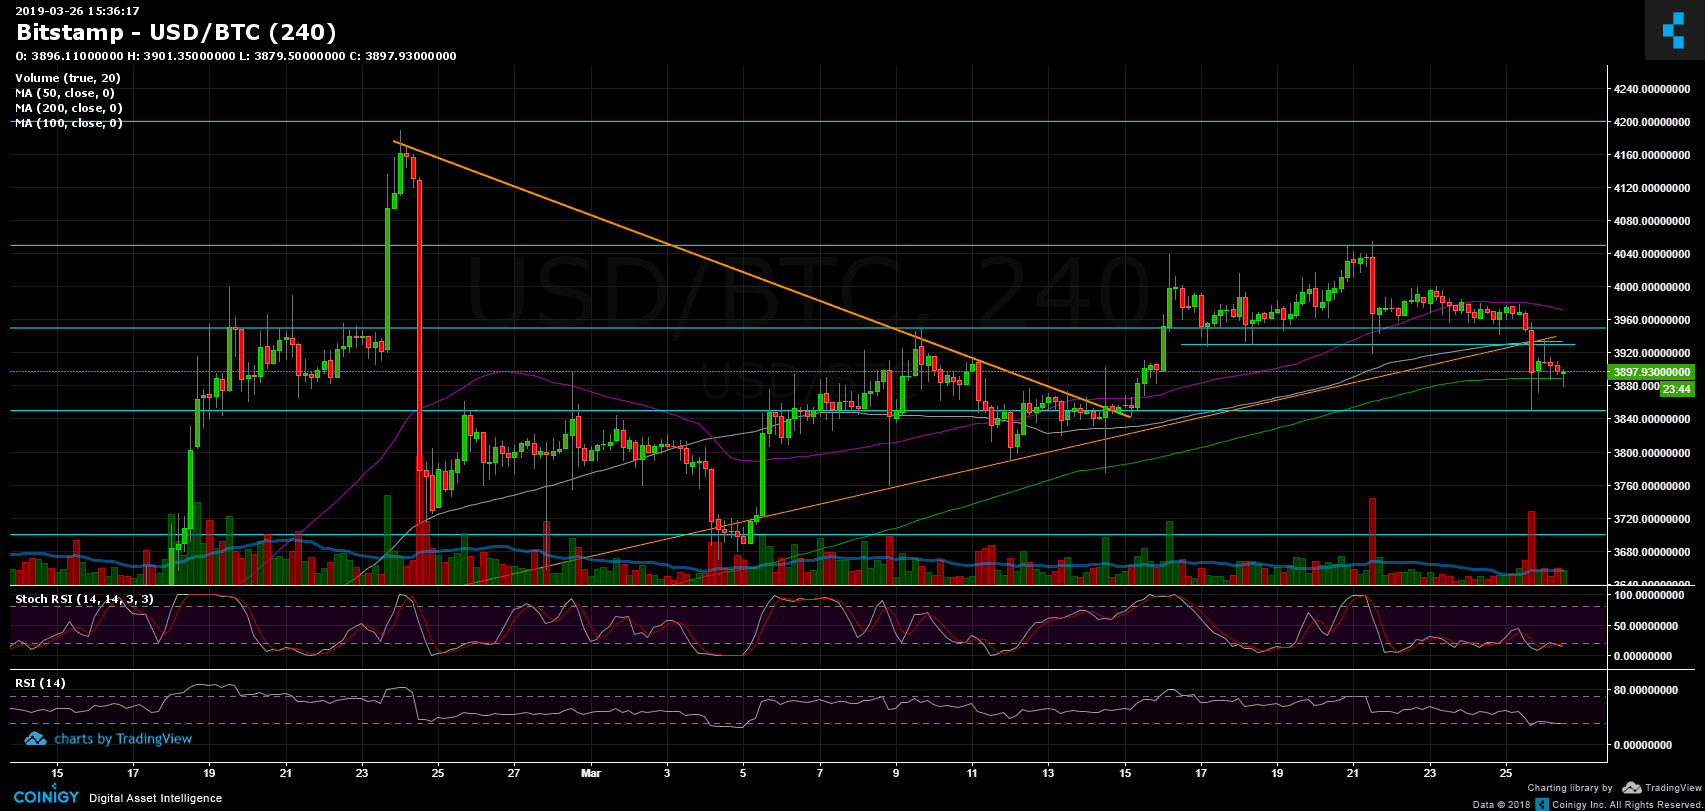
As expected in that case, Bitcoin quickly dropped down to the $3850 strong support level, and promptly regained position, retesting $3930 now from below (to confirm the level as resistance).
The situation is still fragile for Bitcoin: The big picture, in my opinion, is that we are in the lower part of the $3850 – $4050 trading range.
Total Market Cap: $137.1 Billion
Bitcoin Market Cap: $69.7 Billion
BTC Dominance: 50.9%
Looking at the 1-day & 4-hour charts
– Support/Resistance: As mentioned above, Bitcoin had broken down the 1-day ascending trend-line and now facing the $3850 from below while $3930 – $3950 is the upper boundary.
In the broader picture, further support is located at the daily chart’s 50-days moving average line (currently around $3800), before reaching the $3730 (MA-100) and the $3700 key support zone.
From above, the next resistance lies at the support turned resistance $3930 – $3950 area. Breaking above will likely send BTC to retest the $4K level, before reaching the significant resistance level of $4050.
– The daily chart’s RSI level: It can be clearly seen that Bitcoin broke down the significant RSI support including the 56 levels along with the ascending trend-line. The RSI is heading towards RSI level of 50 along with the long-term descending trend-line.
– The daily trading volume: the overall volume is not significant in comparison to 2019. Keep in mind that under those low-volume conditions, the market can be easily moved.
– BitFinex open short positions: The short positions have decreased to 20.2K BTC open positions.
BTC/USD BitStamp 4-Hour Chart
BTC/USD BitStamp 1-Day Chart
The post Bitcoin Price Analysis March.26: BTC Gets Away From The $4000 Area Following Break-Down Of The Mid-term Ascending Trendline appeared first on CryptoPotato.