Bitcoin Price Analysis Mar.13: BTC’s Consolidation Could End Soon. But, In Which Direction?
No major news out there: Bitcoin is still consolidating around the $3850 mark. Over the past three days, since our previous BTC analysis, the coin was trading around the range of the past 18 days – $3750 from below to $3950 from above.
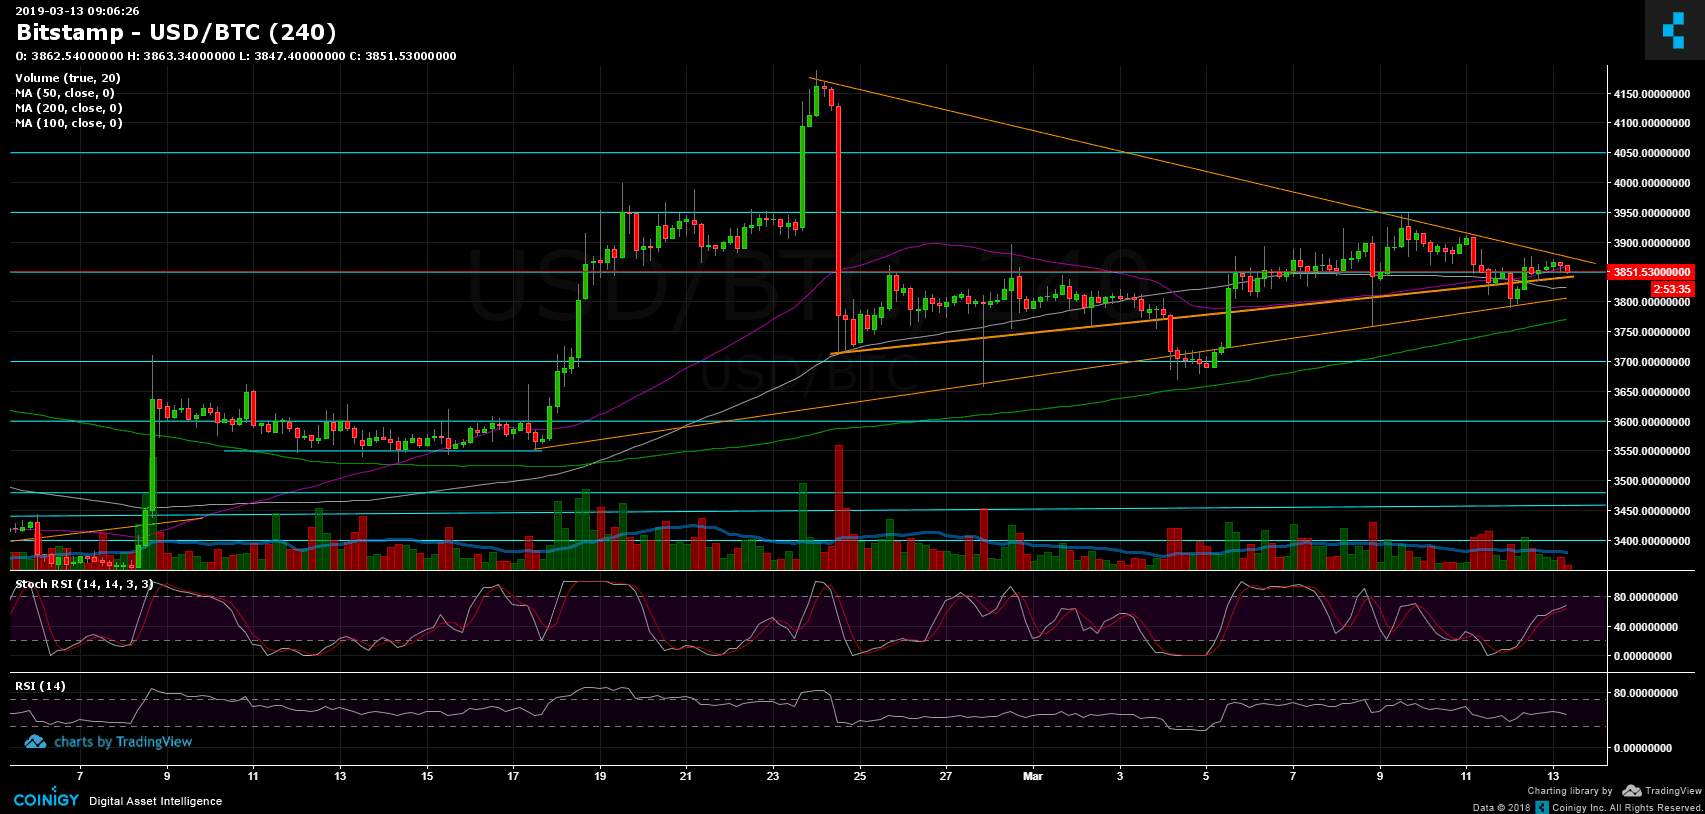
As could be seen on the 4-hour chart, Bitcoin is forming a symmetrical triangle. The apex is soon to be reached. Hence, we are expecting a move to either direction over the next day or two. As always in trading, both sides are considerable.
Following recent stablity in Bitcoin of the past two weeks, we can see many pumps like the good old days of an Altcoin Season: GRS with 200% overnight gains is only a pick out of many surging altcoins.
Total Market Cap: $134.2 Billion
BTC Dominance: 51.3%
Looking at the 1-day & 4-hour charts
– Support/Resistance: From above: besides the descending trendline forming the triangle, there is a strong resistance which lies at the $3950 – $4050 area. Breaking up will likely send Bitcoin to face the significant resistance of $4200.
From below, besides the triangle’s supporting ascending trend-line along with the $3850 level, the next support lies at $3800 and $3750 (along with the 4-hour 200 days moving average line). Below is the $3670 – the cross between the daily chart’s 50 and 100 days moving average lines. Below lies the $3600 support level.
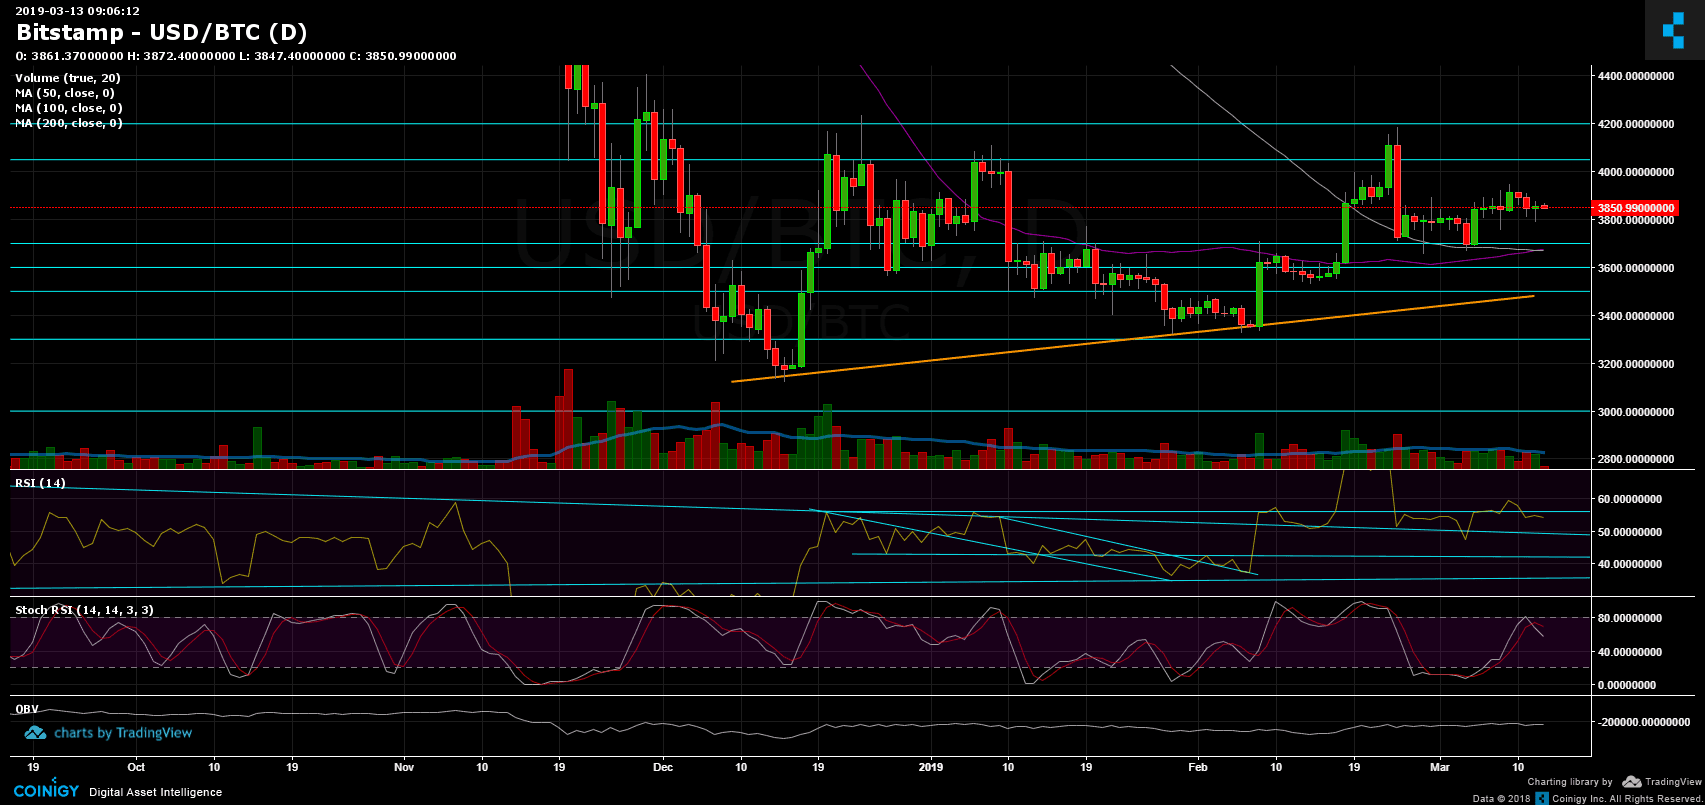
– A mini Golden Cross: Yet, it’s not a Golden Cross; However, the daily 50 days moving average (purple line) is just about to cross over above the 100 days moving average (white line). This could turn out to be a bullish sign for the mid-term. As mentioned, Golden Cross occurs when the 50 days MA crosses above the 200 days MA (the opposite from a Death Cross).
– The daily chart’s RSI level: Following a false breakout of the critical 56 RSI level, the indicator is trading below the mentioned 56 resistance mark. In order for BTC to turn bullish towards the $4K area, we would need to see a real breakout above that level.
– The daily trading volume: With not a lot of action, the volume is dull and not very significant.
– BitFinex open short positions: Not a major change since our previous update. The current number is 21K BTC of open short positions.
BTC/USD BitStamp 4-Hour chart
BTC/USD BitStamp 1-Day chart
The post Bitcoin Price Analysis Mar.13: BTC’s Consolidation Could End Soon. But, In Which Direction? appeared first on CryptoPotato.