Bitcoin Price Analysis July 30
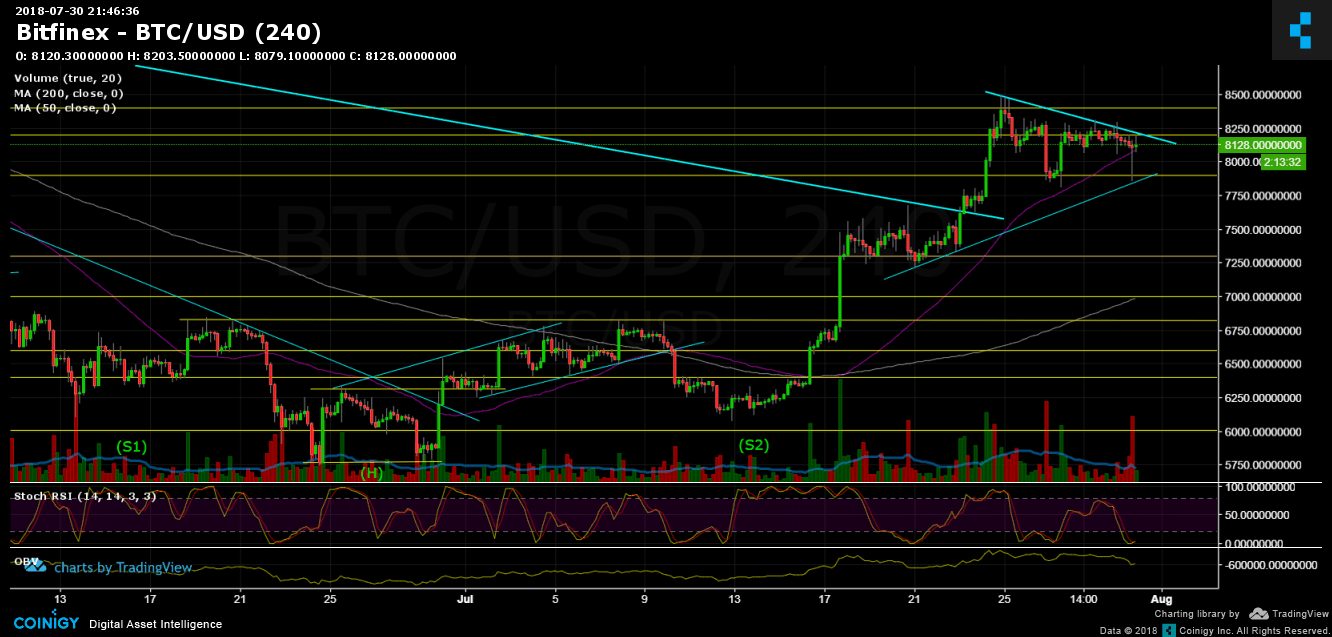
Over the past 7 days, Bitcoin has been trading between $7800 to $8400. The recent days the range is more $7800 to $8200. Seems like a triangle has been built in the BTC chart and is expecting to produce a fast move to either direction, this is expected to take place in the following 1-2 days.
RSI levels are very low, which is a positive sign (market is oversold). Also, the strong support at $7800 seems to hold. From the negative aspect, the last sell-off candle was followed by a massive amount of volume.
From the previous analysis, the range stays pretty much the same:
To sum up: Support levels lie at $7800, $7600 and $7300.
Resistance levels lie at $8200, $8400 and $9000 (which is our closest target to current bull run).
Bitcoin Prices: BTC/USD BitFinex 4 Hours chart
The post Bitcoin Price Analysis July 30 appeared first on CryptoPotato.