Bitcoin Price Analysis Jan.23: The Next Resistance – Descending Trend-line at $3600
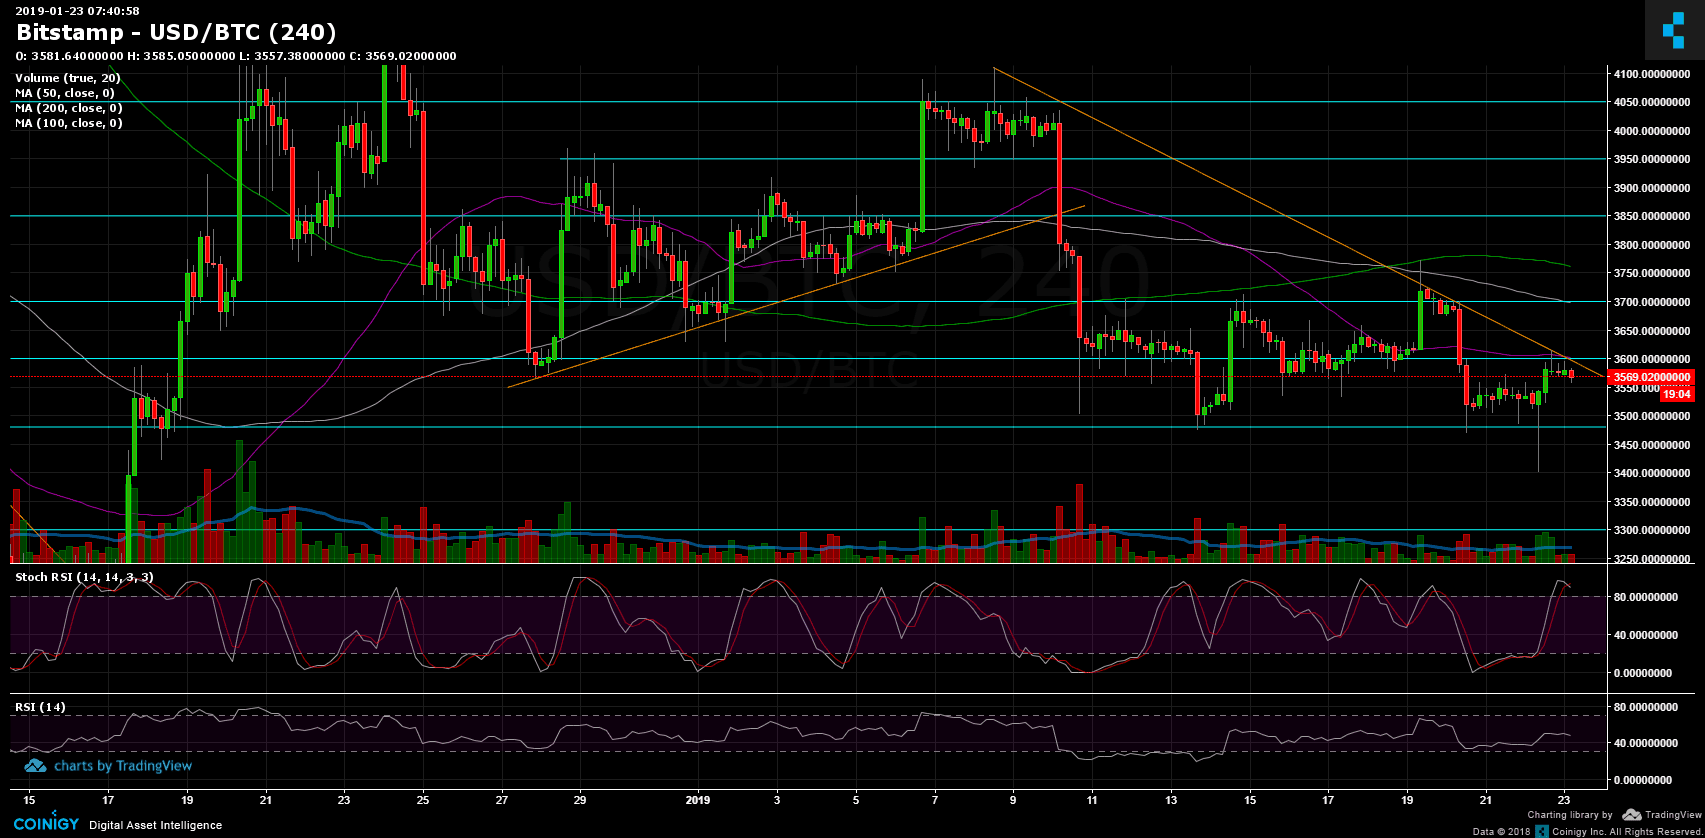
Over the past two days, BTC has tested once the dangerous zone of $3480 – $3500 and the second slide had produced a hammer type candle (on the 4-hour chart) with a low at $3400 as a long wick.
Hammer candles tend to be bullish reversal candles. This is how capitulation candles look like. However, this candle is on the 4-hour timeframe and not on the daily or weekly charts.
Following the above reversal candle, BTC had a mini-run to previous resistance at $3600, along with the 50 days moving average line (marked in purple on the 4-hour chart) and a descending trend-line (marked by an orange line).
From our previous analysis: “the 4-hour Stochastic RSI had just crossed over around the oversold area. This might lead to a slight correction, maybe to retest prior support that was broken. Possible correction levels could be the $3600.”
As of writing this, Bitcoin got rejected by the $3600, and some more indicators support the idea that a break-up of this level won’t be so easy.
Looking at the 1-day & 4-hour charts
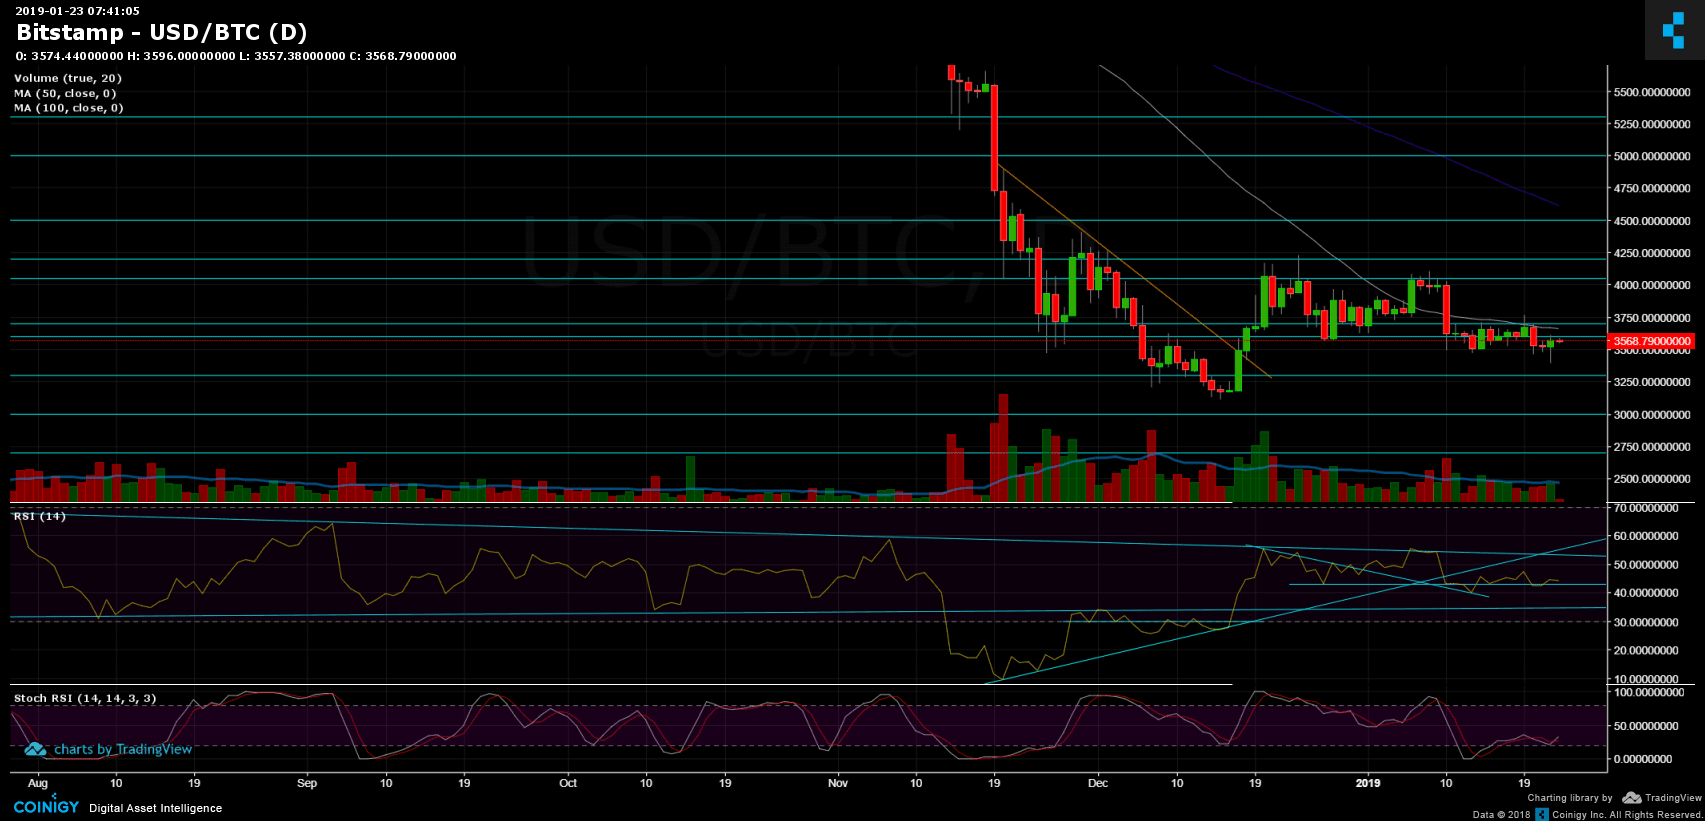
- Looking on the bullish side, the next significant resistance is $3600, as mentioned above. Above that level lies the daily chart’s 50 days moving average line (marked in white, currently around $3650), the $3700 and $3800 areas.
- From the bear side, the next major support area is the $3480 – $3500. Below this crucial level, lies the $3400 (weak support) and $3300 support level. This is before retesting the 2018 low at $3120.
- The 4-hour chart’s Stochastic RSI oscillator had just crossed over at the overbought zone. This can produce a correction down for the next day or two.
- The daily chart’s RSI: So far the crucial line at 43 holds up.
- The trading volume is still pretty dull; even though yesterday’s green candle was highest during the past week (on Bitstamp). But we still seek to see volume entering the market in either way.
- BitFinex’s open short positions had decreased to 22.4K BTC of open positions.
BTC/USD BitStamp 4-Hour chart
BTC/USD BitStamp 1-Day chart
The post Bitcoin Price Analysis Jan.23: The Next Resistance – Descending Trend-line at $3600 appeared first on CryptoPotato.