Bitcoin Price Analysis Jan.20: Some Weekend Price Action With Lack Of Volume
Since our last BTC analysis, which took place on Thursday, there hasn’t been much change in the big picture.
However, we saw some price action yesterday, with a beautiful green candle that reached a high of $3772 on Bitstamp (where lies the 4-hour 200 days moving average resistance line).
To all the bulls, it’s too early to celebrate: The volume was pretty weak, and since the sudden unexpected positive move, Bitcoin is slowly losing momentum and currently trading below the important daily chart’s 50 days moving average line (marked in white).
The daily candle structure left a long wick at its top; this is not how a breakout looks.
Looking at the 1-day & 4-hour charts
- The $3700 resistance, along with the daily MA-50, was broken up for a couple of hours, which turned out to be a false breakout (as of now). The $3700 is still there, while the next resistance levels are at $3800 (4-hour’s MA-200) and $3850.
- From below Bitcoin is getting supported by an ascending trend-line around $3650 (marked orange on the 4-hour chart), the next levels are $3600 (along with the 4-hour chart’s MA-50 – the purple line) and a strong $3480 – $3500 last week’s low support area. The next support levels lie at $3400 and beyond – $3300.
- The Daily Chart: The RSI indicator is gaining strength and now encounters the 48 resistance level.
- Despite the decent move we saw yesterday, the trading volume is very low. We can see on Bitstamp that the trading volume candles decrease from day to day along with Bitcoin slowly going up. This could be a bearish sign. However, today is also weekend, so it’s better to have some patience to see what’s developing.
- BitFinex’s open short positions climbed to their 5-day high, around 23.4K BTC. Yesterday’s mini-rally didn’t succeed in closing down some shorts.
BTC/USD BitStamp 4-Hour chart
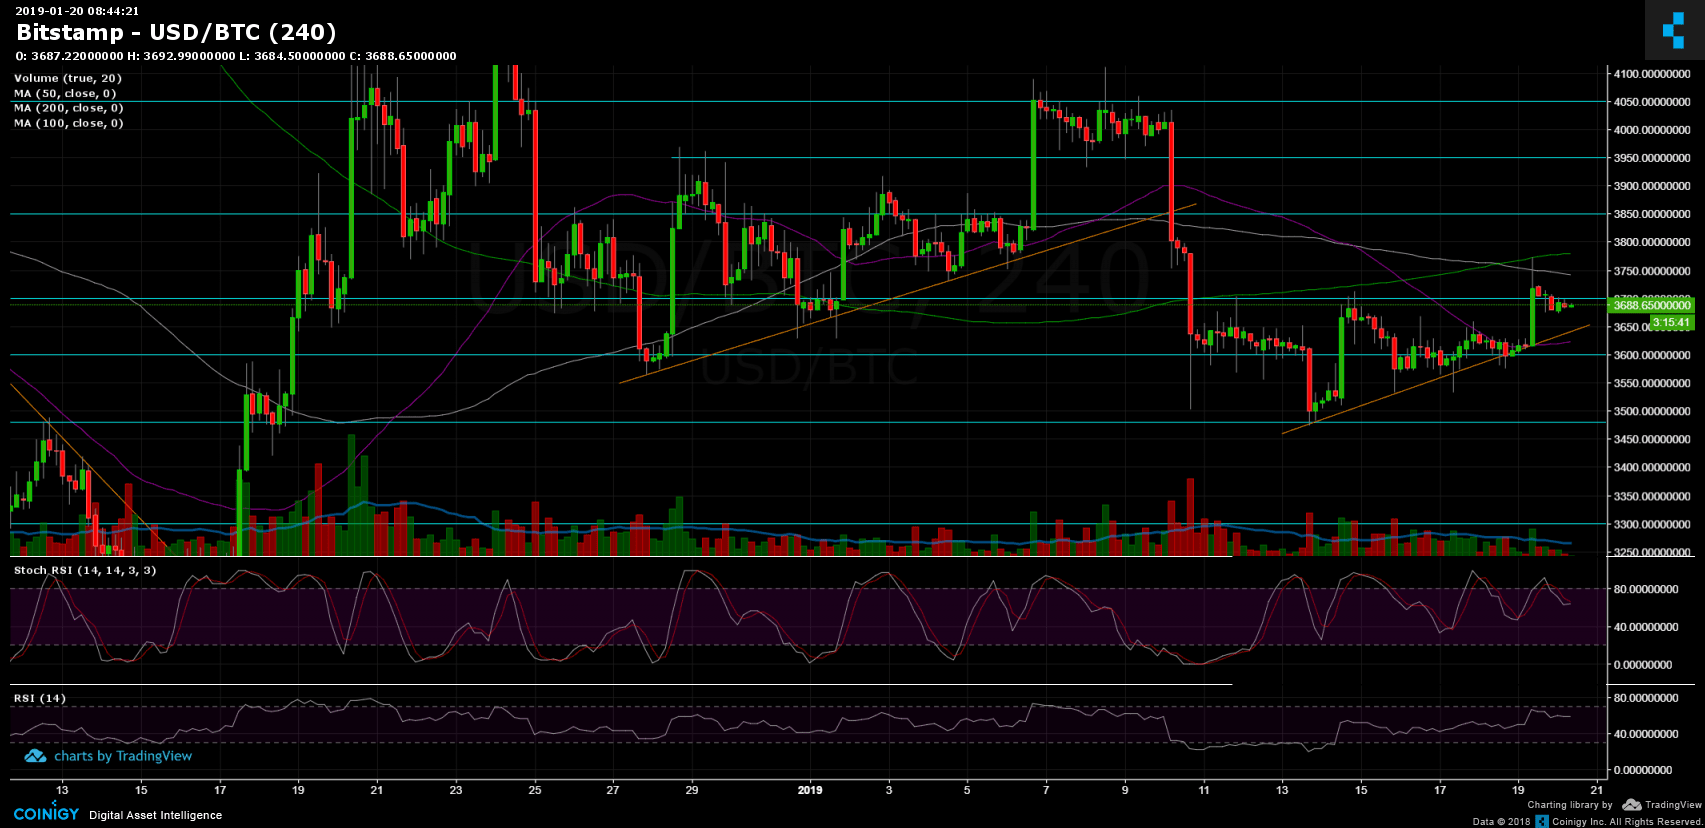
BTC/USD BitStamp 1-Day chart

The post Bitcoin Price Analysis Jan.20: Some Weekend Price Action With Lack Of Volume appeared first on CryptoPotato.