Bitcoin Price Analysis Jan.11: BTC Tests a Critical Support Area
Following the negative sentiment which started yesterday, we’ve seen Bitcoin continue down to re-test the critical support at $3600. As we mentioned, the sharp decline could be anticipated, by looking at the number of shorts vs longs. What led to a long-squeeze.
It’s incredible how gains of two weeks were gone in just 10 hours, as said before: Bulls Walk Up the Stairs-Bears Jump Out the Window.
So far it seems that a correction is needed, and there is a large demand around this level. However, the situation is very fragile.
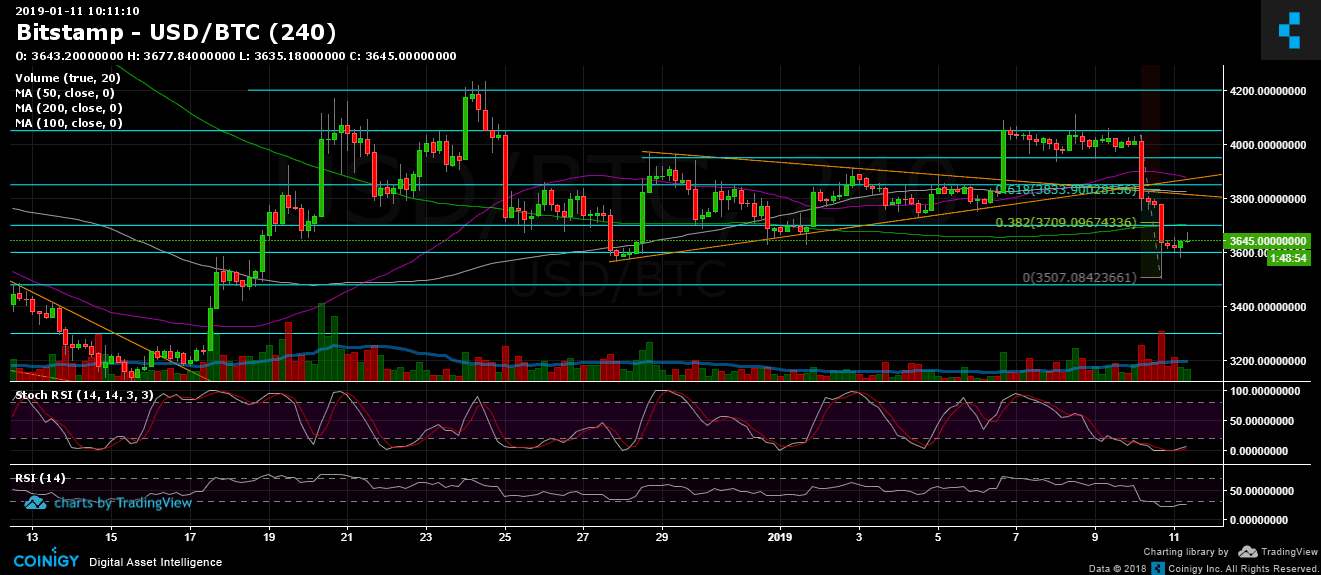
Looking at the 1-day & 4-hour charts
- The next support levels are at $3600 (current area), and $3480 – $3500. The last is a crucial support zone. Breaking it down could lead Bitcoin to discover new lows hadn’t seen yet in 2018. Breaking down the $3500 could lead Bitcon quickly to re-test $3300 support.
- The 4-hour Stochastic RSI oscillator had crossed over around the oversold area. We can say, with caution, that a correction could take place. Possible targets could be the significant support turned resistance $3700 (along with 200 days moving average line and Fibb retracement level 38.2% of the last decline), or even $3800.
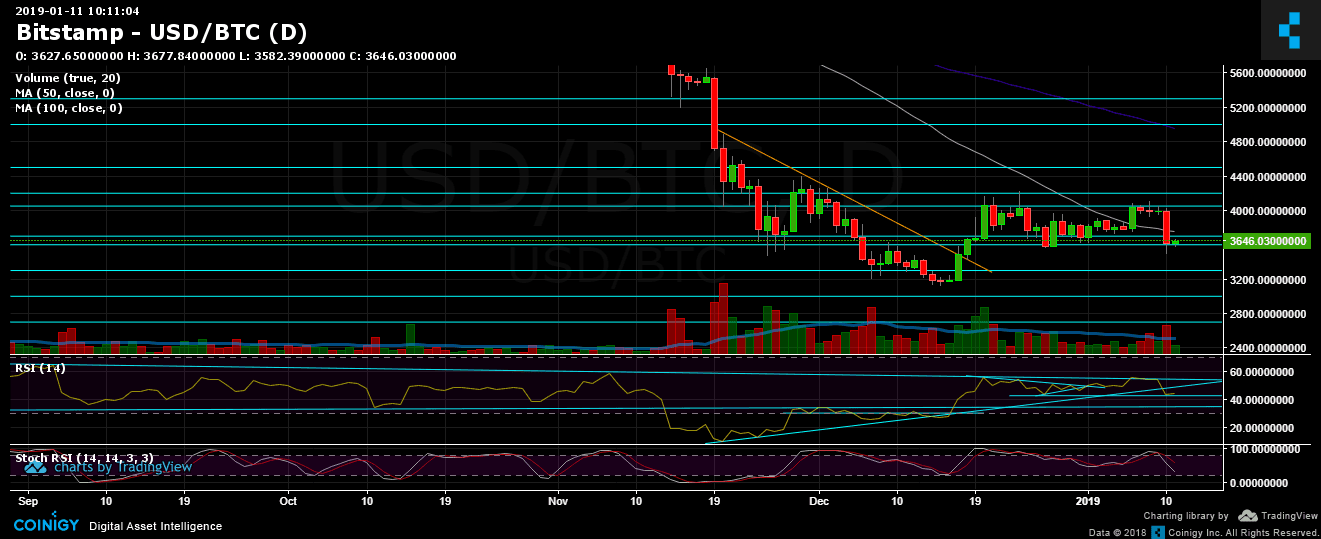
- The Daily Chart: The RSI level had broken down the long-term descending trend-line, and as of now it seems that support around RSI level 42 holds.
- Trading volume: Yesterday’s daily volume is the highest level since December 21. That teaches us that the sellers are still around and still active.
- As expected, BitFinex’s open short positions increased drastically to 24.5K.
BTC/USD BitStamp 4-Hour chart
BTC/USD BitStamp 1-Day chart
The post Bitcoin Price Analysis Jan.11: BTC Tests a Critical Support Area appeared first on CryptoPotato.