Bitcoin Price Analysis Jan.1: New Year, New Hopes for BTC
Since our previous BTC price analysis from two days ago, Bitcoin had created two lower highs around the support-turned resistance levels at $3850 and $3800.
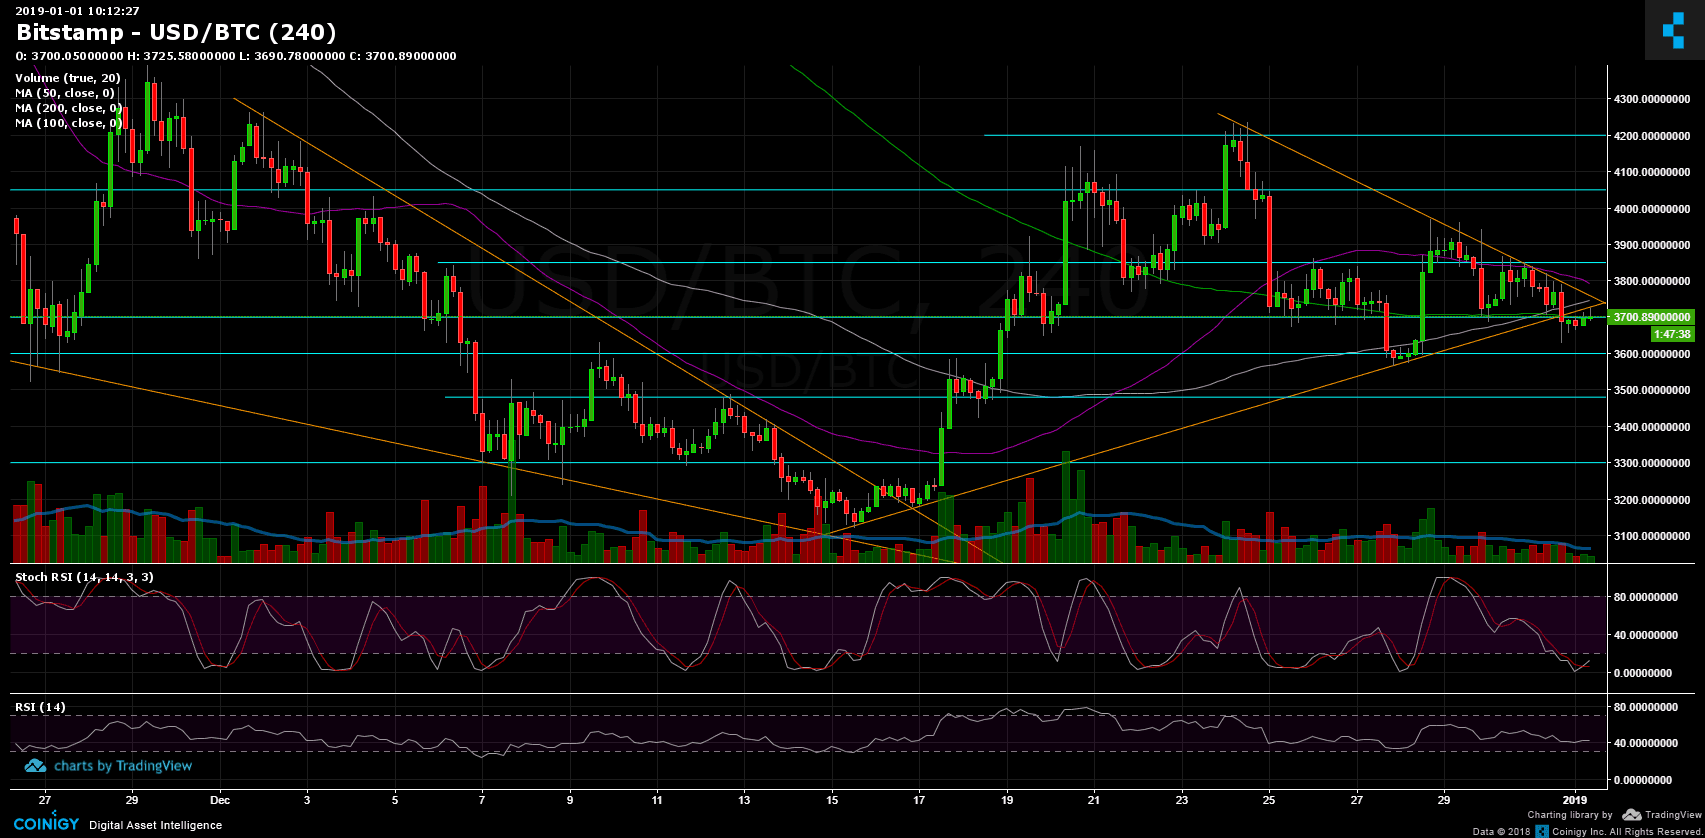
From there, Bitcoin had a significant drop to a new 2-day low at $3630, breaking down the mid-term ascending line (marked in orange on the 4-hour chart). As can be seen on the chart, Bitcoin broke down a triangle formation, very close to its apex.
Over the past hours, Bitcoin is slowly recovering and currently re-testing the ascending trend-line from below, now as a resistance, along with the $3700 support-turned resistance level.
As the new year of 2019 starts, Bitcoin hopes for a better one than the bearish 2018 which was a terrible year for the crypto coin.
Looking at the 1-day & 4-hour charts
- As mentioned above, Bitcoin is now facing a tough resistance area including the 200 days moving average line (marked in light green), along with ascending trend-line and the $3700 resistance level.
- If Bitcoin succeeds to break up, then the next resistance would be the descending trend-line around $3750, before facing $3800 resistance, along with 50 days moving average line (marked in purple). Behind lies the $3850 and $3950 resistance levels.
- From the bear side, support in range lies at the prior low $3630, $3600, $3480 and $3400.
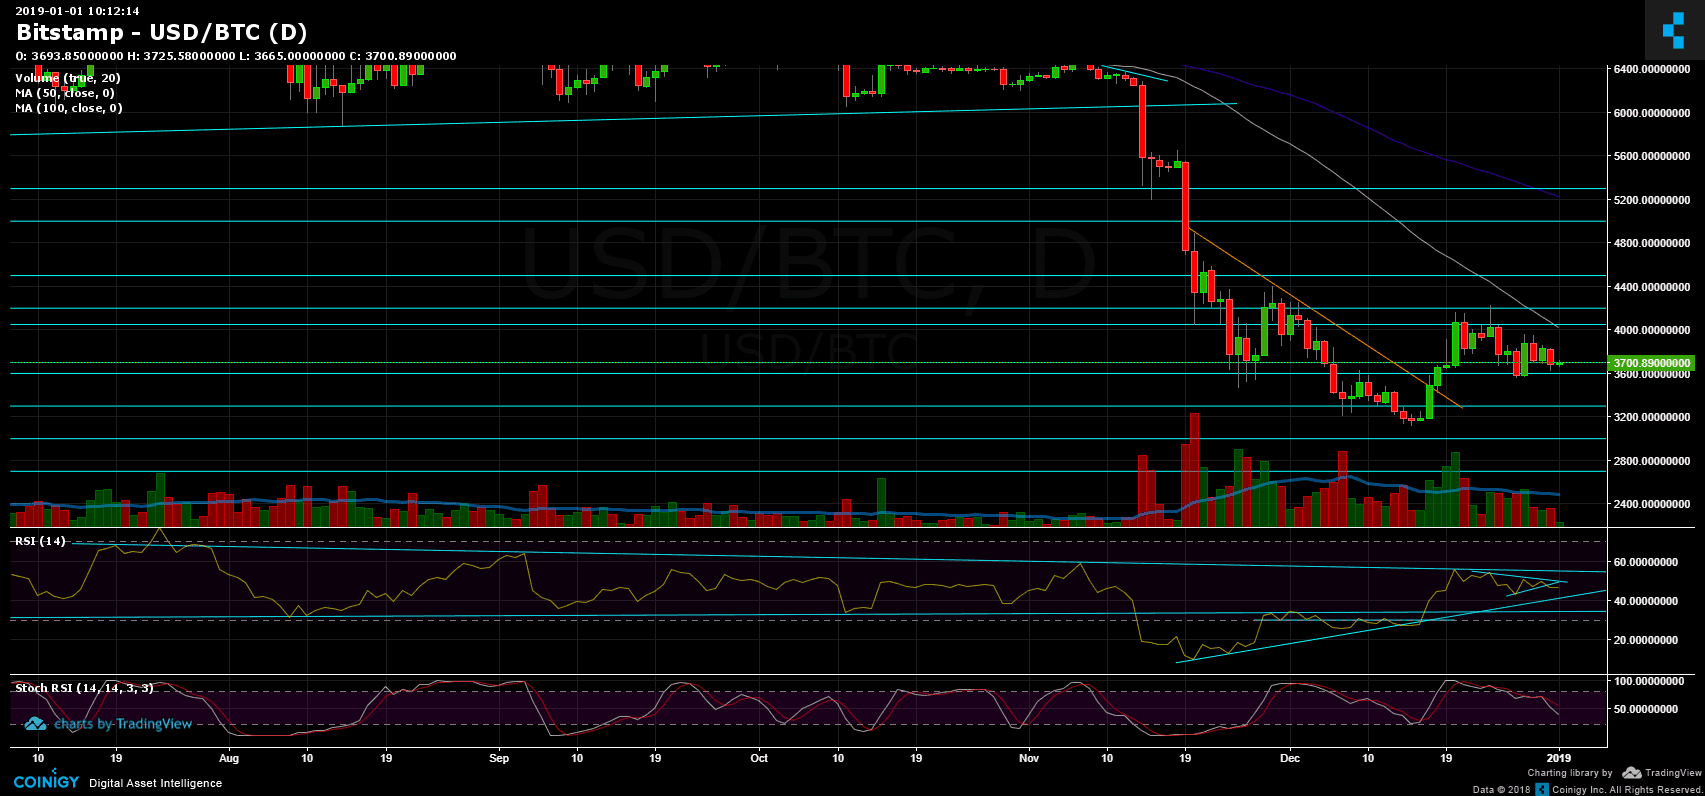
- The mid-term inverse head and shoulders bullish pattern is still alive for the next days. However, it will become invalid in case Bitcoin breaks below ~$3500. The formation will play out if Bitcoin breaks up the neckline around $4150 in the next days.
- Stochastic RSI oscillator (4-hour) has crossed over at the oversold area. For the next hours, Bitcoin might visit higher resistance levels.
- The trading volume is still very low. This is likely because of the new year holidays.
- There was not much change in BitFinex’s open short positions, which had decreased to 32K BTC.
BTC/USD BitStamp 4-Hour chart
BTC/USD BitStamp 1-Day chart
The post Bitcoin Price Analysis Jan.1: New Year, New Hopes for BTC appeared first on CryptoPotato.