Bitcoin Price Analysis: Is BTC Ready to Break its All-Time High?
Bitcoin remains technically bullish, with strong buyer interest evident after the recent liquidity sweep around the $100K mark.
A breakout above $111K would likely trigger aggressive upside continuation. However, short-term volatility and potential resistance should be expected as the price navigates this critical zone.
Technical Analysis
By ShayanMarkets
The Daily Chart
BTC has recently swept a critical liquidity zone just around the $100K mark, triggering a strong, impulsive rally that reflects significant demand entering the market. This surge has propelled the price to its all-time high of $111K, signaling renewed bullish momentum.
A key area of buy-side liquidity lies just above the $111K ATH, making it an attractive target for institutional and “smart money” participants. If bullish momentum holds and buyers manage to breach this level, a sharp move higher, potentially driven by a short squeeze, could follow.
However, this zone also overlaps with a likely area of profit-taking and increased supply, which may temporarily slow or cap upward momentum. While a bullish breakout appears imminent, a minor pullback or short-term correction cannot be ruled out. At present, BTC remains range-bound between $100K and $111K, with the breakout direction likely determining the next macro trend.
The 4-Hour Chart
On the lower timeframe, Bitcoin has seen a strong influx of buyers around the $100K level, leading to a breakout above a recently formed bullish flag pattern. This breakout confirms the continuation of the upward trend.
Currently, the price action is approaching a 4-hour Order Block, a key area where supply is expected to re-enter the market. If bulls can reclaim this zone and sustain momentum, BTC could make a swift move toward price discovery and a new ATH.
That said, a short-term rejection or a pullback to retest the breakout level is still a viable scenario before the next leg up. For now, Bitcoin is consolidating within a tighter $105K–$111K range on the 4-hour chart. This consolidation phase could serve as a launchpad for the next impulsive rally.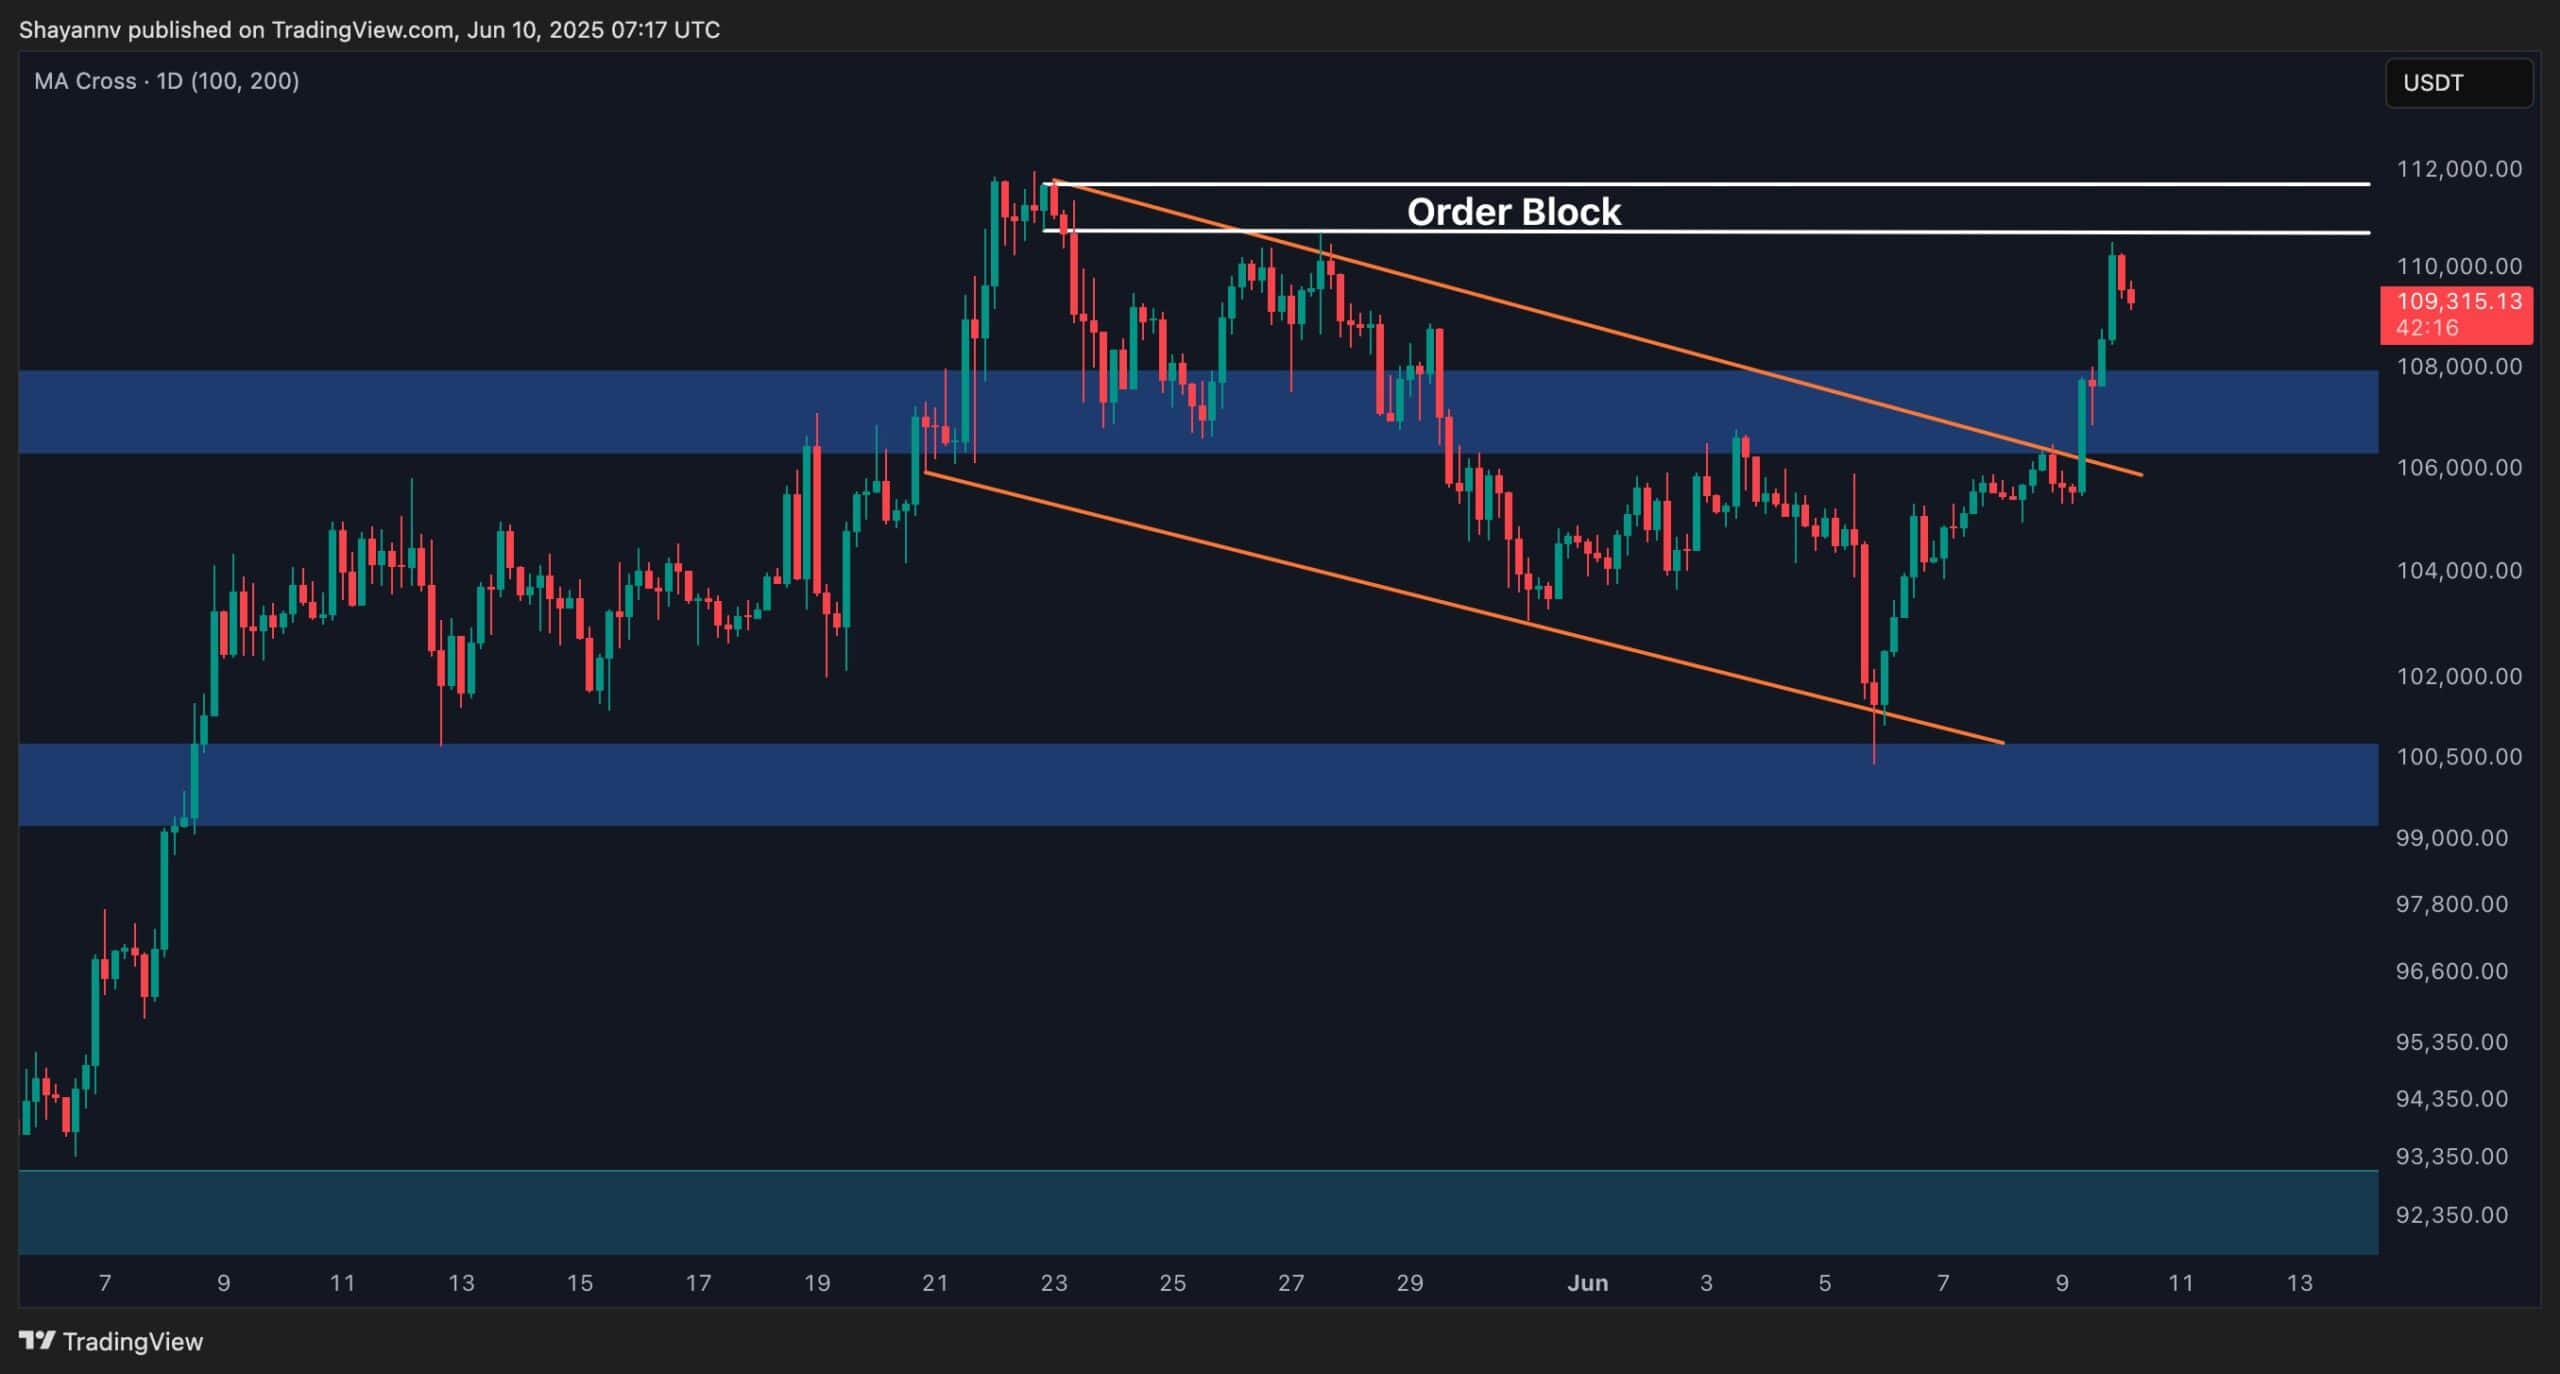
On-chain Analysis
By ShayanMarkets
As Bitcoin hovers just below its all-time high of $111K, a closer look at futures market data, particularly the BTC/USDT liquidation heatmap on Binance, offers critical insights into potential price movements.
It reveals two major liquidity clusters: one positioned above the $111K level and another just below $100K. These zones are situated near the current price and represent prime areas where smart money may aim to trigger liquidations of overleveraged retail positions. A decisive move beyond either threshold could ignite a liquidation cascade, accelerating price action in that direction.
Given the prevailing bullish sentiment and broader market structure, a breakout above the $111K resistance appears increasingly likely in the mid-term. Such a move would not only confirm market strength but could also fuel momentum toward a fresh all-time high.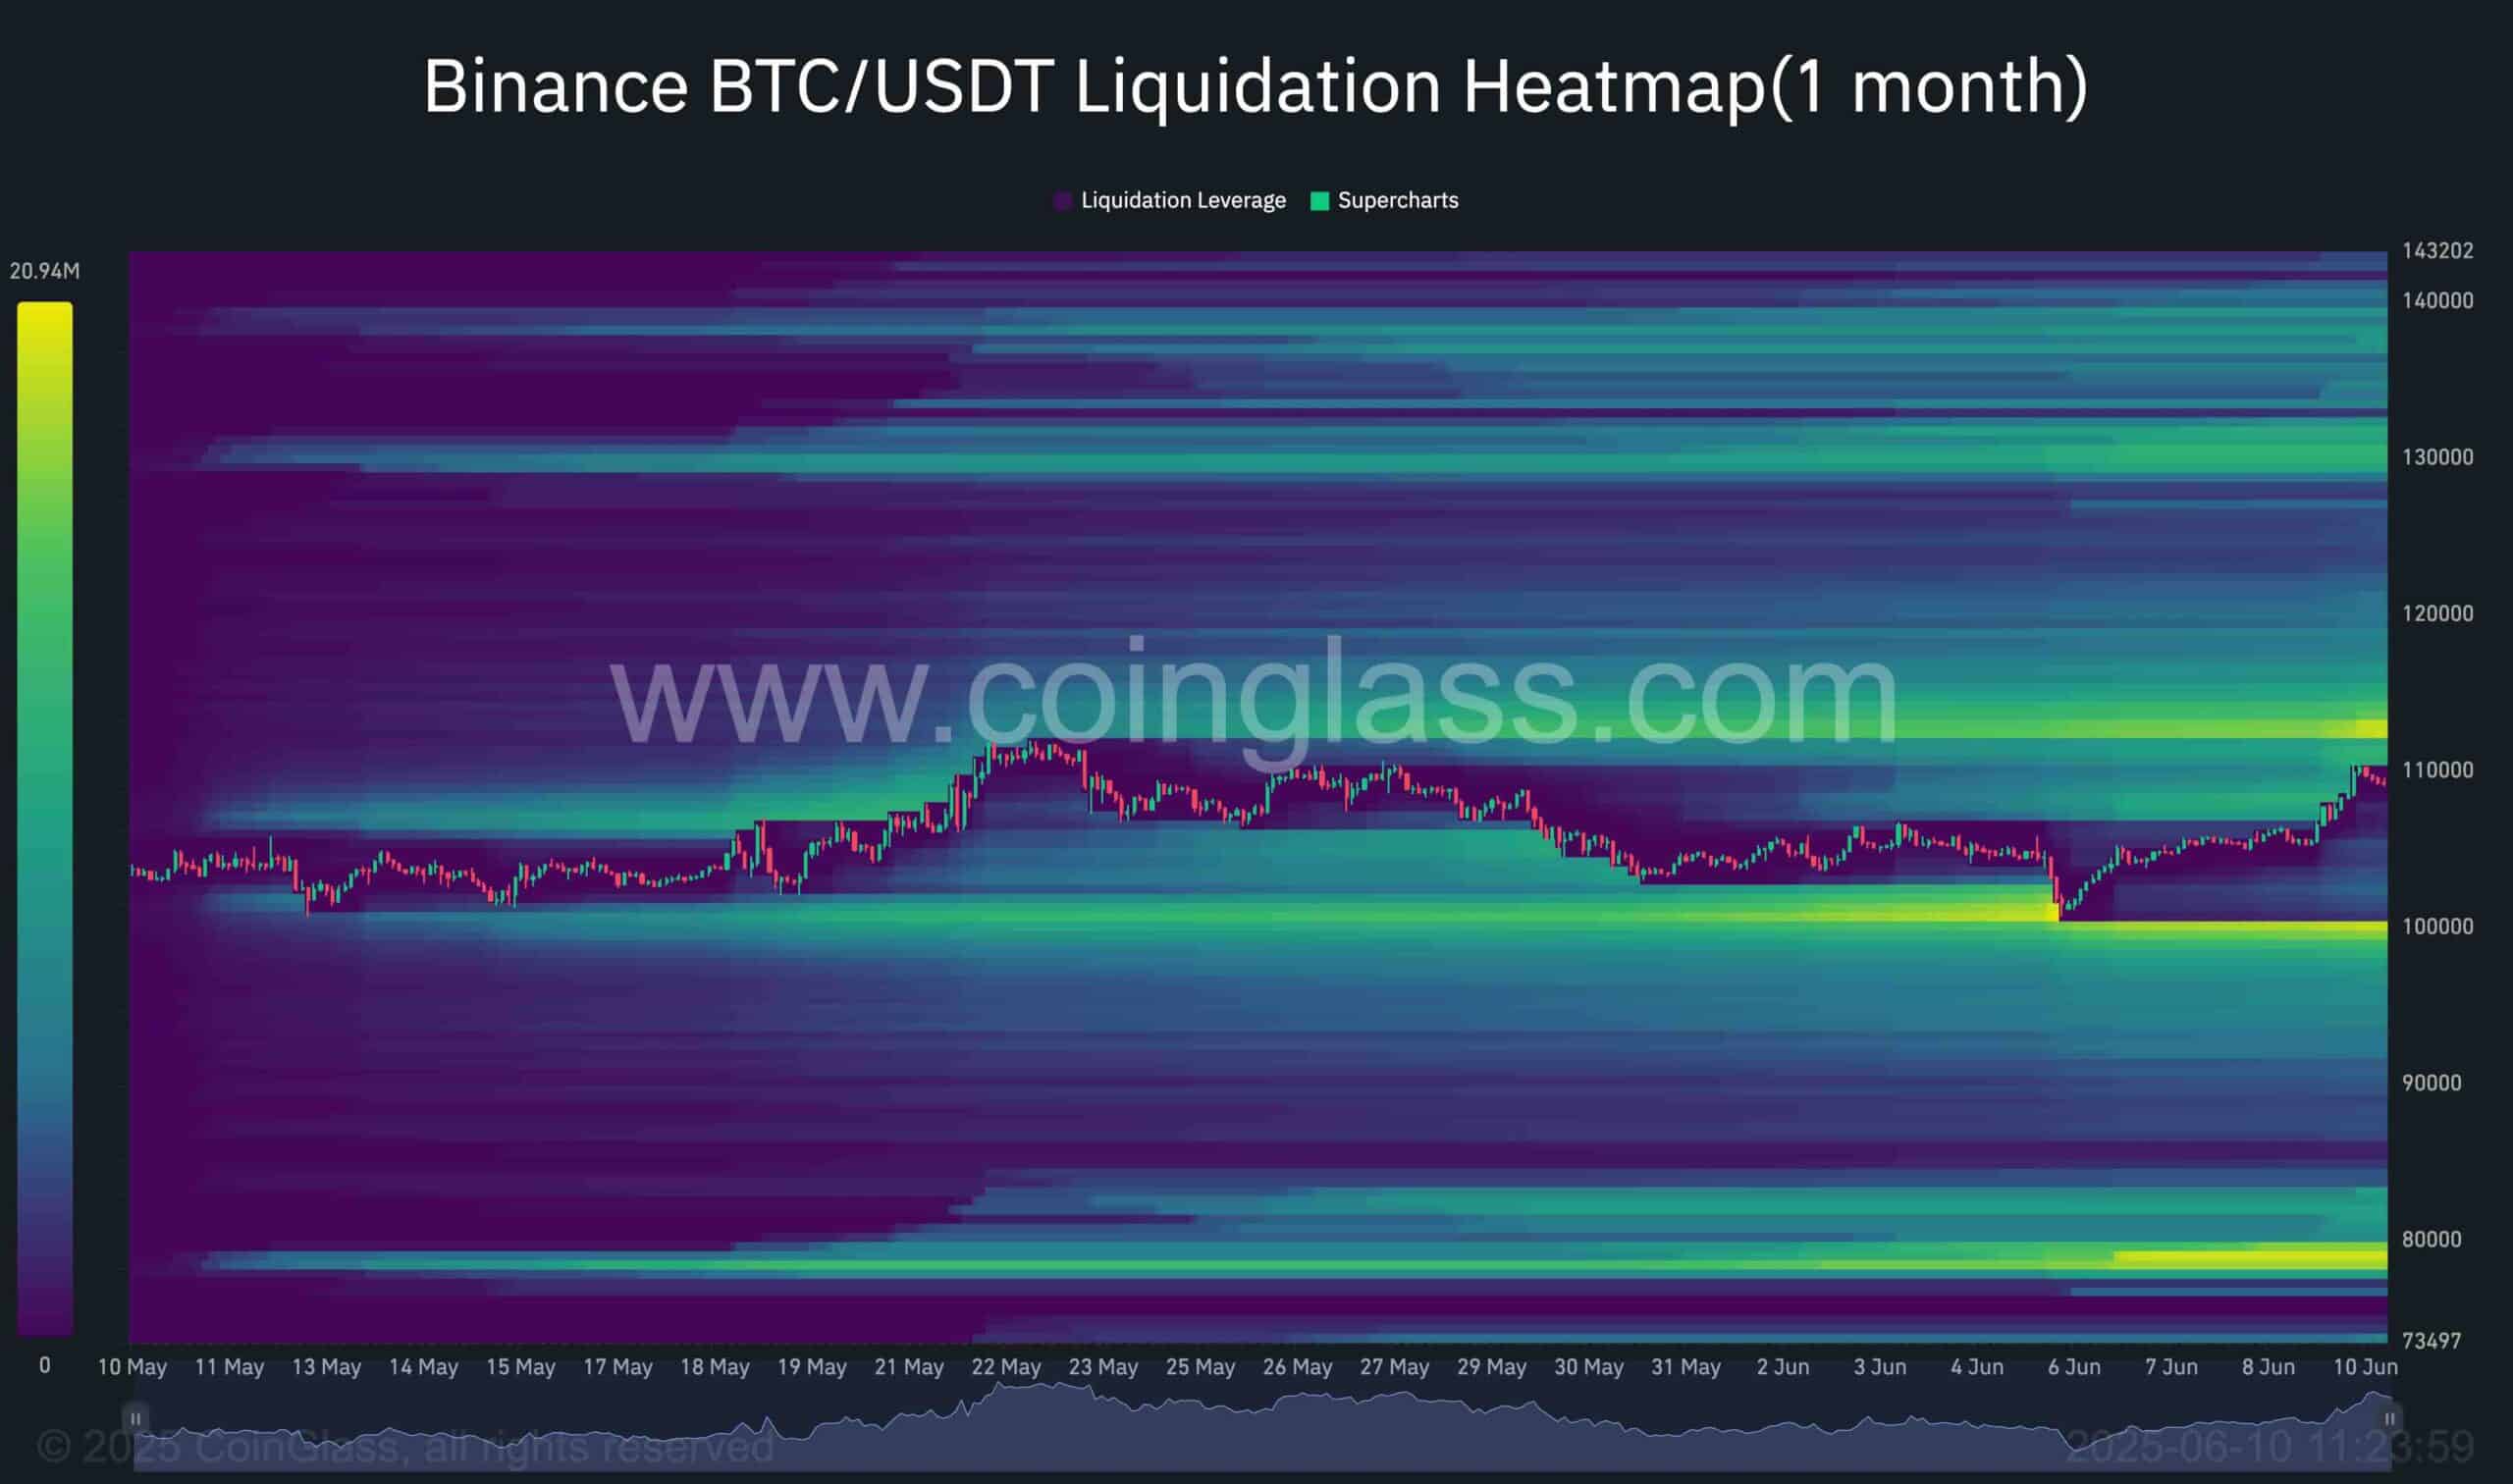
The post Bitcoin Price Analysis: Is BTC Ready to Break its All-Time High? appeared first on CryptoPotato.