Bitcoin Price Analysis: Hope? Bullish Pennant Forming As BTC Plunges To $43K
Bitcoin seems to be going from bad to worse, with another 7% price drop today.
BTC decreased by a total of $3,300 today as it dropped below $47,750 and also beneath the important support at $44k.
The cryptocurrency continued to spike downward, reaching as low as $43,000 before a slight rebound, as of now.
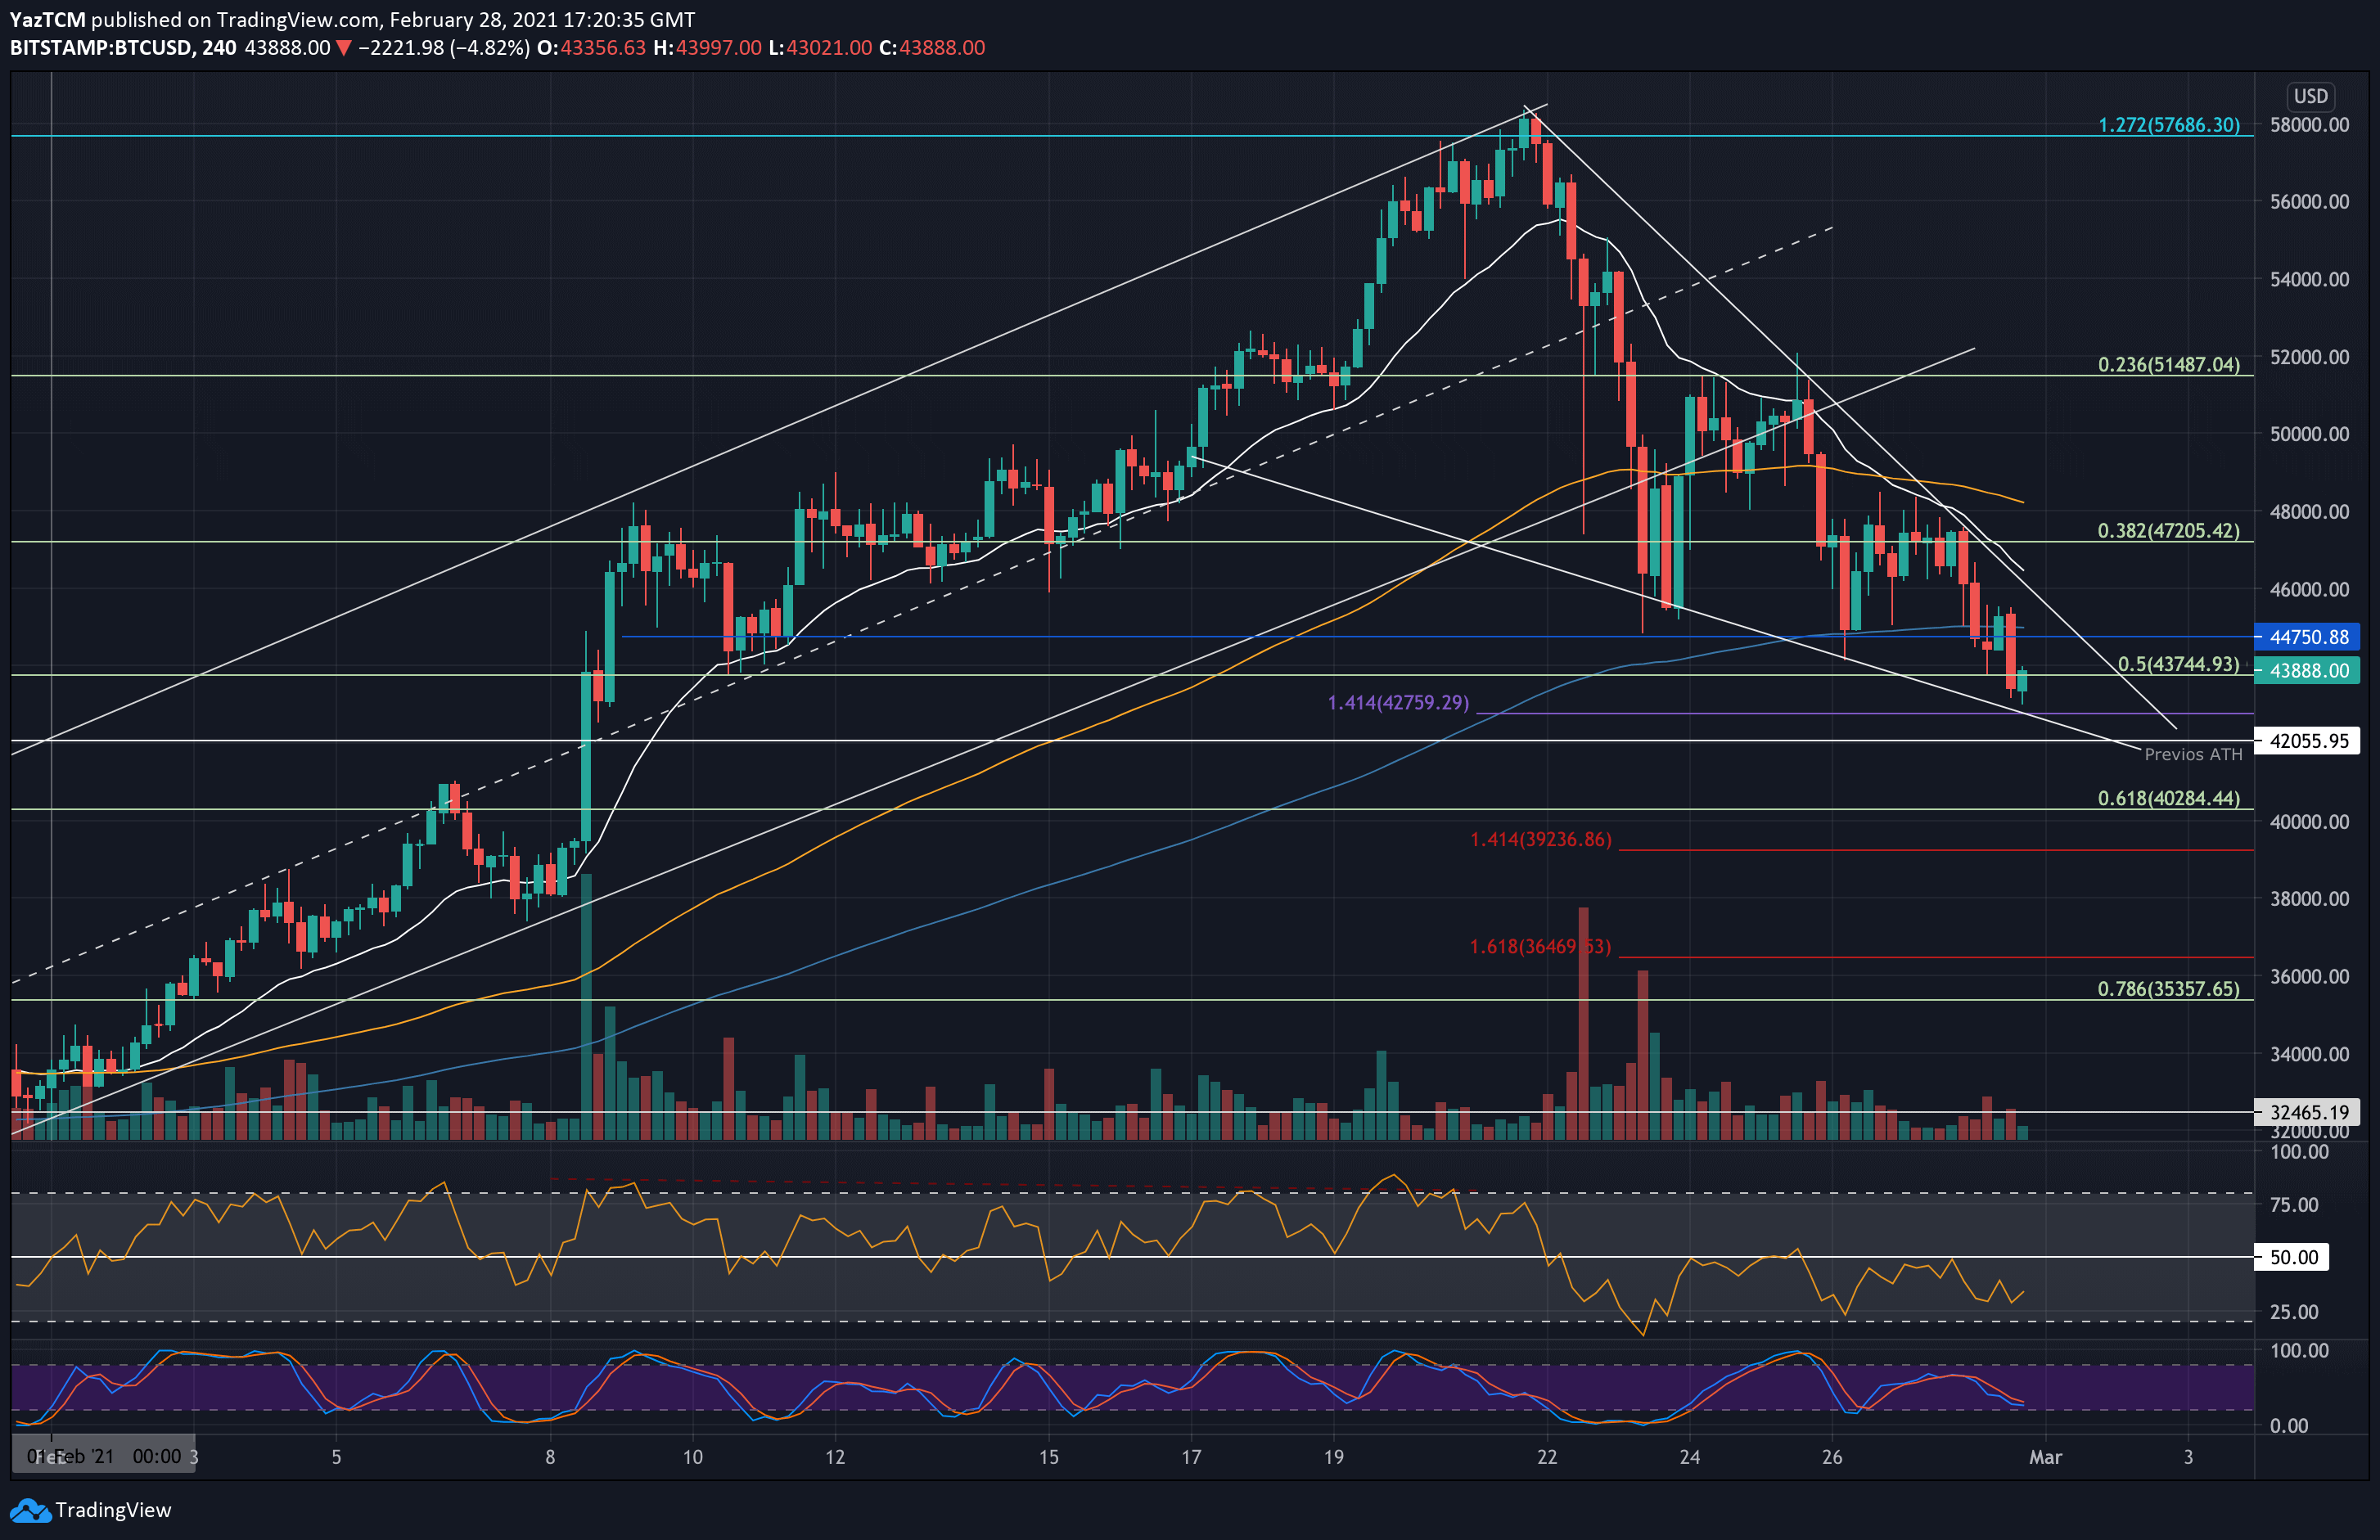
Looking at the short-term 4-hour charts, Bitcoin dropped off the support at the 200 EMA today as it broke beneath $44,750.
However, there might be some hope for the bulls. BTC might be forming a bullish pennant pattern as the market trends toward the lower angle (near $42,760).
The market is very fragile right now, and the short-term trend is certainly bearish until a breakout of this bullish pennant. On the other side, a collapse beneath the former ATH of $42,000 might send Bitcoin below $40K.
BTC Price Support and Resistance Levels to Watch
Key Support Levels: $42,760, $42,000, $40,286-$40,000, $39,240, $38,000.
Key Resistance Levels: $44,000, $44,750, $46,000, $48,000, $50,000.
Moving forward, the first level of support lies at $42,760 (downside 1.414 Fib Extension & lower angle of pennant). This is followed by $42,000 (previous ATH price), $40,286 (.618 Fib), and $40,000. Additional support is found at $39,240 (downside 1.414 Fib Extension – red) and $38,000.
On the other side, the first resistance lies at $44,000. This is followed by $44,750 (4HR 200-EMA), $46,000 (4HR 20-EMA), and $48,000 (4HR 100-EMA). Additional resistance lies at $50,000, and $51,480.
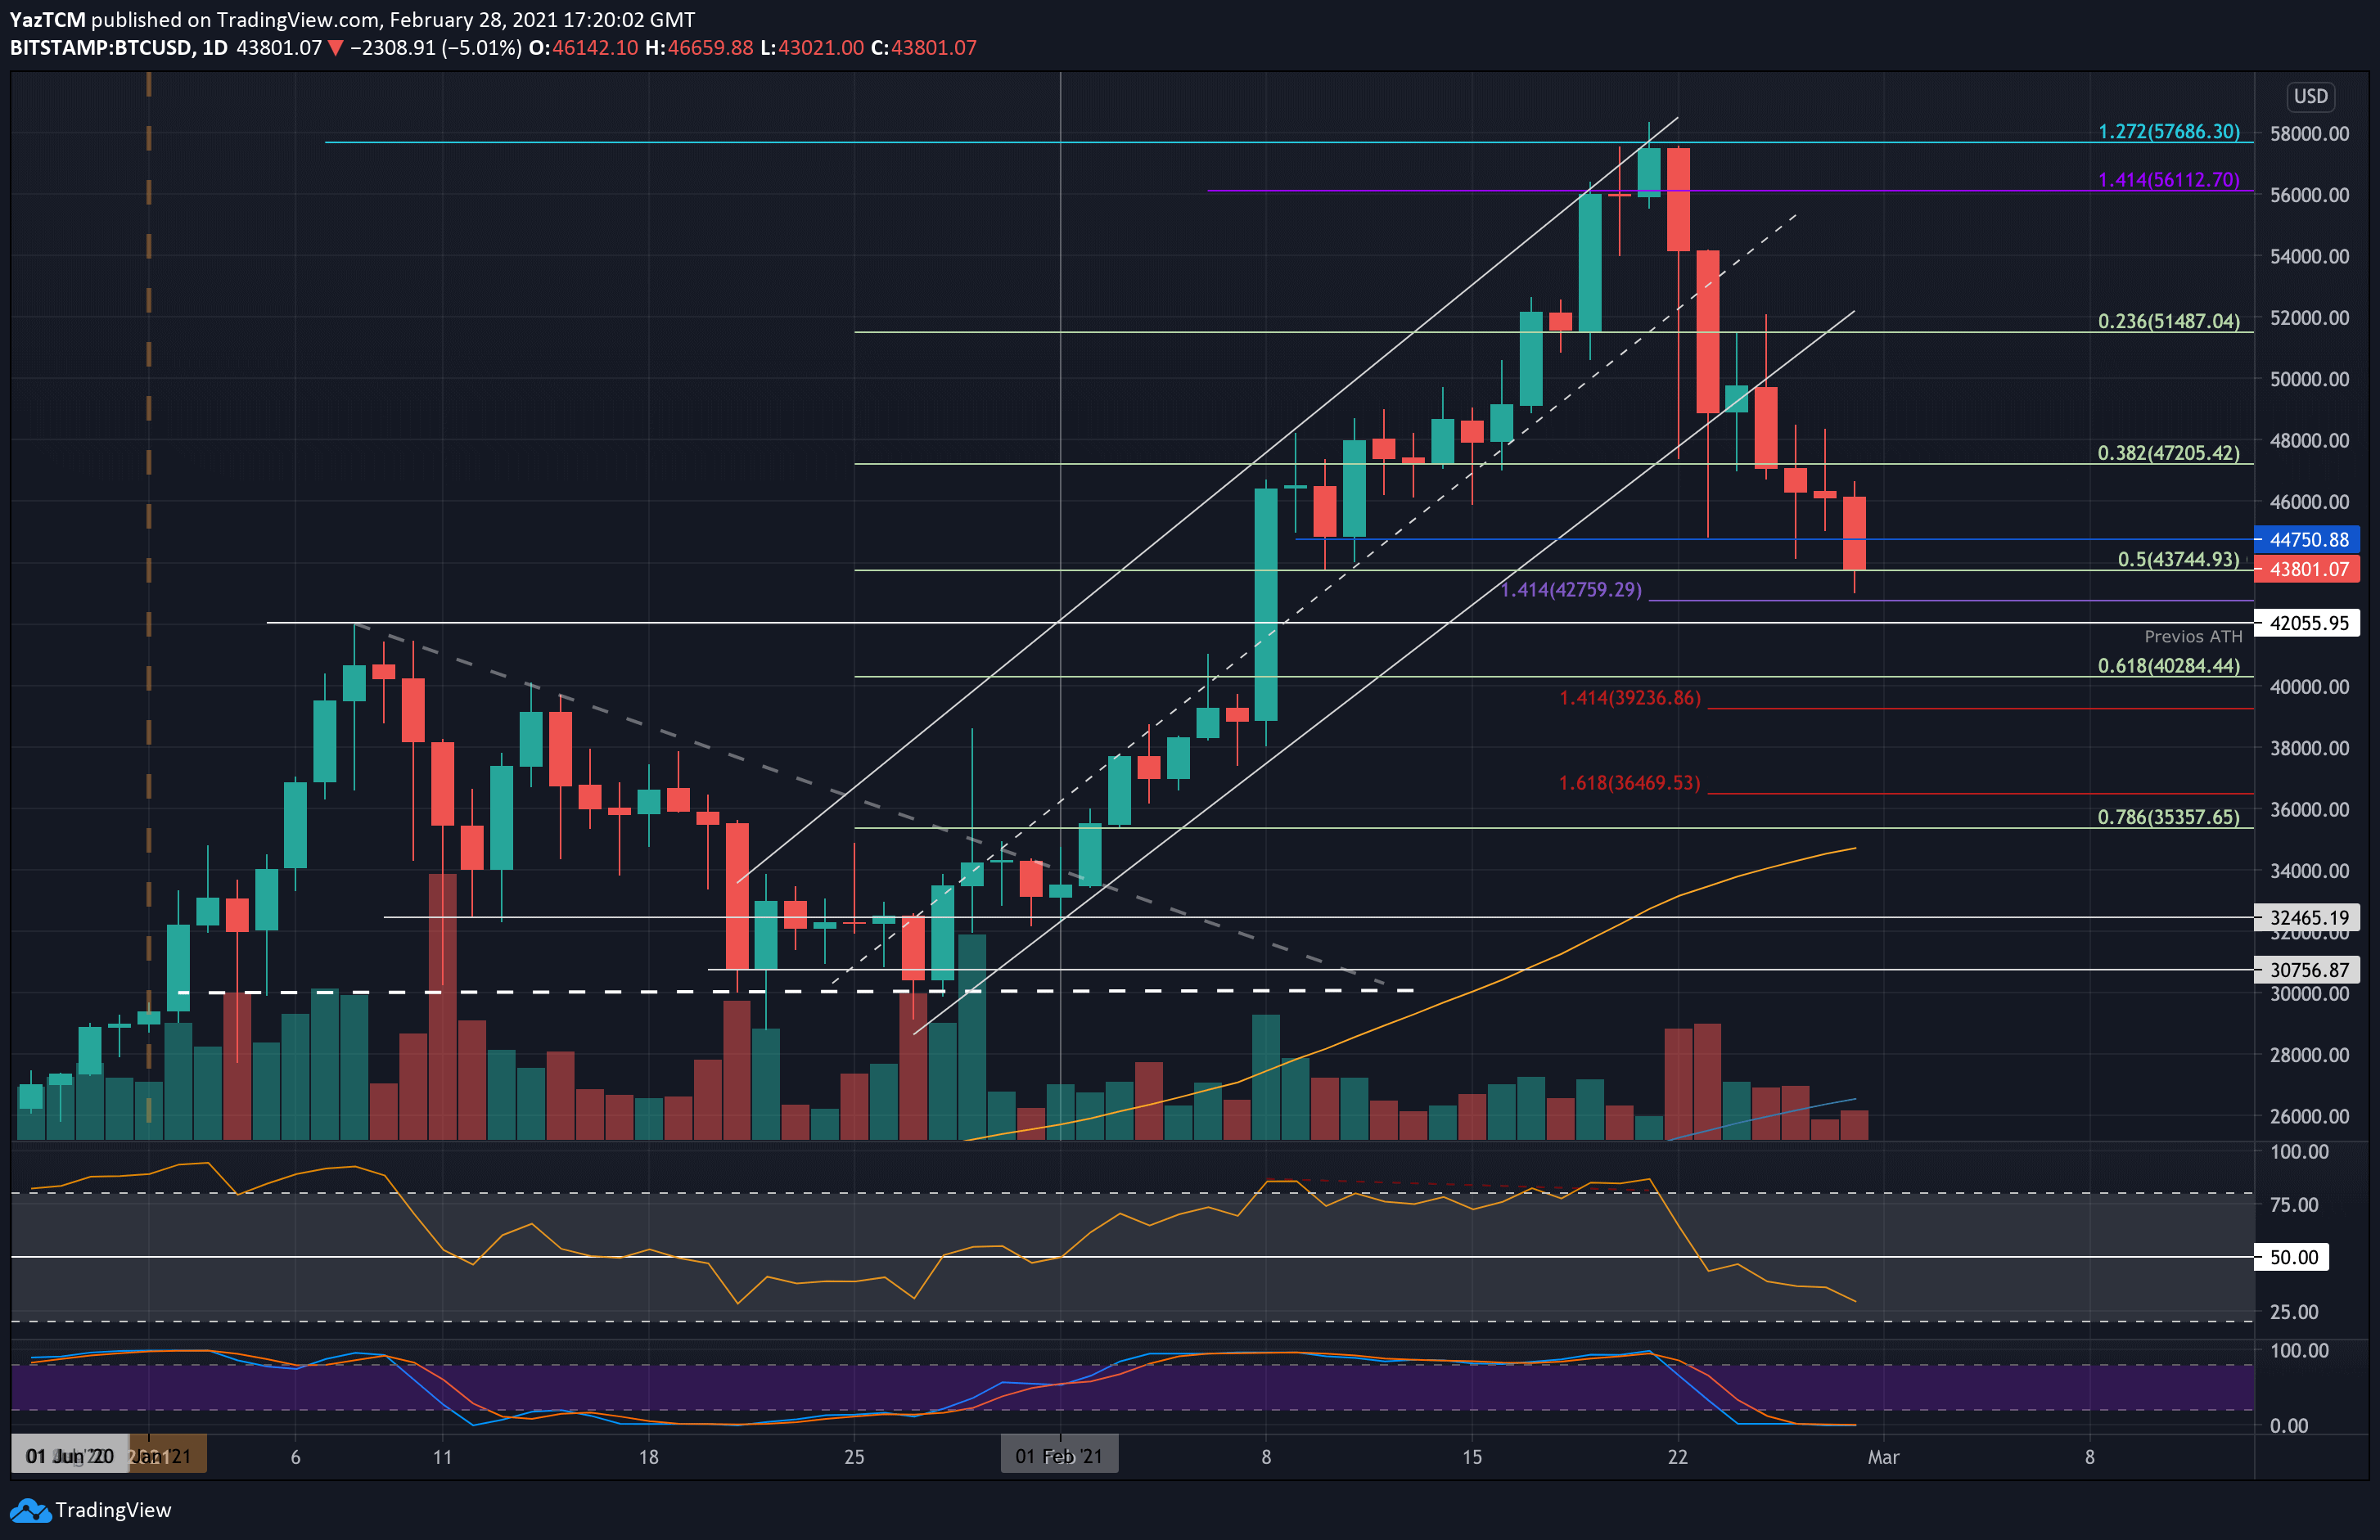
The daily RSI is showing that the bears are in total control of the market momentum. However, it is reaching a similar level to that from January 2021, when the market rebounded again. Additionally, on the 4-hour charts, there are strong signs of a bullish divergence as the price marks lower lows when the RSI makes higher lows. This is a strong bullish indicator and could be suggesting that a rebound is imminent.
Bitstamp BTC/USD Daily Chart
Bitstamp BTC/USD 4-Hour Chart